Natalia Anaya, John A. Rey Galindo, Marcelo Soares (2022). Redesign of Alarm Clock through Usability Evaluations. In: Advances in Ergonomics In Design, Usability & Special Populations: Part III. AHFE Open Access, vol. 20. https://doi.org/10.54941/ahfe1001314
University of Guadalajara, Calzada Independencia Norte No. 5075, Huentitán El Bajo S.H., C.P. 44250, Guadalajara, Jal, México, Av. Prof. Moraes Rego 1235 Cidade Universitária, Recife- PE – CEP. 50670-901, Brazil ↗
This research seeks to contribute in the construction of evidence concerning the importance of usability for design and processes to ensure that products, once they are in the context of use, have a performance consistent with the conditions and characteristics of the user. Above, it is intended to make clear that today's technology gives us basic tools that can be used to simulate an environment of use and test design proposals which, in the end, will be a more reliable and effective product. To achieve the above, assessed existing and from the problems of interaction detected electronic product, two proposals were generated of redesign, in order to recognize if there were improvements over the original artifact. These proposals were evaluated from the simulation of its operation and use to an Adobe Flash program and with a touchscreen platform. The results reflected significant improvements with the redesign in multiple aspects, in particular with the #1 proposal and it became apparent that even though in some ways the simulation does not replace the functional prototypes, it is a very useful tool for the design.
The integration of the user in the projective process allows the designer not only to better understand the problem of study; but specific decisions in relation to the characteristics of the product, under the more reliable principles just extracted from the analysis of the characteristics of the user, capabilities, limitations, expectations and later, on the way as the individual understands and interacts with the proposal or the projected object.
There is a concept which is essential for integrating the individual into the projective process and for this research will be essential support; This concept is usability that is attributed to any element that can be easily used (Nielsen, 2012). To this end it is necessary to put into practice usability as critical in the head of design method and enable designers to improve ease of use of the object that is projected to achieve a product that will be effective, efficient Ergonomics In Design, Usability & Special Populations III and will satisfy the user; to achieve specific objectives of the product. Integrate specific users to whom is directed the final product in the product development process by doing usability evaluations, allowing the designer not only to understand better the peculiarity of the user, capabilities, limitations and expectations; but, to know the possible errors that limit the goals of the product and modified it during the design process before the finished and final product. Jordan (2001) mentioned that is important to understand the characteristics of the people in these groups and then to take these characteristics into account when designing a product.
The concept of usability appears and begins to be developed in the field of human-computer interaction (S. H. have et al., 2000); focusing, in particular, in the area of software development, looking for a "friendly use" system (Nielsen, 1993). With the passage of time, became not only the concept of friendly use; also the structure that began to consolidate, permeated areas such as the development of products, becoming a value perceived even in commercial terms (Jordan, 2001).
More specifically, as already mentioned in previous paragraphs, the usability refers to ease of use in the interaction between an individual and an object in relation to particular targets. However the term “ease” must be revised a little more precisely, to understand what its components are and thus establish the elements that constitute what is referred to as usability. Patrick Jordan, mentioned, as he called it, a formal definition of the term, which leads to three key elements. This definition is taken by this author, of the International Standard Organization (ISO). Usability is defined as the effectiveness, efficiency and satisfaction with which a specific user can gain a few specific objectives in a particular environment (Jordan, 2001). Effectiveness refers to the degree in which a target is obtained, the efficiency is the time in which the objective is achieved and satisfaction to the level of comfort that the user obtains as a result of the established goal (Jordan, 2001) and their interaction. Satisfaction, according to Nielsen (1993), can also refer to how pleasant is the use. In both cases, recognized this factor as a result of the interpretation subjectivity of the user and even though it represents one major difficulty carrying out assessments on this, constitutes an element of vital importance within the goals of usability.
The variety of definitions of usability, are supported by a set of different elements that are recognized as its components. Madan and Dubey (2012), in a review of different authors approaches, point models of usability, which recognizes different aspects that are taken into account. Factors such as the ease of learning, efficiency, ease of memorization, errors and satisfaction, in the case of Nielsen or ease of understanding, ease of learning, operational, attractive and conformity in use according to the standard ISO 9126 (2001) (Madan and Dubey, 2012), represent evidence of the complexity of the term, but also, of the various aspects that structure the concept of usability. Is important to note that the usability model to use will depend of the project; however, in general terms, the usability is a very effective way to understand the possible paths to make better the interaction between people and products.
Searching for an everyday used object in the present research was evaluated with an alarm clock. The present study seeks to highlight the potential problems that may occur in the interaction with the individual in real conditions of use. This work consists of the evaluation of an existing product, the elaboration of proposals from identified and evaluated and the results of a new proposals; in order to recognize whether discovered problems in the initial analysis of the product have been corrected. It is worth mentioning that the results obtained will be used to continue the study up to a product that achieves the goals set with very few errors.
Figure 1: Alarm clock evaluated.
Figure available in the original PDF paper.
METHOD
In the present, research was evaluated by the effectiveness, efficiency and satisfaction, (principles raised on the concept of usability proposed by Patrick Jordan (2001) in the electronic product presented previously (Figure 1). In the assessment, the participants had the target to complete three different tasks, ordered from the easier to more complex. The three main factors analyzed were: 1. If the task was completed fully, 2: the time required to finish or change the task and 3: the number of errors in the interaction. This last point was based on a predetermined map for use in which the most basic routes were established to obtain the target in each of the tasks. Specifically the tasks were:
1. Tune to the radio station on 105.9 FM, turn the volume up to level 30 and turn off the radio. 2. Set the alarm clock at 4:00 am and use the iPod alarm function. 3. Set the clock to 10:35 pm.
The conditions were unified for the three tasks to prevent some influential factor in the performance of users. The participants received the instructions and basic information about the research targets. They were instructed not to ask questions during the interaction and asked them to give a warning when they finished a task or, if such, when they recognize the inability to carry it out.
In this first test, were 10 participants (5 women and 5 men), all of them university students aged between 20 and 26 years old. The users were chosen randomly and the only requirements to participate were: 1. Understand English language; 2: Not knowing the analyzed object, previously.
Four video cameras were used for recording the interaction between the users and the object; those video cameras were located in the four cardinal points with respect to the users. One of them was focused to recognize the display for identifying the device responses.
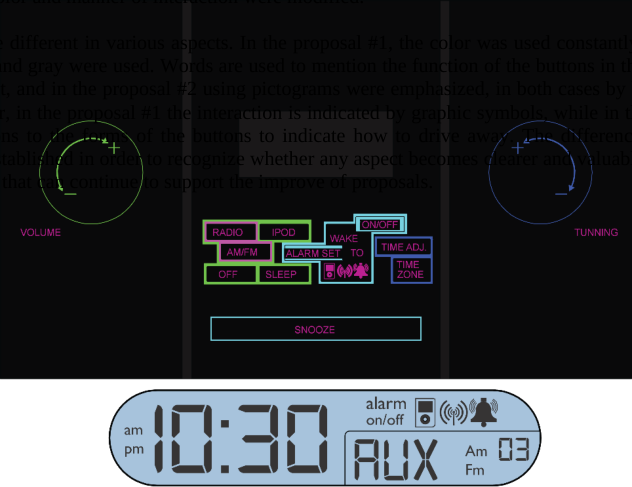
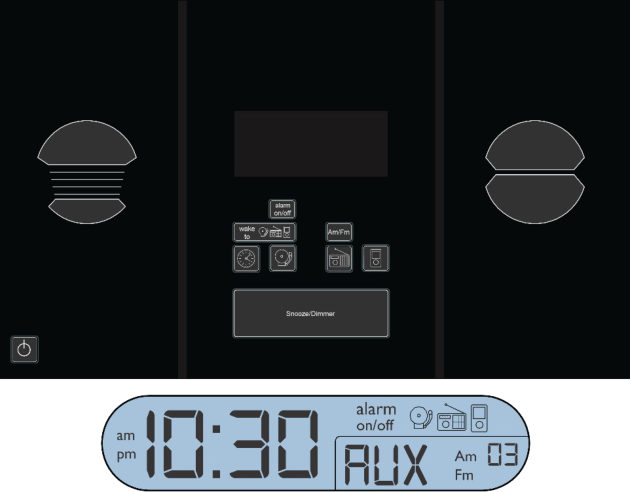
In the second part of the research, after obtaining the results of the first assessment, the development continued with two proposals for re-design, based on design principles proposed by Ernest McCormick (1980) and usability principles of authors like Laura Leventhal and Julie Barnes (2008). These proposals (Figure 2 and Figure 3), were programmed in Adobe Flash software, in order to recreate the actual operation of electronic product and thus evaluate the interaction of new users with these and recognize if existent or not, an improvement respective to results obtained in the first test. Both redesigns were evaluated each with a user group of 10 people (five women and five men), with the same profile as described in the preceding paragraphs who were asked to perform the same three tasks.
To perform the test, a touchscreen was used, for recreating the interaction between the user and the object. The proposals were made respecting the original device forms; making changes only in the control elements and their specific features.
In addition to the use of video cameras with interaction registered with Camtasia, the software allows recording what happen on the screen, giving more reliability to information in the analysis of interaction
RESULTS
Test 1: Analyzed object
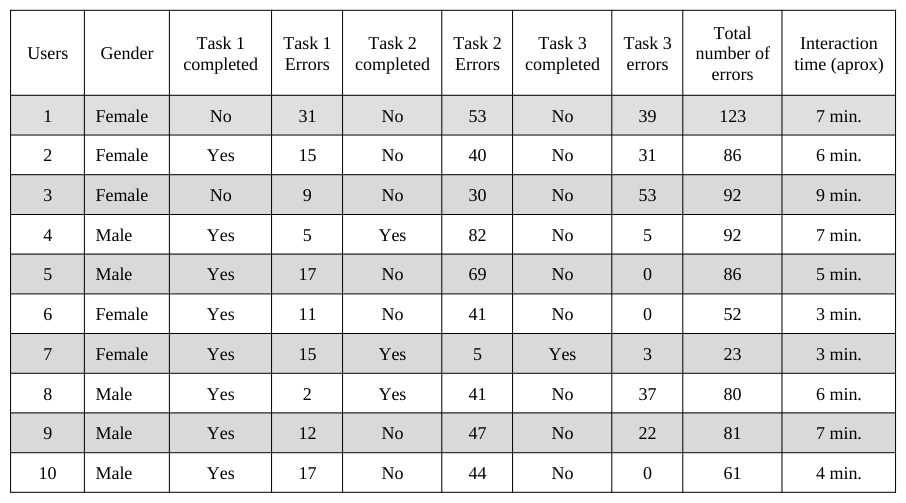
Just one of the ten participants completed the three tasks (table 1). Regarding time, that user had the best performance with an interactive time of 3 minutes and 23 errors in all (table 1). Mention that, although the enter action time of this user was very low compared with the other participants, this time is higher than the user expert time (1.5 min).
Eight of ten users could complete the first task; the highest number of errors registered was 31 and the lowest was 2. Only three users completed the second task; the lowest number of errors was 5 and the highest was 82 incorrect steps. Only one user completed the third task and registered 3 errors in the interaction (table 1)
Table 1: General results obtained in the interaction between users and alarm clock.Table 2: Average of number of errors and time in the analyzed interaction with the alarm clock Errors average Total time
The highest number of total errors was identified in the interaction of user 1. A total of 123 errors were registered (table 1), and the task number 2 was the most problematic.
Regarding time of interaction, the user 1 expends more time than the other participants, registering 9 minutes and 0 tasks completed (table 1). The total average of completed tasks was 1.2; it means that the most of the participants completed just one task. The average time to complete the tasks was 7 minutes, and there was only one user that completes all tasks, as mentioned previously. The highest number of errors was registered in the task 2; the errors average in that task was about 77.6 (table 2).
Purposes The following factors are some of the possible causes of the problems and errors registered in the interaction between users and object: 1. Lack of clarity in the buttons function. The users tend to push different buttons to identify which was proper according to the task at hand.
2. Some bottoms are located outside the visual range. Particularly in the case of task 3, the users could not find the button to adjust the time. It was located in the rear of the object. 3. The actuating of the buttons. The users had not identified the knobs; they tend to put pressure on them before identifying that it was a rotating element. With some buttons as in the alarm setting, it was necessary to put continues pressure for about two seconds to activate the function. That requirement was not identified by the users and they preferred to look for other options.
Two proposals were developed from the last three points and the principles of usability and design from the theoretical approach of some authors like Laura Leventhal and Julie Barnes (2008); E. McCormick (1980); Nielsen, (1993) and Jordan (2001). As mentioned in the method, these proposals were evaluated in order to recognize the change in the interaction in a positive or negative way.
The proposals respect the original structure and form of the artifact, nevertheless the characteristics of the buttons in terms of shape; color and manner of interaction were modified.
The proposals are different in various aspects. In the proposal #1, the color was used constantly; while in the other case, only black and gray were used. Words are used to mention the function of the buttons in the proposal #1, as in the original object, and in the proposal #2 using pictograms were emphasized, in both cases by buttons, knobs were changed, however, in the proposal #1 the interaction is indicated by graphic symbols, while in the proposal #2 were some modifications to the forms of the buttons to indicate how to drive away. The differences between the two proposals were established in order to recognize whether any aspect becomes clearer and valuable for the interaction and in that sense, that can continue to support the improve of proposals.
In usability field, there are many methods to evaluate the interaction (Kwahk and Han, 2002); however, in some cases, the assessment is difficult to perform, because of the lack of time or resources to build functional prototypes to test, especially in products with complex electronic components. In this context, the simulation constitutes a very useful option to test the design proposals and finally it allows us to make decisions with more reliable information. In that sense, the new proposals were evaluated using simulations programmed. The software used was Adobe Flash and a touch screen was utilized to recreate the interaction.
The second part of the test assessed two proposals explained above. These assessments were conducted with 20 users, 10 for each proposal, consisting of 5 women and 5 men for each one.
RESULTS
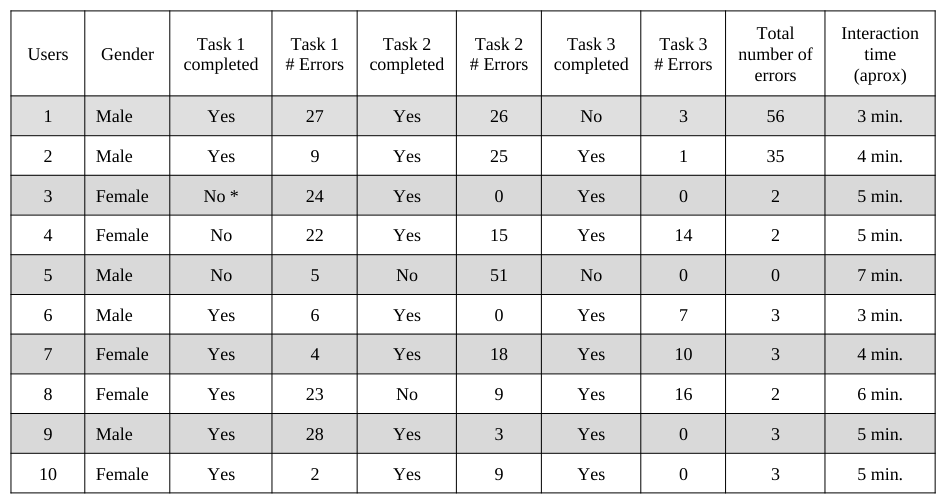
Test 2: Proposal #1 The first design proposal obtained significantly improved with time (3 min) and a minimum of error (0) compared to the initial test that took place with the physical product. It was a motivator result of users, who completed the three tasks (5 out of 10) even if one of the users (user 3) was unable to complete the first task because of programming problems. Tasks 2 and 3 were completed with 8 users while the task 1 with 7 users. Only one user (5) was unable to complete any of the tasks, obtaining a maximum (51) error in task 2. In two cases (6 and 8) the lack of comprehension of the reading instructions, resulted in turning off the radio and in the case of the user (1) omitted the 3 tasks also because of lack of focus on reading the completed instructions. (All of this is evident in table 3.)
The average interaction time was 4.7 minutes, completed tasks averaged 2.3; the average number of errors in the task 1 was 15, in the second task was 15.6 and the third task was 5.1. The total errors averaged 11 per user (Table 4).
Table 3: General results obtained in the interaction between users and the proposal #1.
* The task couldn´t be concluded, because of programming problems.
Table 4: Average of number of errors and time in the analyzed interaction with the proposal #1 Errors average Total time
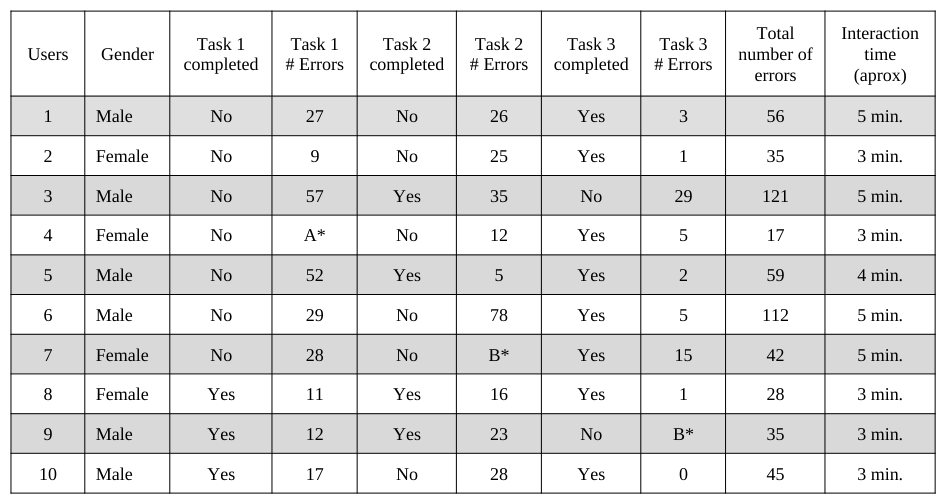
Test 3: Proposal #2 Only one user (User 8) of the 10 managed to finish properly the three tasks. It recorded a total time of interaction of 3 minutes approximately and had a total of 28 errors. Task 1fewer users completed. Just three of them completed it; four users completed the second and the third was completed by eight of the 10 participants. The maximum number of errors was 78 and was recorded in the task 2. The lowest number of errors was 0 and was recorded in task 3. The Ergonomics In Design, Usability & Special Populations III maximum total interaction time was five minutes in 1, 3, 6 and 7 users and the minimum of three minutes in 2, 4, 8 and 9 users. The maximum total number of errors was recorded by user 3 with 121 and the total minimum of errors was recorded by the user 4; 17 However, this user completed just one of the three assigned tasks. All of the above is shown in table 5.
The average interaction time was 3.9 minutes, completed tasks averaged 1.5; the number of errors in the task 1 averaged 26.8 in the second stint was 27.5 and in the third task of 6.7. The total errors averaged 55 per user (Table 6).
Table 5: General results obtained in the interaction between users and the proposal #2.
A * occurred a programming problem to prepare the test for the user, which made the user find different conditions to carry out the task 1. B * users failed to perform the task.
Table 6: Average of number of errors and time in the analyzed interaction with the proposal #1 Errors average Total time
DISCUSSION
The evaluations carried out with proposals 3 and 2 of redesign; they showed some valuable aspects to take into account. In the first instance, we recognized some significant improvements, particularly in proposal #1, which proved to be the most clear and in that sense, the most effective. In particular, the #1 proposal evaluation showed that many of the errors in the original design, were corrected successfully. The number of errors decreased effectively; from an average of 77.6 to one of just 11 errors; resulting in an approximate decrease of 85% approximately. The time of interaction also decreased from 5.7 to 4.7 minutes.
The proposal #1 five of the ten users managed to complete three tasks, which contrasts the only user that completed all the objectives in the interaction with the object analyzed initially. Another point of comparison is the difference that is recognized in results in the first task; in the case of the original radio only two of the ten users could not complete the task. Proposal 1, the number of failures is increased by one. This can explain the confusion caused by the existence in the design of a glyph-shaped curve in knobs, that represents the rotation of the same, however when the programming was conducted on the touch screen symbols you should press of +/- and not move as indicating the glyph (see Figure 1).
While it is necessary to continue debugging the proposal, the average number of tasks is encouraging in the case of the #1 proposal, since it is becoming clear that the vast majority could complete at least two of the three tasks. In this regard, recognizing a significant change in the results of the task 2 and 3(in #1 proposal); that eight out of ten users were able to achieve them successfully, compared to the three users that got task 2 and one user that managed to complete the task 3 in the evaluation of the actual appliance. This may be due to the change of location of the buttons that were outside the viewing area of the user, transferring them to a much more visible and clear area in the original object.
The evaluation of the proposal #2 had several interesting results, compared with the findings of the original artifact. In the first instance, as in the first test, only a user managed to successfully complete three tasks, showing little evidence of the effectiveness of the proposal. However, there are some differences that are noteworthy. In the first instance, interaction times were markedly lower in the number of errors. In the case of the object evaluated, the user who had more interaction with it, resulted in a time of 9 minutes, compared to the 5 minutes in the proposal. The number of errors was also lower, from a total average of 77.6 errors one of 55 in the three tasks.
The user who managed to complete the three tasks with the proposal of redesign #2, recorded the same total time of the first user who completed the three tasks with the original object; the latter however made five mistakes fewer, which continues to support the lack of effectiveness of the elaborated proposal.
One of the points to rescue the proposal of redesign is that the total number of completed tasks was slightly higher with 15, against 12 that were recorded with the device in the first test. This suggests that the redesign proposed barely reaches 50% reliability in regards to understanding the way users can have on how you should operate (strengthened with literature).
Another important point is that, although in general terms there was no major changes with the redesign #2 with respect to the results thrown by the original design, recognizes a clear change in the results, in relation to the easier task and the most complex for users. In the case of the original artifact, task 1 with 8 users who managed to complete it, was the clearest to participants, in contrast to the third task that only a user was unable to complete. In the case of the proposal of redesign #2, it was the task 1 which registered lower numbers; only 3 users were able to get it, which contrasted with the eight users who obtained the task 3. This suggests that they were recognized and they corrected the main problems detected in the original product, the three task, but were not taken into account the good results in the first task, by reversing the found situation. This is very important in the usability analysis and time to consider changes, because it is evident that the problems and ways to correct them, have not only been detected, but also must recognized its successes and try to keep them to avoid, as in this case, that the situation does not show substantial improvements.
From detected through the videos, it was recognized that one of the problems in the redesign #2, was the lack of clarity of the glyphs and the layout of some of the buttons, which were confusing to users and in that sense, made little effectiveness to achieve tasks. This was evident in the second task; while the vast majority of users had completed most of the steps, the confusion of the pictogram of the alarm clock prevented them to achieve the proposed objective, which in the end, had the poor results that was shown previously (table 1).
Regarding the simulation process, there are certain elements that are worth mentioning. In the first instance in some cases the programming of the functioning of the buttons with which they interacted with users, presented some disadvantages that were reflected in the interaction and that modified some behavior by individuals. These unexpected situations may change not only results in quantitative terms, but that the same layout by users may be affected. It is therefore important to debug the most simulated operation to move it as much as possible to the actual operation. In second place, it is worthy what even though the touch screen option turned out positive, the feeling that you get when you interact with it is different which could exist in controls in three dimensions. Although this aspect was not evaluated, it is important to mention the importance that it can have on the dynamics of the interaction user object.
Used for interaction tools presented some negative points and others positive that is worth mentioning. As negative elements is that programming requires considerable time, which can vary depending on the complexity of the operation of the item to evaluate. Even though the program is often used in areas such as design, it requires a considerable knowledge in the management of the software, to obtain the results that you are seeking, taking care that their operation will be as close to the real thing. In relation to the screen, as mentioned above, the sense obtained by the user to activate a 3D button is noticeable different from accessing a touch screen, which can play a very important role in the interaction of the user with the element. To do so more test will be required that would allow access to touch sensation and set closest to the expectations of the potential users.
CONCLUSIONS
The three tests produced interesting results, as evidence of the need for implementing usability assessments that allow subjects to analyze the proposals of design and thus make more reliable products that arrive at the hands of the user. The iterative nature of the usability analysis allows that to assess different options and aspects of products, giving the possibility to explore possible routes for best results in the interaction between the human being and the products. Tools such as those used in the present study show that in some cases it is possible to simulate a situation of use with little specialized resources and easy acquisition, which avoids resorting to actual production processes and can carry out various evaluations, implementing different solutions unless it involves large investments.
While acknowledging that not all the usage features, replace this type of simulations in particular because it occurs in a two-dimensional plane, it is very effective to assess how the individual can come to understand how to operate an electronic product and primordial aspects to consider to define a final proposal.
In order to expand, this research is intended to increase the number of users that the interaction is evaluated to give more reliable data and evaluate the latest products.
REFERENCES
Han, S., Yun, M. H., Kim, K.-J., & Kwahk, J. (2000), “Evaluation of product usability: development and validation of usability dimensions and design elements based on empirical models”. International Journal of Industrial Ergonomics , pp. 477 - 488. Jordan, P. (2001). An Introduction to Usability. London, U.K.: Taylor & Francis Ltd. Leventhal, L., & Barnes, J. (2008). Usability Design . California: Pearson/Prentice Hall. Madan, A., & Dubey, S. K. (2012). Usability Evaluation Methods: A literature review. International Journal Of Engineering
Science and Technology , 04 (2), 590 - 599. McCormick, E. (1980). Ergonomía. Factores Humanos en Ingeniería y Diseño. Barcelona: Gustavo Gili. Nielsen, J. (1993). Usability Engineering. San Diego: Morgan Kaufmann. Nielsen, J. (2012, Enero 4). Nielsen Norman Group. Retrieved junio 2013, from www.nngroup.com: http://www.nngroup.com/articles/usability-101-introduction-to-usability/
LISTED IN THE AHFE DIGITAL BOOKSTORE CATALOGUE
Explore the complete digital volume
Advances in Ergonomics In Design, Usability & Special Populations: Part III
Read this individual research paper free through the original publisher, or explore the full digital proceedings book.
ISBN 978-1-4951-2108-1
Explore this ISBN in the AHFE Bookstore ↗Listed in the July 2026 bookstore catalogue; search by ISBN to confirm current availability · Digital book purchase optional