Yufei Li, Sun Woh Lye, Terry Teo, Shi Yin Alden Tan (2022). Design issues in setting up of a highly synchronous human-in-the-loop system. In: Human Interaction & Emerging Technologies (IHIET-AI 2022): Artificial Intelligence & Future Applications. AHFE Open Access, vol. 23. https://doi.org/10.54941/ahfe100861
1 Air Traffic Management Research Institute, Nanyang Technological, University, Singapore, 637460 ↗
2 Air Traffic Management Research Institute, Nanyang Technological University, Singapore, 637460; School of Mechanical and Aerospace Engineering, Nanyang Technological University, Singapore, 639798 ↗
In Human-machine interaction, information is communicated between a human and the machine via user interfaces. Consequently, the measures and level of insights that can be derived from such studies will be dependent upon the context under which the experimental setup was designed for. This paper highlights a successful highly synchronous human-in-the-loop (HITL) experimental system that can be used to measure situational awareness in Air Traffic Monitoring. The system setup consists of a NARSIM radar interface that displays the relevant aircraft information, a secondary control computer for the recording processing, and storage of the captured neurophysiological inputs, a remote eye tracker, and an electroencephalogram (EEG), the latter two of which provide the input. In setting up such a system, discussion of key design consideration on system compatibility and information transferability, spatial and resolution accuracy, data input sources and synchronization, software selection, and the ease of results validation will be made.
The pervasiveness of automation in the lives of the modern human highlights the importance of Human-Machine Interaction (HMI) – which involves two-way communication between the machine and the user (Liu et al., 2018; Zhang, 2010). HMI models can be utilized to analyze these interactions systematically and quantitatively; a feedback loop is also formed between the operator and the system. Through an interface, the machine’s information output allows the operator to provide feedback input to control, monitor and interact with the hardware and software through images, mouse-clicks, and key-board commands, all presented on a display screen (Zhang, 2010). When conducting HMI studies, it is important to have human- in-the-loop (HITL), enabling outcome adjustments by the user in response to events happening in the simulations (Tomaszewski, 2021). Their physiological properties captured by biosensors would then be able to serve as an evaluation tool for training purposes and decision studies through the eye-tracker, the electrocardiogram (ECG), or electroencephalogram (EEG). Furthermore, HITL allows human-machine teaming, achieving solutions that neither the human nor machine can achieve on their own. An example of a HITL study would be the simulation conducted by the Federal Aviation Administration (FAA) as an assessment method allowing Air Traffic Control Officers (ATCOs) to evaluate new automated processes by controlling simulated traffic while monitoring the influence of newly introduced protocols (Sollenberger et al., 2005). To create effective studies and realistic experimental designs, it is often a good practice for the experiments to be highly synchronous, for the real-time capture of physiological response within 100 milliseconds (ms), which is perceived as instantaneous (Miller, 1968).
This paper discusses the design of a human-in-the-loop experimental setup for an ATCO Controller Working Position (CWP). Five design considerations in setting up the system will be discussed namely 1) system compatibility and transfer of information, 2) spatial and resolution accuracy, 3) data input sources and synchronization, 4) software selection, and 5) the ease of results validation. In Section 3, the detailed specifications in the current setup, including a 1:1, 1920 x1920 px Full High Definition (HD), radar display interface that exhibits aircraft information, a secondary Windows 10 control computer with 16 GB Random Access Memory (RAM) for the re-cording and processing of the captured neurophysiological inputs, a remote eye tracker with 30 Hz capture rate, and an electroencephalogram (EEG) with 256 Hz sampling rate will be presented. After factoring in these design issues, a successful setup has been established, with raw data from various devices synchronized on a single system time within 100 ms.
SYSTEM DESIGN CONSIDERATIONS System Compatibility and the Transfer of Information
In designing a Human-in-the-Loop (HITL) system, due consideration should be given to the compatibility of the various systems in the same framework within which the components interact. This is achieved by ensuring that the two or more component systems involved can interact successfully within the same environment. Further, each part must also perform their expected tasks independently without hindrance to the effectiveness and workability of the other parts (Pwolf, 2009). Achieving this requires checking the input and output requirements of the various components to ensure that their computing specifications can be met by both the hardware and software applications to be used. In our CWP setup, radar simulations were run at a refresh rate of 60 Hz and re-quires a minimum bandwidth of 6.64 Gbp/s for data transfer. Proper bandwidth integration according to the bandwidth requirement allows for undisrupted operation. This element is crucial especially for setups aiming to satisfy the real-time criterion.
Spatial and Resolution Accuracy Where eye tracking is concerned, proper spatial set-up and resolution accuracy is important in the collection of quality data (Funke et al., 2016). An inadequate degree of accuracy may result in difficulties processing fixations that are near two aircraft markers due to the larger buffer region required on each marker. These accuracies are affected not only by hardware limitations but also highly dependent on attributes of the experimental set-up such as screen size, screen resolution, aspect ratio, size of stimuli and distance of the participant eyes from the screen. In the pursuit for a more ecologically valid experiment, display screens used such in air traffic control
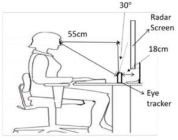
Human Interaction & Emerging Technologies (IHIET-AI 2022) Artificial Intelligence & Future Applications https://openaccess.cms-conferences.org/#/publications/book/978-1-7923-8989-4 environments are usually more than 28 inches. However, most eye trackers have a lower recommended screen size (22 – 25 inches), resulting in unregistered screen fixations. In these scenarios, eye trackers were offset away from the screen to obtain a larger capture area (See Fig. 1).
Figure 1: Eye tracker setup with 18cm offset from the radar display (Wee, 2019).
Another reason why offsetting of the eye tracker may be required is due to mismatch in aspect ratio. Aspect ratio pertains to the horizontal screen's size ratio to it vertical dimension. Mismatch in aspect ratios between the eye tracker’s recommended 16:9 and actual 1:1 aspect ratio of display used is also a point of consideration. Depending on the aspect ratios, the coverage of the eye tracker's sensor may not fully encompass the display. Figure 2 – Left shows a representation of how variances in aspect ratios can affect experimental requirements.
Figure 2 – Left: Orange: 16:9 display; Blue: 1:1 display of equivalent diagonal size; Green: Area of coverage required by eye tracker if 16:9 aspect ratio of eye tracker is fixed. Right: Representation of two neighboring stimuli The interplay between the stimulus size, screen resolution and distance are paramount to the spatial accuracy and precision obtained from the eye tracker (Holmqvist et al., 2012). By offsetting the eye tracker away from the display while maintaining unchanged distance from participants, the eye tracker’s capture area can be effectively managed (from the orange area to the green area), capturing the area of screen not observed by the eye tracker under non ideal conditions (See Fig. 2 – Left). Stimuli sizes that are small in nature will require a higher degree of accuracy as larger buffer regions around individual stimuli are undesirable due to the confoundment when assigning fixations to individual stimuli within the same vicinity (See Fig. 2 – Right). This buffer region has a 35-pixel tolerance radius with our current set up (Wee, 2019). To facilitate the visual clarity of stimuli, especially for detailed environments, a higher resolution screen, along with minimal offset of the eye tracker from the screen, is desired. The HDMI splitter used in the experiments has a built-in equalizer, a re-timer, and drivers, providing video output resolution and synchronization up to 4K at 60Hz in 24 bits RGB. This in turn provides for visual clarity of stimuli to the participants on the output radar display.
Data Input Sources and Synchronization Proper synchronization of different input sources is a point of consideration in the attempt for quality and accurate data output. Synchronization can be achieved by storing and integrating data from different devices firstly in a single data format, and secondly, on the same timeline. When performing our HITL studies, the output from the Tobii eye-tracker (30Hz capture rate), integrated into the system with a maximum error of 33ms (Wee, 2019), is mapped onto the same timeline as the Muse EEG, which samples at 256Hz with a maximum latency of 40 ms ([Equation or mathematical symbol available in the original paper PDF] 20ms) (Krigolson et al., 2017), and processed by the iMotions (iMotions, Denmark) software for synchronization. This timeline uses the internal clock of the control computer to allow for better precision in capturing the required data. In this setup, a standard 13-digit posix timestamp representing the time recorded in milliseconds, is used that has passed since 00:00:00 Coordinated Universal Time (UTC), 1 January 1970. This reference point, first introduced by Unix operating systems, is known as epoch and it is independent of any other events (Wee, 2019; Matthew and Stones, 2008). This is not to be confused with the Windows Win32 epoch Filetime, which records time in the form of 100-nanosecond intervals since January 1, 1601.
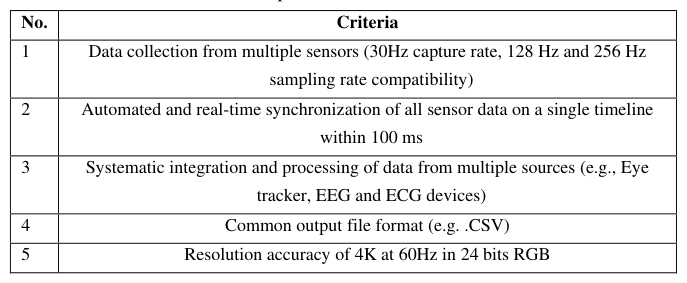
Software Selection The right software is an important consideration for the smooth running of HITL studies. Prior to the execution of software selection, a good practice is to define the requirements and functionality desired from the software for the study. This not only streamlines the data integration, but also aids in data processing. Table 1 illustrates some of the criteria used in the software selection.
Table 1: Example of software selection criteria No. Criteria
Ease of Results Validation The validation of data collected can be achieved by quantitatively analyzing the results, usually done via statistical analysis. However, before the assessment, data collected should be validated with ease, to allow room for efficiency in cross- referencing of data and minimal humanistic errors in performance of results validation. Assessing the ease of results validation may be broken down into three
Human Interaction & Emerging Technologies (IHIET-AI 2022) Artificial Intelligence & Future Applications https://openaccess.cms-conferences.org/#/publications/book/978-1-7923-8989-4 factors, namely: 1. the psychometric properties of instruments; 2. The consistency of experimental data; and 3. the readability of results. The psychometric properties of the instruments are defined as the validity and reliabil-ity of the instruments in the ability for them to measure and achieve their designed purpose. To make sense of the data generated from quantitative research instruments, it is necessary to understand their psychometric features (Fonseca et al., 2013). In this study, the NLR’s Air Traffic management Real-time SIMulator (NARSIM) radar display interface used has proven to be a reliable research tool for ATCO CWP studies (NLR, 2018). The Tobii Eye- tracker is also a valid tool in the collection of ocular data and research involving eye- tracking (Wee et al., 2019; Brand et al., 2020). The Muse EEG serves its purpose too in measuring the overall brain attentive monitoring activities of the participants (Wilkinson et al., 2020). The consistency of data can be achieved by the abovementioned synchronization method. As discussed, this is done by utilizing a single timeline for data collection, and a point-in-time synchronization method. This allows a higher degree of consistency and synchronization of data collected from different apparatus. Readability of output data measures the degree of complexity of the output data. Output data with clear and common format such as, but not limited to, comma separated values (CSV) to facilitate data cleaning and analysis. This would allow for easier data validation across multiple computerized systems saving complex manual post processing by improving the readability of data results. Psychometric properties of instruments, consistency of experimental data, readability of results when combined, would minimize complexity of output data, allowing results to have increased clarity and easier to be validated (1).
(1)
ERV = P + C + R . ERV= Ease of results validation P = Psychometric properties of instruments C = Consistency of experimental data R = Readability of results Experimental Design and Discussion
Figure 4 – Left: Diagram of current human-in-the-loop setup. Right: Experimental setup with participant. (a) NARSIM, (b) Tobii Eye Tracker, (c) Muse Headband, (d) Control Computer, (e) Primary Screen, (f) Secondary Screen
Simulated radar events containing aircraft information (callsign, type, altitude, heading, groundspeed), which were displayed to the participants, acted as the experimental stimulus (Fig. 4). This forms the input to the next stage which requires a bandwidth of 6.64 Gbp/s transfer rate. Data input was then transferred by two HDMI cable outputs through the 1x2 OREI HDMI splitter capable of supporting up to a transfer rate of 18Gbps, and a video resolution of up to 4k at 60Hz in 24 bits RGB. The 2 outputs via the HDMI cables are connected to respectively: 1) a 1920 x 1920 px resolution primary display monitor that forms the interface to the participants; 2) and a passive video grabber (Epiphan AV.io 4K, capable of supporting capture up to 4K Ultra-High-Definition (UHD) that feeds into the control computer. For eye tracker calibration, it was performed on a screen display of 1:1 aspect ratio – where the radar simulations were run (at a refresh rate of 60Hz), the minimum bandwidth requirement was also 6.64 Gbp/s, hence the cables must satisfy these criteria. To ensure uncompromised data transfer quality, two middleware discussed earlier (the HDMI splitter and the Epiphan 4k video capture device) were used in this design setup, allowing streaming, and recording of stimuli to the control computer. This setup allowed the dual output of the input source without compromising the transfer quality. Where applicable, USB 3.0 were employed for integration with the computer. A secondary 1920 x 1920 px display monitor is also attached to the control computer to ensure matching screen resolution and aspect ratio with the primary display (see Fig. 4). Eye tracking metrics from participants during experiments are then collected by the Tobii eye tracker with a capture rate of 30 Hz and neural signals by the Muse EEG Headband with a sampling rate of 256 Hz. Four active electrodes are present in the Muse headband (at channels AF7, AF8, T9 and T10), with a ground electrode located at Fpz, and two reference electrodes located on the left and right of the ground. These electrodes correspond to the international 10 – 20 electrode system. The Muse headset is also equipped with an on-board digital signal processing module for noise filtering (Wilkinson et al., 2020). The eye tracking data from Tobii, together with Muse EEG data, and the stimuli passed through the video capture device is synchronized in the control computer in real-time via the iMotions software. The recorded data from iMotions is saved as a common plain text CSV format and can be easily downloadable. This satisfies the readability criteria set out earlier. Input data were also synchronized by the iMotions software to ensure consistency across the different apparatus. This setup has proven to be a successful HITL design for our CWP studies.
CONCLUSION
A successful setup has been established capable of aligning physiological data streams to within 100ms, such that relational studies and interaction effects can be investigated. The synchrony of data streams can also facilitate smoother post- experiment analytical processes, resulting in an overall, more efficient process and system for experiments. Key success factors include proper bandwidth integration according to the band-width requirement (60 Hz at 6.64 Gbp/s) that has enabled undisrupted operation, appropriate aspect ratio matching between display and eye tracker (offsetting eye tracker away from the display screen to capture required radar display area under non ideal conditions) and setting appropriate spatial and resolution
Human Interaction & Emerging Technologies (IHIET-AI 2022) Artificial Intelligence & Future Applications https://openaccess.cms-conferences.org/#/publications/book/978-1-7923-8989-4 accuracy for high quality video output (of up to 4K) based on stimuli size and distance (with up to 35 pixel buffer radius according for offset). This offset approach has enabled the effective management of eye tracking area to accommodate larger 1:1, 1920 x 1920-pixel display sizes such as those used in Air Traffic Control, capturing crucial eye parameters for training and decision studies. Lastly, an intermediary easily accessible format (CSV) serves as a useful medium for data compilation, mapping, and synchronization from the different neuropsychological and traffic simulation inputs. For timeline synchronization, the internal clock of the system (posix time), which is independent of all other events was utilized. The different equipment were mapped to this timeline for accuracy and consistency of output data. The maximum error for time delay of the eye-tracker (33ms) and the EEG (40ms) were also both within 100ms, which conforms to the defined real-time window. By considering the factors discussed in this paper, a successful HITL system was constructed to conduct ATCO CWP situational awareness, training, and decision studies in real-time.
ACKNOWLEDGMENTS
The research is supported by the Civil Aviation Authority of Singapore and Nanyang Technological University, Singapore under their collaboration in the Air Traffic Management Research Institute. Any opinions, findings and conclusions expressed in this material are those of the author(s) and do not reflect the views of the Civil Aviation Authority of Singapore. The authors would also like to thank all the participants for contributing their time for this experiment.
REFERENCES
Brand, J., Masterson, T. D., Emond, J. A., Lansigan, R., & Gilbert-Diamond, D.
(2020), Measuring attentional bias to food cues in young children using a visual search task: An eye-tracking study. Appetite, 148, 104610–104610. Fonseca, M., Costa, P., Lencastre, L. and Tavares, F. (2013), A statistical approach to quantitative data validation focused on the assessment of students’ perceptions about biotechnology. SpringerPlus, 2(1). Funke, G., Greenlee, E., Carter, M., Dukes, A., Brown, R., Menke, L. (2016),
Which Eye Tracker Is Right for Your Research? Performance Evaluation of Several Cost Variant Eye Trackers. Proceedings of the Human Factors and Ergonomics Society Annual Meeting 60, 1240-1244. Holmqvist, K., Nyström, M., Mulvey, F. (2012), Eye tracker data quality: what it is and how to measure it. In: Proceedings of the symposium on eye tracking research and applications, pp. 45-52. Ke, Q., Liu, J., Bennamoun, M., An, S., Sohel, F., & Boussaid, F. (2018), Computer
vision for Human-Machine Interaction. In M. Leo & G. M. Farinella (Eds.), Computer vision for assistive healthcare: A volume in Computer vision and pattern recognition (pp. 127 – 145). Academic Press.
Krigolson, O., Williams, C., Norton, A., Hassall, C. and Colino, F. (2017), Choosing MUSE: Validation of a Low-Cost, Portable EEG System for ERP Research. Frontiers in Neuroscience, 11. Matthew, N. and R. Stones. (2018), Beginning linux programming.: John Wiley &
Sons. Miller, R.B. (1968), Response time in man-computer conversational transactions.
Proceedings of the December 9-11, 1968, fall joint computer conference, part I - AFIPS '68 (Fall, part I). NLR. (2018), NLR Air Traffic Control Research Simulator (NARSIM) tower - NLR. Royal Netherlands Aerospace Centre, https://www.nlr.org/capabilities/nlr-air-traffic-control-research-simulator- narsim-tower/ Peng Zhang. (2010), CHAPTER 13 - Human–machine interfaces. In Advanced
Industrial Control Technology (pp. 527–555). Elsevier Inc. Pwolf. (2009), Systems Integration and Compatibility, https://aceproject.org/main/english/et/etd01e.htm. Sollenberger, RL & Willems, Bernardus & Rocco, PS & Koros, Anton & Truitt,
Todd. (2005), Human-in-the-Loop Simulation Evaluating the Collocation of the User Request Evaluation Tool, Traffic Management Advisor, and Controller Pilot Data Link Communications: Experiment I - Tool Combinations. VA: Federal Aviation Administration. Tomaszewski, J. (2021), Overview of the role of artificial intelligence in pathology: the computer as a pathology digital assistant. Artificial Intelligence and Deep Learning in Pathology. 237-262. Wee, H. J. (2019), An eye-hand movement Model for traffic complexity evaluation
and monitoring enhancement for air traffic controllers. Doctoral thesis, Nanyang Technological University, Singapore. Wee HJ, Lye SW, Pinheiro JP. (2019), An integrated highly synchronous, high resolution, real time eye tracking system for dynamic flight movement [Journal Article]. Advanced Engineering Informatics; 41(100919):1–12. Wilkinson, C., Burrell, J., Kuziek, J., Thirunavukkarasu, S., Buck, B. and
Mathewson, K. (2020), Predicting stroke severity with a 3-min recording from the Muse portable EEG system for rapid diagnosis of stroke. Scientific Reports, 10(1).
Read this individual research paper free through the original publisher, or explore the full digital proceedings book.
ISBN 978-1-7923-8989-4
Explore this ISBN in the AHFE Bookstore ↗Listed in the July 2026 bookstore catalogue; search by ISBN to confirm current availability · Digital book purchase optional