Fu Guo, Qing-Xing Qu, Xia-Ying Zhang, Wen-Ting Ye, Huan Wang, Xue-Shuang Wang (2022). Research of Website Interaction Design Based on UX. In: Advances in Ergonomics In Design, Usability & Special Populations: Part II. AHFE Open Access, vol. 19. https://doi.org/10.54941/ahfe1001254
This paper makes a research of the relationship between interaction design elements and Kansei image words along with user preference based on user experience, Kansei Engineering and Interaction Design. First, four representative group buying websites were selected by the multidimensional scaling analysis and clustering analysis, and the interaction design elements were extracted by the discussion of experts and the method of morphological analysis, then the emotional assessment scale was established. Second, the article aims to build a correlation model between the interaction design elements and Kansei image words along with user preference via encoding the interaction design elements though quantification theory I, using the neural network algorithm, and then optimizes the design parameters with genetic algorithm.
With the continuous development of the internet, online group buying gradually rises and then develops quickly at the low prices promotion mode via the internet platform. The reason why the online group buying can develop healthily and sustainably has two. One is the price, and the other one which is more important is that it can make the user have better experience while they are interacting with the websites. Now the research of user experience is getting deeper. From the perspective of emotional design, Norman D.A. (2007) pointed out that product design should meet three levels of emotional experience: instinct level, behavioral level and reflective level. In the terms of user requirements, emotion and interactive product, Hassenzahl M. et al. (2010) provided a model of user experience, and pointed out that the aesthetic quality of product can promote the user experience and the practical quality is the core to guarantee user experience. Luo S. et al. (2010) put forward a user experience design method based on scenario, and used an example of mobile phone interface design to verify it. In the terms of Kansei Engineering, Lin J. L. et al. (2008) got the modeling elements of mobile phone via the morphological analysis and finally used quantification theory I and multiple regression analysis to build the relation model between emotional words and modeling elements. Chen L. and Zhou H.H. (2010) analyzed the characteristics of user requirements in uncertain circumstances, and provided the emotional demands evolution model of product modeling design, and then used the heuristic strategy to guide user’s demands to be gradually clear. Kaljun J. And Dolšak B. (2012) used an example of pneumatic hammer handle design to show how to build an ergonomic design knowledge base system and use it to improve the ergonomic value of products. In the terms of websites interaction design, Waller V. (2009) combined interaction design and psychology theory, and set up an information system to facilitate people`s lives and work. With mobile phone as the research object, Zhang Y.P. (2010) did fuzzy evaluation to the mobile phone interaction design from the different aspects of experience and availability and analyzed the result. Finally she got the conclusion that the experience can be improved by technology, modeling elements and scenario story. With mobile phone browser as the research object, He X.Y. and Jiang W. et al. (2011) analyzed the interaction design method and principle about the mobile phone browser. Zhao Z. et al. (2012) considered that using behavior analysis method while doing product interaction design can effectively find and solve some problems existed in the interaction process between user and product.
So far, the research of websites mostly stays on the qualitative research about websites interface or websites interaction design, and it is lack of the quantitative research about interaction design. This paper will combine the use experience and Kansei Engineering with interaction design theory, quantificationally study the correlation between interaction design elements and user emotion, improve the websites interaction design, and finally provide support of theory and method for websites design.
EXTRACTING THE INTERACTION DESIGN ELEMENTS AND ESTABLISHING THE EMOTIONAL ASSESSMENT SCALE Selecting representative websites
There are three main types of group buying websites: the life service information group, the specific product group and integrated multiple group-buying information class group. Based on the levels of usage, life service information group was chosen in this study. Focused on the difference of interaction, we took 20 group buying websites as experiment sample which are similar in content. This may alleviate the effect of irrelevant factors. A total of 33 subjects participated in the evaluation experiment. Seventeen male and sixteen female were employed in the experiment with the average age of 25.6 yr. The subjects were asked to open each websites and completed the browsing, searching and landing task, then classified them with the same or similar interactive function in any group number; number of groups and the group quantity is determined by the subjects themselves. After organizing the data, we obtained the frequency that any two websites were divided in the same group and build the lower triangle similarity matrix which was transformed into distance matrix in multidimensional scale later. We got six dimensional space coordinates by scale analyzing in SPSS. Four representative websites were included in the clustering analysis.
Extracting the interaction design elements
Through the repeated comparison, analysis and research of the representative websites, we think that so far the main content of the websites interaction is browsing, searching, logging on and purchasing. For each interaction assignment, we discussed with website design professionals. We used the morphological analysis to analyze the design elements of websites interaction design and its level. Finally we extracted the interaction design elements and levels as shown in Table 1.
Selecting Kansei image words After investigating relevant literature and web searching, a total of 36 Kansei image words were collected through the high frequency emotional words which were extracted by Chinese simplified PAD emotional evaluation scale. A questionnaire was made with the 36 Kansei image words. Then 60 subjects were asked to pick up the appropriate words on the questionnaire that express the emotion when users interact with the websites. The age of the subjects ranged from 19 to 30 yr and they all had online shopping experience. A total of 50 questionnaires were taken back and 48 of them were verified. After merging semantically similar adjective groups, we reduced the total number of adjective groups from 36 to 15. In order to build up the appropriate scale that can express the emotion, another 5 group buying websites were selected to make a pre-survey. The questionnaire included 15 emotional bipolar adjectives and an overall evaluation word (score from 1 to 7). There were 60 questionnaires and 52 of them were taken back. After artificial selection and inspection, 40 of them were verified.
Table 1: Interactive design elements of group buying websites Task Design elements Level
Table available in the original PDF paper.
Navigation setting color Yellow Light green Unchanged
Navigation text color Green Unchanged Browsing Product text color Blue Green Unchanged
Product information Hints No hints Underlines Underlines No underlines
Product detail Suspension Normal link Secondary navigation Label Pull-down Normal
Secondary navigation Seeking setting Yellow Green Blue Unchanged
Seeking result New link Current page Searching Searching box Pull-down Blank
Searching result New link Current page Landing Input box Prompts No prompts
Verification code Chinese Character Blank for Pull-down box Pull-down No pull-down box purchase
Purchase information Phone Name and phone No needs
According to the correlation coefficient standard, we rejected some Kansei image words which had little relationship with the totality in SPSS. Then the item analysis and factor analysis were used to identify the similarity words. As a result, 4 Kansei image words were discarded. The reliability and validity inspection were conducted to the rest and the emotional word set of group buying websites was finally made up by 11 Kansei image words and 1 overall evaluation word. It is shown in Table 2.
Table 2: Kansei image descriptors
Table available in the original PDF paper.
Number Kansei image Words Number Kansei image Words V1 Inimical-Acceptant V7 Boring-Attracting
BP NEURAL NETWORK MODEL BETWEEN INTERACTIVE DESIGN ELEMENTS, KANSEI IMAGE WORDS AND USER PREFERENCE Data processing of Kansei image words and user preference and evaluation of design variable
When building the BP neural network model of interactive design elements and user preference, the variable level of interactive design elements were defined as independent variable and the average of the user preference and 11 Kansei image words were defined as dependent variable. For the raw output was the number between [-3, 3], we normalized all the data to make them ranged from 0 to 1. This study uses Eqs.(1). to normalize data. After dealing with the normalization, the data can train the neural network effectively.
xi
*=(xi-xmin)/(xmax-xmin) , where xi *: normalized data. (1) The design elements, which are the independent variable in neural network model, are discrete qualitative variable in this study. For the single neuron cannot represent all the information of discrete variable, we used switch nominal dimension encoding method. The level of the design variables was defined as the coding digits. There was only one coding digits can be valued as 1 and the rest were valued as 0. The design variable types were shown in the position of 1. For example, “1000100110011010010000101010110001010” indicates the first samples of binary code.
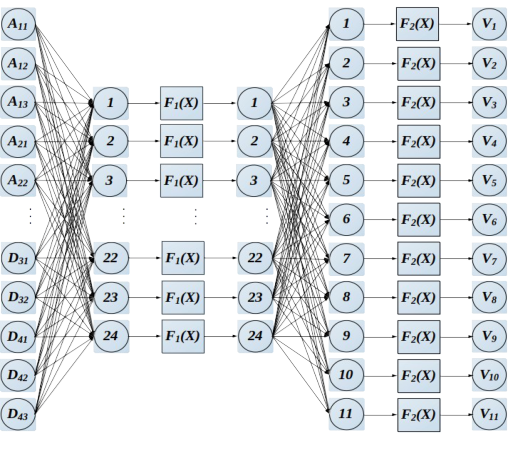
Building BP neural network model between interaction design elements and Kansei image words The level value of 37 interactive design elements were selected to predict the Kansei image words and 3 layers BP neural network structure was used: input layer, hidden layer and output layer. Lin Y. C. et al (2007) argued that root mean square error values were lowest when the number of neurons in hidden layer was half of the total number of input layer and output layer neurons. The input variability of BP neural network training sample was 37 different level values of interactive design elements. The average values of 11 Kansei image words were defined as output variability. There were total of 24 node number in hidden layer. Transfer function is an important part in neural network, which has to be differentiable. This paper selected S-shape tangent function tansig() as the transfer function in the middle layer and S-shape log function logsig() in output layer. All the output was located in the interval [0, 1] exactly which met the requirements of the neural network. Figure 1 illustrated the structure of neural network.
Figure 1. BP neural networks of interactive design elements and Kansei image words
The training function of BP neural network is set to be trainlm(). Using Levenberg Marquardt algorithm to for network learning, the training numbers is set to be 1000 times, and the goal of the error of training is set to be 10-6 . Editing code and running in MATLAB and repeatedly correcting weights after 24 times of training, the error reaches 4.79×10⁻⁷ which is less than the pre-set goal 10-6, and then the training stopped. After operating, we got two weight matrix, w1 is 24*37 matrix, w2 is 11*24 matrix, w1ij represents the weight of the j-th design level relative to the i-th hidden layer (including, 1≤i≤24 ,1≤j≤37), w2ij represents the weight of the j-th hidden layer relative to the i-th emotional words. For example, the weight of the color changes of green navigation words A 21 relative to the eighth hidden layer is w184=-0.2099, the weight of the seventh hidden layer relative to V7 “boring-attracting” is w277=1.2425.
In order to verify the validity of the BP neural network model, we randomly selected other 3 websites besides the representative websites to survey by questionnaire. When we conduct paired sample t test for model prediction and average of questionnaires with SPSS, and if the significance level is lower than 0.05, it indicates that there exists obvious difference between the predicted results and the average score of questionnaires. If not, it indicates that the predicted result is close to the questionnaires result, and then it verifies that the neural network has highly reliability. In this research, the result of t test, the p values were greater than 0.05, and that indicated that there exists no significant difference between the predicted values and the values of questionnaire survey.
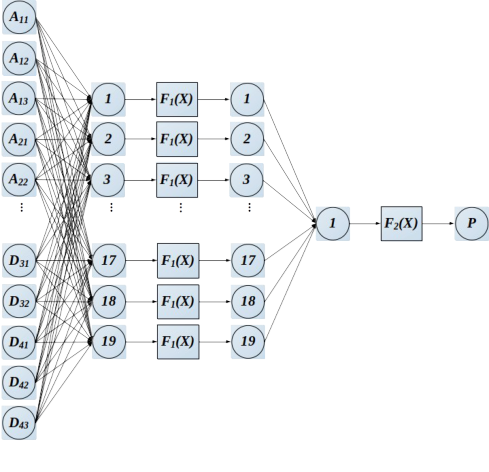
BP neural network model between interactive design elements and user preference We predicted the user preference through 37 average levels of interaction design elements, and same as the last research, we adopted three-tier BP neural network structure to make predictions. The input vector of BP neural network training sample is still 37 different values of levels of websites interaction design elements, the output vector is the average score of user preference and the node numbers of hidden layer is 19. The established neural network is shown in Figure 2.
Figure 2. BP neural networks of interactive design elements and user preference The parameters setting of BP neural network is same as the last parameter setting. Editing code and running in MATLAB and repeatedly correcting weights after 15 times of training, the error reaches 7.62×10⁻⁷ which is less than the pre-set goal 10-6, and then the training stopped. After operating, we got two weight matrix, w1 is 19*37 matrix, w2 is 1*19 matrix, w1ij represents the weight of the j-th design level relative to the i-th hidden layer (including, 1≤i≤24 ,1≤j≤37), w2ij represents the weight of the j-th hidden layer relative to the i-th emotional words. For example, the weight of the color changes of yellow navigation words A11 relative to the eighth hidden layer is w181=- 0.1474, the weight of the fifth hidden layer relative to the user preference “satisfied-unsatisfied” is w215=0.8748.
We still adopted the 3 websites used to model validation in last section to verify the BP neural network model in this section. The result of the t-test is p=0.363 and it indicates that there exists no significant difference between the predicted values of the model and the values of questionnaire survey.
THE WEBSITE INTERACTION DESIGN OPTIMIZATION BASED ON THE USER'S OVERALL EMOTIONAL PREFERENCE The construction of website design parameters optimization model
The final result of the website interaction design optimization model is a set of design elements values, and that needs to introduce the website interaction design elements, so we defined a collection of 15-dimensional design elements as shown in Eqs.(2).
X=(A1,A2,A3,A4,A5,A6,B1,B2,B3,C1,C2,D1,D2,D3,D4) (2) If the specific level of the 15-dimensional design elements is confirmed, then we can design a kind of website interaction design type. And if the design elements level is confirmed that can make an objective function get the maximum value, then we can design the optimal website interaction design relative to the objective function.
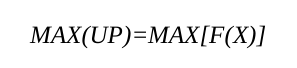
Using the user preference as objective function, it is shown as UP. According to the neural network model of design variables and user preference, UP depends on X, and the objective function that can represent the relationship of them is UP=F(X). The constraint conditions in the model mainly include the following aspects: 1) the data value ranges of the independent design variables itself; 2) the constraint conditions produced by the specific design requirements; 3) the constraint conditions produced by avoiding conflict when the qualitative variables are selecting values. The optimization model is constructed as Eqs.(3).
Equation reproduced from the original PDF.
Optimization of genetic algorithm integrated neural network integration algorithm According to the objective function UP=F(X), the fitness function will be set. The maximum fitness function value in the group will be gotten after repeatedly iterating over genetic algorithm and the corresponding objective function will be the maximum value and then we can get the optimal solution or the approximate optimal solution of the problem. As the fitness function calculation of the genetic algorithm is to get the minimum value, we need to transform the objective function to be min [-F(X)].
Through the function options = gaoptimset(), we can set its own structure of the genetic algorithm, and change the operation parameter in the function which need to be changed, and the parameter which not need to be changed will be operating in the default system. The initial population generated automatically by the function will produce a lot of randomness and that is not good for the genetic algorithm operation such as crossover and mutation. If it is given a better initial population, the efficiency will be improved, so we select representative sample in this research to build an initial population consist of 4 chromosomes.
The fitness function is obtained by neural network simulation, and it will judge the new population whether it meet the standard via the operation such as selection, crossover and mutation and so on. If it doesn`t meet the standard, the fitness value will be simulated and recalculated, otherwise the evolution will be terminated. Encoding on the MATLAB, we finally got the optimal decision variables after 51 iterative operations, X= (0011001010101010001000101101001001010).
CONCLUSIONS
This research mainly studies the problem of group buying websites interaction design optimization from the perspective of user experience and Kansei Engineering. The optimal group of elements level is as follow: when we are browsing, the navigation background color is invariant, the color of the navigation word is green, the color of commodity exhibition word is green, there is commodity information hint, there is underline, the commodity details interaction is suspension; when we are looking up, the secondary navigation interaction is tabbed, the color of the secondary navigation background is green, the search results show is in the present webpage; when we are searching, the search box is blank, the search results show is link jump, when logging on there is input box hint; when we are logging on and purchasing, the identifying code language is characters, there is no drop-down box, the input information is mobile number. The analysis of the group of the optimal elements level is as follow: when browsing, it will be good for user`s memory of information and have prompt function when the color of the navigation word and the commodity exhibition show is green; it will make the text full of energy and attract user`s attention when there is underline and hint of commodity information; when the commodity details interaction is suspension, it can let users conveniently get commodity details without click; when the tabbed secondary navigation changes with the green background and shows the results of looking up in the presents webpage, it will make user understand the information they choose; as the information users search for is clear, it will be more concise to present the search result in the way of blank search box and link jump; when logging on, the design of there being input box hint without drop-down box and character being as the identifying code language will make user more quickly log on the website; when purchasing, if the input information is mobile number, that can not only guarantee no buy mistake but also enable the input quick.
As the limitation of the space, this paper doesn`t optimize a certain user`s Kansei image words. In order to improve a certain feeling feature of webpage when doing an actual designing, the optimization model solution in this paper can be referred to.
ACKNOWLEDGEMENTS
This work is supported by the National Natural Science Foundation of China (Grant No.71171041). We thank all the participants for carrying out the experiments. Further, we thank the editor and anonymous reviewers for their valuable comments and advice.
REFERENCES
Chen L., Zhou H.H.,2010. Evolution Model and Its Application of Perceptual Needs in Product Form Design. Chinese Manufacturing Informatization, 39(19), 22-26. Hassenzahl M., Diefenbach S., Göritz A., 2010. Needs, affect, and interactive products–Facets of user experience. Interacting
with computers, 22(5), 353-362. He X.Y., Jiang W., 2011. Interactional Design Characteristics of Mobile Browser. ART AND DESIGN, (5), 236-238. Kaljun J., Dolšak B., 2012. Ergonomic design knowledge built in the intelligent decision support system. International Journal of Industrial Ergonomics, 42(1), 162-171. Lin J. L., Yin L., Li B. B., 2008. Study of the Influence of Handset Modeling Characteristics on Image Cognition. Packaging
Engineering, 29(6), 174-176. Lin Y. C., Lai H. H., Yeh C. H., 2007. Consumer-oriented product form design based on fuzzy logic: A case study of mobile phones. International Journal of Industrial Ergonomics, 37(6), 531-543. Luo S., Zhu S., Ying F., 2010. Scenario-based user experience design in mobile phone interface. Comput Integr Manuf Syst,
16(2), 239-248. Norman D.A., 2007. Emotional design: Why we love (or hate) everyday things. Basic books, New York. Waller V., 2009. Information systems ‘in the wild’: supporting activity in the world. Behaviour & Information Technology, 28(6), 577-588. Zhang Y.P., 2010. Comprehensive Assessment and Design Analysis of Mobile User Objective. Packaging Engineering, 31(8),
15-18. Zhao Z., Wu C., Liu C., 2012. The Application Research for Behavioral Analysis of Interaction Design in Products Design.
Packaging Engineering, 33(6), 73-77.
LISTED IN THE AHFE DIGITAL BOOKSTORE CATALOGUE
Explore the complete digital volume
Advances in Ergonomics In Design, Usability & Special Populations: Part II
Read this individual research paper free through the original publisher, or explore the full digital proceedings book.
ISBN 978-1-4951-2107-4
Explore this ISBN in the AHFE Bookstore ↗Listed in the July 2026 bookstore catalogue; search by ISBN to confirm current availability · Digital book purchase optional