Manida Swangnetr, David Kaber, Ellen Vorberg, Heidi Fleischerand Kerstin Thurow (2018). Workload Assessment for Manual and Automated Processes in Life Sciences. In: Advances in Physical Ergonomics and Human Factors: Part I. AHFE Open Access, vol. 1. https://doi.org/10.54941/10015
In life science process development, optimized manual protocols are converted to semi-automated processes to address high throughput and accuracy demands and to promote technician safety. However, little research has been conducted on technician workload assessment as a basis for identifying and prioritizing automation targets. The objectives of this study were to: 1) assess technician workload in a manual protocol and identify automation “targets” (for load reduction); and 2) compare workload with prototype automation vs. purely manual performance. Three expert technicians performed a mercury analysis process for three replications. Perceived workload was collected for each task using the NASA-Task Load index (TLX). Results on the manual process indicated “pipetting” and “measuring/recording” tasks to pose significantly higher perceived workload. The pipetting task posed the highest mental demand and risk of repetitive strain injuries, and was identified as a priority automation target. An automated pipetting system was prototyped and integrated in the manual protocol. The technician’s role was changed to transporting materials and programming tasks. In general, findings indicate that perceived workload assessment can be used to effectively identify target tasks for automation in life science processes. Technicians perceived significantly lower workload when performing automated pipetting, as compared with manual performance. However, there may be other factors (e.g., task time, number of steps) that influence workload and such factors may represent other targets for automation.
Life science processes are at the core of the biotechnology, pharmaceutical and medical device industries. The processes primarily focus on discovery and optimization in the areas of biotechnology and chemistry. With respect to discovery, industrial and research laboratories seek to develop novel analytical methods for screening compounds. Once a method is defined, life science laboratory technicians are required to manually perform the protocol on reference samples in order to achieve an optimal technique for accuracy and repeatability of analysis. A relatively new development in this area is the use of automation (see Thurow and Stoll (2001) for a review). Manual protocols are converted to semi-automated processes in order to address high throughput and test accuracy demands and to Physical Ergonomics I (2018) promote technician safety.
In a previous analysis of technician cognitive workload in a common protocol as part of a life science process, we found different tasks to induce different levels of load with some approaching “overload” for experienced technicians (Swangnetr et al., 2012). Such task conditions can lead to mental fatigue and errors. Unfortunately, little research has been conducted in this domain involving technician workload assessment as a basis for identifying high-demand life science tasks and prioritizing tasks for automation. Automation of life science protocols may serve as a means for reducing technician workload and ultimately preventing errors in task performance. The objectives of the present study were to: 1) assess lab technician workload in an existing manual protocol and identify automation “targets” for workload reduction; and 2) compare workload posed by a prototype semi-automated process with a purely manual protocol in order to identify any benefit of automation.
As a basis for this investigation, we selected a life science process involving determination of mercury (Hg) content in aged wood materials. Starting around 1832, Hg was used for treatment and preservation of wood, such as railroad ties, telegraph poles and construction timber (Moll, 1913). Not until 1970 did European nations and other countries around the world discontinue the use of Hg due to its potential harmful effects on human health and safety even in small concentrations (Jitaru and Adams, 2004). Today, in Germany, many structures remain (buildings, etc.) that were constructed from mercury treated wood. Unmanaged disposal of this treated-wood can lead to mercury entering the environment. As a result, the German Waste Wood Regulation was established and limits mercury content in dried aged wood (resulting from demolition or reconstruction projects) to 0.4 mg/kg (Federal Ministry of Justice of Germany, 2002). The Center for Life Science Automation (CELISCA) at the University of Rostock (Germany) previously developed an analytic method to screen wood samples for Hg content using an inductively coupled plasma-mass spectrometry (ICP-MS) technique (see Fleischer and Thurow, 2013 for details of the process). This study investigated technician workload in this specific method as a basis for guiding application of automation to the manual procedure.
ANALYSIS OF MANUAL PROCESS Task Analysis on Manual Process
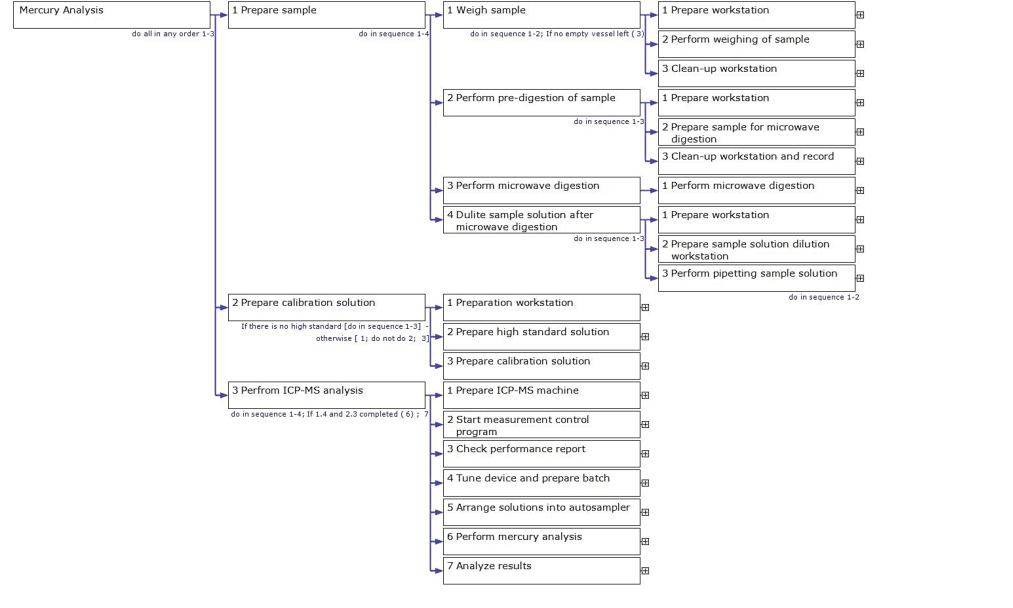
Initially, a hierarchical task analysis (HTA) was conducted to identify the goals, plans and tasks as part of manual performance of the mercury analysis process (see Figure 1). Each task included a sequence of operations as well as information requirements for technicians (not presented here). Resources used for the HTA included review of a standard operating procedure, retrospective think-aloud protocols with life science lab technicians (using video recordings), and interviews with process experts on the “what”, “how” and “why” of task and errors. On the basis of the HTA, tasks were categorized into basic task types including:
1. Prepare – preparation of workstation and machine setup 2. Measure/record – measurement and recording of weight of a sample 3. Pipette – pipetting standard solution, sample solution and calibration solution 4. Clean – clean-up workstation 5. Handling/loading – handling and loading solution into/out of machine 6. Program/test/verify – use of a program to control measurement, analysis parameters and performance of machine verification and analysis of results 7. Transport – transport between labs
Figure 1. Overview of task analysis for manual method of mercury analysis process
Study Procedure A field study was conducted to assess cognitive loads imposed by the manual analysis process on lab technicians. Three professional lab technicians were observed in the completion of mercury analysis process with three replications. Technicians were initially asked to complete pairwise rankings of six workload demand components as part of the NASA-Task Load index (TLX; Hart and Staveland, 1988; using a form translated into German). The technicians selected those TLX subscales that they considered to represent the most important contributors to workload in the mercury analysis process. The technicians were then informed how the process was broken-down into tasks. They were asked to inform analysts when they completed each task step. Analysts used a custom Android-based application with a smartphone (based on Zhang et al. (2013) system platform) to log tasks performed by technicians and to record technician ratings of TLX demands for each task. Demand ratings were recorded using a form separate from the TLX demand component rankings.
Hypothesis It was hypothesized (H1) that the type of task, as part of the mercury analysis process, would influence lab technician workload ratings. Certain TLX components were also expected to be sensitive to specific activities. Prior research has found overall TLX scores (rank-weighted sum of ratings across demand components) to be sensitive to different types of activities (e.g., Matthews and Campbell, 1998; Rubio et al., 2004). In general, an increase in task demands leads to increases in perceived workload (Haga et al., 2002; Young and Stanton, 2005). Focusing on the life sciences, our previous study (Swangnetr et al., 2012) also found different task types to influence different TLX demand ratings. Specifically, tasks posing high cognitive demands, including data analysis and pipetting, caused significantly higher mental demand ratings than physical activities (e.g., materials handling and loading and labeling). High demand tasks, identified through the analysis, were subsequently considered to be priority targets for automation and potential reduction of technician workload.
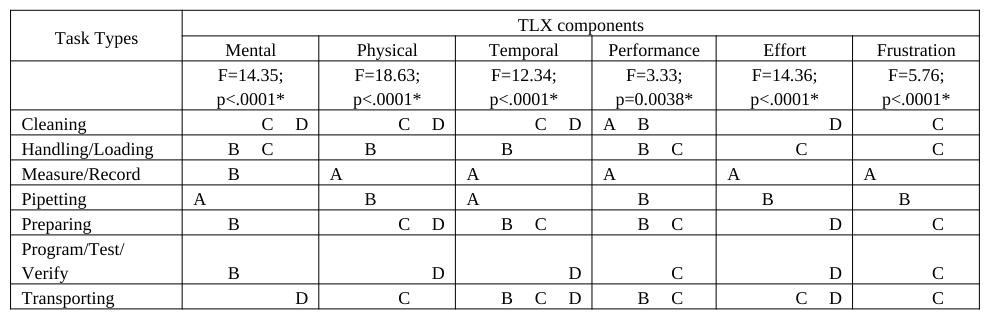
Effects of Task Type on Perceived Workload The NASA TLX ratings were normalized for each technician to account for individual differences in internal scaling of workload. Statistical diagnostics revealed normalized ratings to conform with assumptions of the Analysis of variance (ANOVA) procedure. Results of an ANOVA on the overall workload score revealed a significant effect of task type (F = 9.8875, p<0.0001). Post-hoc results indicated pipetting and measuring/recording tasks to cause significantly higher perceived load for technicians, as compared with other tasks (see Figure 2). Additional ANOVAs conducted on individual workload component ratings revealed a significant effect of task type on all TLX components (see Table 1). Pipetting tasks posed the highest mental and temporal demand; while measurement and recording tasks posed the highest physical and temporal demands, as well as levels of effort and frustration.
100
80
60
40
20
0
Overall Workload
Task Type
Figure 2. Post-hoc test results on overall workload ratings for task types (means with different letter labels are significantly different with p<0.05).
Figure available in the original PDF paper.
Table 1: ANOVA and post-hoc test results of effects of task types on TLX component ratings (* - indicates a significant differences with p<0.05; and means with different letter labels are significantly different with p<0.05)
Automation Target Identification In line with expectation (H1), the type of task influence technician workload ratings. Pipetting and measuring/recording tasks were found to pose the highest workload for technicians and were considered to be priority targets for automation or robotic assistance in order to reduce technician workload. When examining technician rankings of the various workload demand components, performance and mental demand were perceived as the first and second highest in terms of importance to overall workload in mercury analysis performance, respectively. It was found that pipetting tasks posed significantly higher mental demand, as compared to measurement and recording tasks. Pipetting activities have also been found to involve repetitive movement, awkward posture and forceful gripping in the use of plungers (David and Buckle, 1997; Anachem Ltd., 2010). From a physical ergonomics perspective, such activities can lead to risk of repetitive strain injuries for workers. Moreover, current automation and robot technology designed and developed for life sciences has the potential to be adapted to pipetting processes. Consequently, the pipetting task was selected as the automation target for this study.
ANALYSIS OF AUTOMATED PROCESS Task Analysis and Study Procedure for Automated Process
An automated pipetting setup was prototyped for the mercury analysis process and integrated in the manual protocol. The setup included a transport robot and a liquid handling machine. The task analysis was re-conducted and additional technician workload responses were collected. In general, the automation did not supplant but changed the role of technicians (Parasuraman and Riley, 1997) in the process. In specific, technician manual pipetting was changed to transporting samples to the automated workstation and programming, testing and verifying tasks. Due to limitations of the automated liquid handling system, manual performance of some pipetting tasks was still required. In addition, the technician preparation task was also changed to be more complex and included more steps. For example, technicians needed to prepare specific trays for different vessels and beakers to be used by the liquid handling machine. They were also required to arrange solutions at specific locations in the trays for automated pipetting. (These additional steps were not previously required in the manual protocol.)
For comparison of manual and automated processes, tasks as part of the automated process were grouped as follows:
1. Manual activity - a set of activities that was consistent across the two setups (manual vs. automated), including preparation, measurement/recording, pipetting, cleaning, handling/loading, programming/testing/verifying (for ICP-MS analysis), and transporting (between labs); and 2. Automated pipetting activity - the set of activities that resulted from automated pipetting, including programming/testing/verifying (by using pipetting system software)) and transporting (samples to/from the pipetting robot).
Hypotheses In regard to comparison of “manual activity” during manual and automated processes, it was expected that lab technician workload ratings would be consistent across systems for task types having similar sequences of operations and information requirements (Hypothesis (H)2.1). In contrast, for task types with different sequences of operations and information requirements, lab technician workload ratings were expected to be different between processes (H2.2). Specifically, workload ratings for preparation tasks were expected to be greater for the automated version of the process vs. manual, as the automated process required more steps in preparation.
Manual tasks during automated pipetting (i.e., transporting samples from/to the pipetting robot and programming the automated pipetting software) were expected to yield lower perceived workload ratings, as compared with manual pipetting (H3). Previous results on manual processes revealed workload demand required for transport and programming to be significantly lower than pipetting.
Analysis and Results on Comparison of Manual and Automated Process
T-test results revealed manual activity task types with a similar sequence of operations and information requirements to have consistent workload ratings across systems, except for the pipetting task (t = -5.645, p<.0001) and preparation tasks (t = -2.906, p=0.005). These tasks posed lower demands for technicians when performed during the automated vs. manual process (see Figure 3).
*
Task Type
Figure 3. T-test results on overall workload ratings for comparison of “manual activity” task types among manual and automated process configurations (* - indicates a significant difference with p<0.05).
Figure available in the original PDF paper.
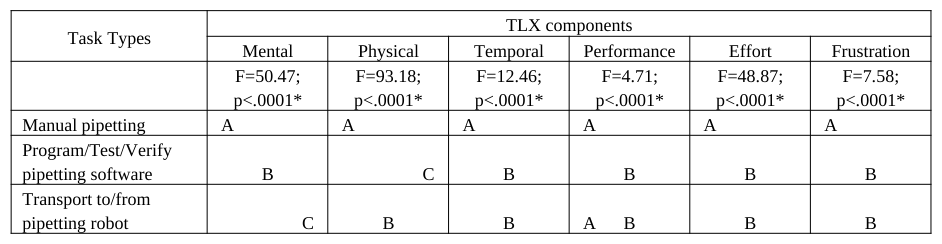
For comparison of manual pipetting with manual work during automated pipetting, ANOVA results revealed significant differences in terms of TLX ratings among task types (F = 43.9387, p<.0001). Technicians perceived significantly lower workload when performing automated pipetting activities, as compared with manual pipetting (see Figure 4). Results on individual workload component ratings also revealed technicians to perceive significantly less workload due to tasks performed during automated pipetting across all workload demands (see Table 2). The only exception was perceived performance for transport to/from the pipetting robot, which was comparable to manual pipetting.
Overall Workload
Transport 0 10 20 30 40 50 60 70 80 90 100
Pipette Program/ Test/Verify
Task Type
Figure 4. Post-hoc test results on overall workload ratings for task types in comparison of manual pipetting with manual work Physical Ergonomics I (2018)
Figure available in the original PDF paper.
during automated pipetting (means with different letter labels are significantly different with p<0.05).
Table 2: ANOVA and post-hoc test results of effects of task type on TLX component ratings for comparison of manual pipetting with manual work during automated pipetting (* - indicates a significant difference at p<0.05; and means with different letter labels are significantly different with p<0.05)
Discussion
In line with expectation (H3), results indicated technicians to perceive significantly lower workload when performing automated pipetting activities, as compared with manual pipetting. However, technicians perceived their performance in transport activities to be comparable to manual pipetting performance. The task analyses revealed that the transportation to and from the pipetting robot was more complex than transportation of materials between labs. Technicians were required to remember specific locations at which to place different solution trays in the automated pipetting system. In this case, the use of a mobile robot for the transportation activity might be helpful.
In partial support of H2.1, the workload imposed by manual activities appeared to be consistent across the two systems. We found that tasks with a similar sequence of operations and information requirements to produce consistent workload ratings under the manual or automated process configuration. However, the pipetting task posed lower workload demands for technicians when performed during the automated vs. manual process. This finding could be due to the number of pipetting tasks and a reduced time requirement for the automated process, as compared with the manual version of the process. The number of tasks and time-to-completion should also be further investigated for relative influence on workload experiences.
Contrary to H2.2, the preparation task was found to pose lower demands for technicians when performed during the automated process setup. Although preparation for the automated system was more complex and included more steps, it did not pose high workload demand for technicians. It was observed that technicians regularly referred to a preparation checklist to reduce mental workload in the new automated process. Using automation or a robot as cognitive reminder tool might be useful for preparation tasks. The cognitive reminder could also be helpful for newly developed processes as well as lab technician trainees who may be unfamiliar with processes.
CONCLUSIONS
In general, the findings of this study indicate that assessment of technician perceived workload can be used to successfully identify target tasks for automation applications in life science processes. Lab technicians perceived significantly lower workload when performing manual tasks during an automated process, as compared with manual process activities. However, there may be other factors (e.g., task completion time, number of task steps, use of checklists) that influence workload and these factors may be indicators of other targets for further automation.
Future research includes determining whether technician perceptions of workload are driven by task characteristics, including: duration, number of steps, number of perceptual and motor operations, and number of cognitive operations. We plan to use the Goals, Operators, Methods, and Selection rules (GOMS; Kieras, 2005) methodology to analyze task characteristic factors in perceived workload in life science processes. Moreover, prior research has demonstrated efficacy of physiological responses for cognitive workload assessment (see Scerbo et al. (2001) for a comprehensive review). Our future study will include integrating physiological measures with perceived workload to objectively identify high demand cognitive tasks as automation targets. Finally, we will plan to explore advanced robotic technology with the capacity to act as assistants to technicians towards further reducing cognitive load.
ACKNOWLEDGMENTS
This study was supported by the Federal Ministry of Education and Research (BMBF Germany; FKZ: 03Z1KN11) and CELISCA (University of Rostock, Germany) through a postdoctoral position for Manida Swangnetr. We thank the chemical process experts and lab technicians for critical information on the mercury analysis process. We also thank Weiping Zhang and Dr. Annika Rieger for configuration of the data collection devices used in the field study.
REFERENCES
Anachem Ltd. (2010). Pipetting injuries – Risk factors and how to prevent or reduce them. Retrieved from http://anachempipettestipsservice.blogspot.com/2010/08/pipetting-injuries-risk-factors-how-to.html David, G., & Buckle, P. (1997). A questionnaire survey of the ergonomie problems associated with pipettes and their usage with
specific reference to work-related upper limb disorders. Applied Ergonomics, 28(4), 257-262. Federal Ministry of Justice of Germany (2002). Ordinance on the management of waste wood. Retrieved from http://www.bmub.bund.de/fileadmin/bmu-import/files/pdfs/allgemein/application/pdf/wastewood_ordinance.pdf Fleischer, H., & Thurow, K. (2013). Determination of Total Mercury Content in Wood Materials, Part 2: ICP-MS-A
Multielement Method. American Laboratory, 45(8), 6-8. Haga, S., Shinoda, H., & Kokubun, M. (2002). Effects of task difficulty and time-on-task on mental workload. Japanese Psychological Research, 44 (3), 134-143. Hart, S. G., & Staveland, L. E. (1988). Development of NASA-TLX (Task Load Index): Results of empirical and theoretical
research. In: P. A. Hancock & N. Meshkati (eds.), Human Mental Workload. Amsterdam: North Holland Press. Jitaru, P., & Adams, F. (2004). Toxicity, sources and biogeochemical cycle of mercury. In Journal de Physique IV (Proceedings) (Vol. 121, pp. 185-193). EDP sciences. Kieras, D.E. (2005). A guide to GOMS model usability evaluation using GOMSL and GLEAN3 (On-line publication describing
GOMSL, the GLEAN tool, and how to perform a GOMS analysis). University of Michigan, Department of Electrical & Computer Engineering, Ann Arbor, MI. Matthews, G., & Campbell, S. E. (1998). Task-induced stress and individual differences in coping. Proceedings of Human Factors and Ergonomics Society Annual Meeting, 42, 821- 825. Moll, F. (1913). The artificial protection of wood with corrosive sublimate (kyanization). Angew. Chem., 26, 459–463. Parasuraman, R. & Riley, V. (1997). Humans and automation: Use, misuse, disuse and abuse. Human Factors, 39, 230–253.
Rubio, S., Diaz, E., Martin, J., & Puente, J. M. (2004). Evaluation of subjective mental workload: A comparison of SWAT, NASA-TLX, and Workload Profile, Applied Psychology: An International Review, 53(1), 61-86. Scerbo, M. W., Freeman, F. G., Mikulka, P. J., Parasuraman, R., DiNocero, F., & Prinzel, L. J. (2001). The efficacy of psychophysiological measures for implementing adaptive technology (Tech. Rep. No. 4 NASA/TP-2001-211018). Washington, DC: NASA. Swangnetr, M., Zhu, B., Kaber, D. B., Thurow, K., Stoll, N., & Stoll, R. (2012). Cognitive workload analysis and development of
a stress index for life science processes. In Proc. of the 2012 Applied Human Factors & Ergonomics Conference. Boca Raton, FL: Taylor & Francis CRC Press. Thurow, K. & Stoll, N. (2001). Aktuelle Tendenzen in der Laborautomation. In Praxishandbuch Laborleiter (Chap. 11.3, pp. 1– 22). Kissing, Germany: WEKA Media. Young, M. S., & Stanton, N. A. (2005). Mental workload. In Handbook of Human Factors and Ergonomics Methods, eds. N.
LISTED IN THE AHFE DIGITAL BOOKSTORE CATALOGUE
Explore the complete digital volume
Advances in Physical Ergonomics and Human Factors: Part I
Read this individual research paper free through the original publisher, or explore the full digital proceedings book.
ISBN 978-1-4951-2104-3
Explore this ISBN in the AHFE Bookstore ↗Listed in the July 2026 bookstore catalogue; search by ISBN to confirm current availability · Digital book purchase optional