Yunmei Liu, Kihyun Pyo, Christopher Cunningham, Thomas Chase, David Kaber (2022). Driver Situation Awareness and Cognitive Workload Effects of Novel Interchange Configurations and Associated Signage. In: Human Factors in Transportation. AHFE Open Access, vol. 60, pp. 287–296. https://doi.org/10.54941/ahfe1002459
In recent years, there has been a push towards use of grade-separated interchange (GSI) design to increase the overall capacity of intersections. The primary recommendation has been to resolve physical intersection constraints, including signalized left turns (in the U.S.). However, few, if any, investigations have made comparisons of driver situation awareness (SA) and cognitive workload in navigating novel grade-separated configurations and how to effectively implement associated signage to promote driver and traffic safety at different types of interchanges. To address this research gap, this study designed and conducted a driving simulation experiment to compare driver SA and cognitive workload in negotiating standard GSIs vs. novel GSI conditions, including contra-flow and quadrant configurations. All GSIs accommodated cross-traffic flows (north, south, east, and west) with four-lane roadways running in each direction through urban environments. The experiment also manipulated driver exposure to lane assignment (LA) signs (present and absent) and decision point (DP) signs with either overhead or right-side mount configurations. Forty-eight (48) licensed drivers participated in the experiment with each driver experiencing each GSI configuration in two trials for a total of six experiment trials for each participant (total of 288 trials). Participants in the experiment were divided into two groups according to age, including young (18-24 yrs.) and middle-aged (25-64 yrs.). The participants were also assigned to unique combinations of LA and DP signs (LA present + DP overhead; LA present + DP right-side mounted; LA absent + DP overhead; LA absent + DP right-side mounted), which remained consistent across GSI configurations for each driver. A high-fidelity and full-motion driving simulator was used in this study. During each trial, a driver was required to maintain posted speed limits and to achieve a pre-identified destination (“Garden St. North), as posted on the LA and DP signs. At specific stopping points in each test trial, driver SA was assessed using the Situation Awareness Global Assessment Technique (SAGAT). The simulation scenario was frozen and drivers were posed with multiple queries addressing perception, comprehension, and projection of roadway conditions, vehicle and traffic states, and routes. Qualtrics survey software was used to present questions in an electronic format (using driver mobile devices) with all being randomly selected from a large pool of questions on the driving environment. Driver responses to queries were graded based on recordings of ground-truth simulator settings. That SAGAT output as a percentage of correct responses to all queries delivered at a simulation freeze with range [0,1]. Driver cognitive workload was assessed using the NASA Task Load index. The purpose of using this index was to determine the cognitive load imposed on drivers by the signage conditions in negotiating the various types of GSIs. At the beginning of the experiment, participants ranked the importance of six workload demand components, including mental, physical, temporal, performance, effort, and frustration for the driving task. At the end of each test trial, participants rated their perceived mental workload, according to the various demand components on a 100-point scale. The NASA TLX was calculated as the rank-weighted sum of the demand ratings scaled from 0 to 100 points. The results revealed driver SA and workload to significantly differ among GSIs. The standard and contra-flow GSIs were not different in driver SA but both were superior to the quadrant configuration. There were no significant differences in SA detected for the use (LA) and placement (DP) of signs. Regarding cognitive workload, results corresponded with SA findings, indicating the standard and contra-flow GSIs produced lower cognitive demands for drivers than the quadrant configuration. However, there were no significant differences in cognitive workload detected between the use and placement of signs. No interactions were detected among the GSI configurations and use and placement of signs for both SA and cognitive workload. In addition, correlation analyses were also applied to the SA and workload responses. Results indicated that SA and workload were complimentary in the context of the present experiment and they represent unique methods for assessing human behavior/performance in driving research.On the basis of these results, it was concluded that novel GSI designs influence driver SA and workload responses compared with standard interchanges; however, the presence of LA signs and positioning of DP signs does not appear to positively influence these responses. There is a need for additional empirical driving research to determine what aspects of GSI geometry and other traffic control devices may serve to promote comparable levels of driver SA and workload for new designs as compared to standard interchanges.
Rapid growth in transportation demands and traffic have resulted in serious roadway congestion issues, especially at urban intersections. Compounding this situation, there are locations where increasing infrastructure capacity is not feasible or cost-effective. In addition, enlarging intersections can create complexity for signal operations and pedestrians, and significantly increase travel time variability and crash rates (Eyler, 2005). Considering limitations on enlarging intersections and needs to reduce congestion and limit roadway user conflicts, some researchers have proposed redesigning the configurations of existing intersections.
Alternative intersection and interchange (AII) designs re-route some traffic movements to non-traditional patterns to reduce major conflict points. As a subset of AIIs, grade-separated interchanges (GSIs) eliminate intersecting movements through grade separation. In a GSI configuration, traffic occurs at multiple levels but roadways remain signalized. Unfortunately, some previ- ous studies have shown certain forms of GSIs to be susceptible to wrong-way driving (WWD). For example, based on 6 years of crash data, Zhou et al. (2012b) identified compressed diamond and diamond interchanges as the top-two interchanges for WWD crashes. Having noted this, there is a pau- city of guidance in the literature on how to appropriately sign at GSIs to achieve effective driver awareness and performance (towards reducing WWD incidents).
Among the studies on GSIs, few investigations have focused on how to implement signage safely for different intersection configurations. Inman et al. (2006) found that for roundabout configurations, as the number of items on signs increased, the accuracy of driver lane selection decreased signi- ficantly. Qiao et al. (2007) attempted to identify optimal advance placement of roadway signs based on the actual physical position of signs and driver behaviors. Experiment results revealed viewing distance to be crucial in sign placement. Still other studies (Zhang et al., 2013; Kaber et al., 2015; Zahabi et al., 2017) have compared specific sign information content and effects on driver distraction and performance under different driving conditions. Howe- ver, none of these studies investigated positioning and content manipulations for critical routing signs, including lane assignment and decision point, at on- ramps of interchanges. In summary, there is an outstanding need to examine how traffic signs should be displayed at different GSIs in order to effectively guide drivers without introducing distractions and WWD events.
To address this research gap on the design and placement of GSI signage, this study specifically examined the influence of lane assignment and deci- sion point sign use and placement on driver situation awareness (SA) and cognitive workload at GSIs. Based on prior research on the use of guide signs at conventional interchanges, it was expected that lane assignment signs at an interchange would increase driver SA and decrease cognitive workload (Hypothesis 1). Considering driver visual attention patterns, it was also expe- cted that overhead mounted decision point signs would increase driver SA and decrease driver cognitive workload at interchanges, as compared with less visually accessible side-mounted signs (Hypothesis 2). Novel GSI designs, including contraflow and quadrant, were expected to lead to degraded SA and increased driver cognitive workload (due to potential driver confusion), as compared to standard intersection design (Hypothesis 3). This expectation was based on the complexity of traffic flows and required gaze patterns in driver negotiation of contraflow and quadrant interchanges.
METHOD
Participants and Apparatus A total of 48 participants with 20/20 vision (natural or corrected) and a valid driver’s license participated in the driving simulator experiment. All
Driver Situation Awareness and Cognitive Workload Effects of Novel Interchange 289
Table 1. Sign options configuration.
Table available in the original PDF paper.
Types of sign options Lane assignment sign status Decision point sign position Sign Option 1 Present Side Sign Option 2 Present Overhead Sign Option 3 Absent Side Sign Option 4 Absent Overhead
participants were compensated at a rate of $20 per hour. They were divided into two groups, according to their ages, with a convenience sample of young (18-24 years) and middle-aged drivers (25-64 years). A high-fidelity and full- motion (Moog platform) driving simulator was used in this study. During test trials, drivers sat in a 1/4-cab and used a full-size steering wheel, accelerator and brake pedals, and dashboard controls. Drivers controlled the simulated vehicle to maintain and change lanes and accelerate or decelerate.
Experiment Design This study followed a 2×2×3×2 mixed within-subject and between-subjects experiment design, with two lane assignment sign settings (present and absent), two types of decision-point sign positions (side-mounted and overh- ead), three types of interchange design (standard, contraflow, and quadrant), and two driver age groups (young and middle-aged). Each participant was assigned to one unique sign combination with exposure occurring across the three types of interchanges with replication. Crossing the two-lane assign- ment sign settings and the two decision point sign positions yielded four signage options (see Table 1). The participant was then repeatedly exposed to this particular combination across the various interchanges. Exposure to the interchange designs was replicated in order to assess within-subject performa- nce variability. Two 3x3 latin squares were applied for randomly scheduling trials for half of the participants in each age by signage combination group, which was intended to limit occurrence of carryover effects among trials.
Experiment Procedures Prior to participating in the driving simulator experiment, participants com- pleted an informed consent form, as required by the Institutional Review Board (IRB) of NCSU, and a Pre-exposure Simulator Sickness Questionnaire (PSSQ). This questionnaire provided the research team with information on participant physical and mental health before the experiment, which served as a benchmark for sickness assessments during experiment trials. Subsequently, each participant completed simulator driving training. The training included right turns, straightaways & curves, left turns. After the driving training, par- ticipants completed a workload demand component ranking form, including mental, physical, temporal, performance, effort, and frustration as part of the NASA-Task Load index (NASA-TLX) methodology.
For experiment test trials, participants drove on a short segment of high- way and were asked to stop at a specific location with a stop sign or signalized intersection. At these stopping points, the driving simulation was frozen all
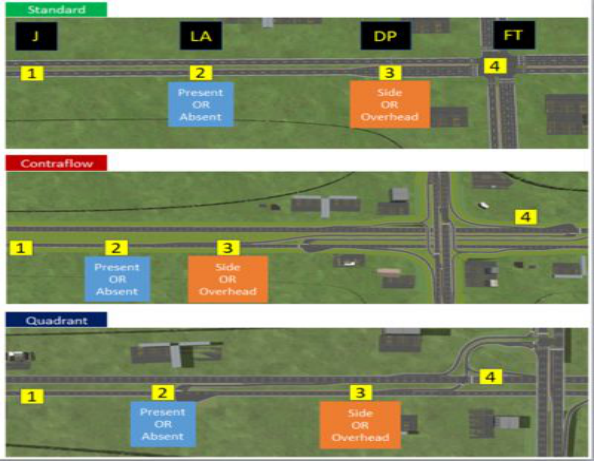
Figure 1: Three types of interchange scenarios.
displays were shut down. Participants were presented with a tablet computer (in cab) to respond to SA queries. At the same time, experimenters recorded the ground-truth of the simulation at a control station. (This information was used for SA response analysis purposes.) Once the SA surveys were complete, the simulator displays were reactivated and the driving simulation resumed until completion of the scenario (i.e., driver route selection (left turn) based on signage). At the end of each trial, participants were once again provided with a tablet computer to complete NASA-TLX demand ratings on a 100-point scale.
There was a 10-minute break after every two test trials. During each break, participants completed the SSQ to ensure that they did not suffer any sym- ptoms during the experiment. For each participant, the entire experiment took approximately 1.5 hours.
Driving Task The driving simulator presented an urban environment and a medium-sized car (sedan). All intersections accommodated cross-traffic flows (north, south, east and west) with four-lane roadways running in each direction. Partici- pants were given a destination of “Garden St, North” for all trials. For each scenario, there were four possible locations (Positions 1-4) at which signage could occur. Position 1 presented Junction Information and Position 4 pre- sented Final Turn Information without change across all trials. However, Position 2 was used to present the lane assignment sign (if present) and Posi- tion 3 presented the decision point sign (overhead or right-side mounted). The exact signage locations were determined based on the geometry of each interchange configuration (see Figure 1).
Driver Situation Awareness and Cognitive Workload Effects of Novel Interchange 291
During each test trial, drivers maintained their vehicle speed at a limit of 45 mph. They were also directed to exhibit normal driving behavior, such as lane selection, until seeing further destination guidance information. Drivers were permitted to make lane changes based on ambient traffic and to decelerate to enter a left-turn lane at an interchange. Following a full stop, drivers waited for traffic and/or a signal to turn left.
Response Measures As a basis for analyzing driver behavior in negotiating the various interch- ange configurations, we collected data on several different response measures during the experiment. The measures included driver SA assessments and cognitive workload surveys.
Situation Awareness. Sometime ago, Endsley (1995) defined SA as the perception of elements within a volume of time and space (Level 1), compreh- ension of their meaning (Level 2), and projection of their status in near future (Level 3). The Situation Awareness Global Assessment Technique (SAGAT; Endsley, 1995) is considered to be an objective method of measuring SA, as it involves queries of operator dynamic knowledge in real-time. SAGAT is also considered to be a global measure of SA as queries are targeted at all three levels, as identified by Endsley. We used the Qualtrics survey softw- are to present SA queries to drivers in an electronic format with all queries being randomly selected from a large pool regarding the simulated driving environment. All queries were based on the driver’s goals and decisions. For example, we asked the driver how many green guide signs they saw before stopping (Level 1); what was his or her average speed before slow- ing down for the first turning motion (Level 2); and what action will (s)he take next to get to the destination (Level 3). Driver responses to the SAGAT queries were graded based on recordings of ground-truth simulator settings to determine the score for query. There were 1728 queries administered with 1114 correct responses and 614 incorrect responses. There were no missing values. Percentage of correct responses was calculated for each trial. Among all participants, the average SA score was 0.65 and the standard deviation was 0.22.
Cognitive Workload. According to previous human factors studies (Endsley & Kaber, 1999; Kaber & Endsley, 2004; Zahabi et al., 2019), the NASA-TLX (Hart & Staveland, 1988) is a commonly used measure of cognitive workload and has demonstrated reliability. We used this index to determine the cognitive load imposed on drivers by the signage conditi- ons in negotiating the various types of interchanges. The NASA TLX was calculated as the rank-weighted sum of the demand ratings scaled from 0 to 100 points. There were 48 sets of demand rankings from partici- pants and 288 sets of demand ratings, across trials. During the experi- ment, one subject’s demand rankings, and demand ratings at the close of four test trials, were missed. These values were replaced with the mean values for all other subjects assigned to and tested under the same signage conditions.
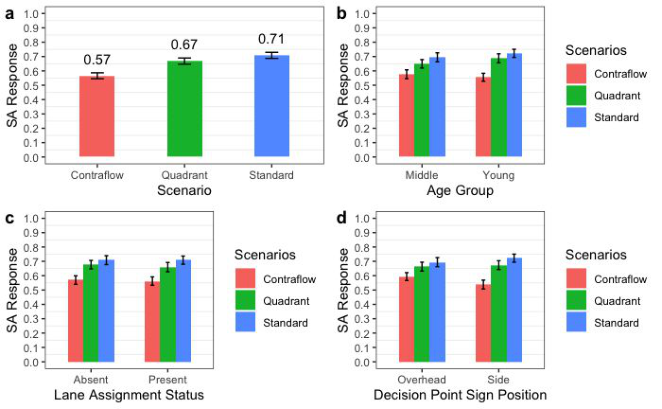
Figure 2: (a) Mean of SA response for different scenarios; (b) mean SA response by scenario types and age group; (c) mean SA response by scenario type and lane assi- gnment sign use; (d) mean SA response by scenario type and decision point sign position.
RESULTS
Figure 2 (a)(b)(c)(d) show the mean SA responses under the different scena- rios, age groups, and the use and placement of signs, accordingly. Among the responses, differences among the different scenarios are more obvious (Stan- dard: 0.71; Quadrant: 0.67; Contraflow: 0.57). To make inferences on the SA scores for the test conditions, we applied a mixed-effects statistical model to the data set. However, due to the limited number of SA queries per trial, the resulting response was discrete. Consequently, the data revealed a norma- lity violation (Q-Q plot with banding; Shapiro⣓Wilk⣙s test: p<0.01). Therefore, instead of using a parametric multi-way ANOVA (analysis of vari- ance), we turned to non-parametric methods (Kruskal-Wallis rank sum test, Wilcoxon rank sum test) to analyze the SA dataset.
The Kruskal-Wallis rank sum test revealed significant differences in driver SA under different interchange scenarios (χ2 = 22.12, p = 0.000607). To identify the specific scenarios that led to this difference, we performed follow-up pairwise condition comparisons using the Wilcoxon rank sum test. Results revealed no significant difference in driver SA between the Standard and Quadrant scenarios (W = 5117.5, p = 0.174); however, driver SA in Contraflow scenario was significantly lower than that for the Stan- dard interchange (W = 6312.5, p = 5.61 × 10⁻⁶) and Quadrant (W = 5830.5, p = 0.001103). However, there were no significant dif- ferences in SA detected among age groups (χ2 = 2.9886, p = 0.8103) and the use (LA) (χ2 = 3.2096, p = 0.7821) and placement (DP) (χ2 = 2.3136, p = 0.8887) of signs. Given the non-parametric analy- sis approach, it was not possible to analyze any interactions between the interchange design settings and use and placement of signs for SA responses.
Driver Situation Awareness and Cognitive Workload Effects of Novel Interchange 293
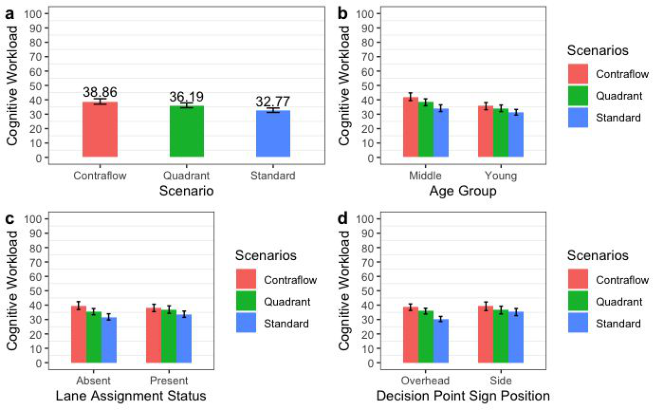
Figure 3: (a) Mean cognitive workload for different scenarios; (b) Mean cognitive wor- kload by scenario type and age group; (c) Mean cognitive workload by scenario type and lane assignment sign use; (d) mean cognitive workload by scenario type and decision point sign position.
Figure 3 (a)(b)(c)(d) presents the mean cognitive workload scores for the different scenarios, age groups, and use and placement of signs, accordin- gly. Consistent with the SA responses, the cognitive workload of drivers differed among scenarios (Standard: 32.77; Quadrant: 36.19; Contraflow: 38.86). Furthermore, by analyzing the different demand components of cognitive workload, we observed driver perceptions to be largely influenced by their own performance, but less by physical demands and frustration. Given that the NASA TLX is a continuous response, and all experiment independent variables were categorical, we applied a multi-way ANOVA to the workload dataset. The diagnosis of the NASA TLX scores indicated no normality violation of random effects attributable to subjects (Shapiro–Wilk test: p = 0.2358). In addition, due to the large and balanced experimen- tal data (288 data points), the central limit theorem applies; thereby, any fixed effects caused by scenarios, age groups, and the use and placement of signs were also approximately normally distributed. (According to Larson (2008), an ANOVA applied to normal data with heterogeneous variance is robust for balanced or near-balanced designs. Therefore, the ANOVA test was considered reasonable for the workload analysis.)
The workload results were consistent with the SA outcomes, inclu- ding significant differences in cognitive load under different scenarios (F(2,236) = 10.7323, p = 3.459 × 10⁻⁵). Post-hoc analysis using Tukey’s HSD tests revealed the cognitive workload at Standard interse- ctions to be significantly lower than for the Quadrant (p = 0.0269) and Contraflow (p < 0.0001) configurations. The cognitive workload of drivers did, however, not differ significantly between the Contra- flow and Quadrant (p = 0.1088). In addition, there were no
significant differences in cognitive workload detected among age groups (F(1,41) = 1.1126, p = 0.2977) and use (F(1,41) = 0.0175, p = 0.8955) and placement (F(1,41) = 0.2316, p = 0.6329) of signs. Having noted this, when we applied the ANOVA to different demand components, we observed an almost identical pattern of results, as with the total cognitive workload, except for the performance component. Consequently, any dif- ferences in driver cognitive workload are likely the result of the combined effect of various demands. Finally, no interactions were detected among the interchange designs and use and placement of signs for cognitive workload.
In addition to the multi-way ANOVA, we also performed a correlation analysis on the SA scores and NASA-TLX scores. Considering that the SA scores were discrete, we applied Kendall’s tau and Spearman’s rank corre- lation coefficients to assess any statistical associations based on ranks of the responses. Results revealed no significant correlations between SA and cogni- tive load (Kendall’s tau & Spearman coefficient of r=-0.055). We also further analyzed whether the SA score was related to NASA-TLX demand com- ponents. However, no non-parametric correlation coefficients were greater than 0.1 or less than -0.1. Therefore, these findings indicate that the SA and workload measures are complementary in terms of analysis of human per- formance and both maybe necessary to elucidate different effects of highway designs on driver behavior and responses.
DISCUSSION AND CONCLUSIONS The objectives of this study were to test the influence of novel GSI designs, and use and placement of signs, on driver SA and cognitive workload through a simulation experiment. Results partially supported Hypothesis 3. The con- traflow design led to significantly degraded driver SA, likely due to lack of driver familiarity with the configuration, as compared to the standard and quadrant interchanges. However, the quadrant design did not differ from the standard intersection in terms of SA.
Results on cognitive workload revealed significant increases for drivers at both the contraflow and quadrant interchanges, as compared to the standard intersection. However, there was no difference between the contraflow and quadrant designs in terms of cognitive workload. Once again, these findings are likely due to the novelty of the GSI interchanges, lack of driver familiarity, and perceived complexity of navigation of the interchanges.
Based on these observations, signing engineers need to develop novel sign configurations for driver use of contraflow interchanges to offset low SA and high cognitive workload. The quadrant design appears to be a feasi- ble alternative to standard intersections with or without lane assignment signs and when using side-mounted decision point signs. However, novel signs appear to be needed to reduce driver cognitive workload at quadrant interchanges. Consequently, the results of this analysis provide guidance for highway systems engineers on the need for novel signage design to ensure effective driver information processing under unique highway configurations with performance comparable to standard intersections.
Driver Situation Awareness and Cognitive Workload Effects of Novel Interchange 295
Hypotheses 1 and 2 on the use and placement of signs at the simulated GSIs were not supported. To be more specific, use of lane assignment signs at interchanges did not appear to significantly increase driver SA nor decrease driver cognitive workload. Furthermore, overhead mounted decision-point signs did not significantly increase driver SA or decrease cognitive workload at interchanges, as compared to side-mounted signs. Possible explanations for these results include the following: (1) the information included in lane assi- gnment signs may not have been as useful as expected for promoting driver SA and decreasing cognitive workload at specific points in the driving sce- narios; and (2) overhead decision-point signs may not have been as visually accessible as expected, relative to side-mounted signs.
Furthermore, there were no significant differences in driver SA responses and cognitive workload between the two driver age groups (younger: 18 to 24 years; middle-aged: 25 to 64 years). This result was likely due to a limited age gap between our study groups. Subsequent to convenience sampling, we observed that 68.75% of subjects were between 18 and 26 years of age, based Pareto chart analysis. For future study, there is a need to collect additional data on elderly drivers to more conclusively determine whether age has an influence on driver SA response at different types of interchanges (standard vs. GSIs).
ACKNOWLEDGMENT
This research was supported by North Carolina Department of Transpor- tation (Project No. 2019-26). The authors would like to acknowledge Christopher Carnes, Hillary Jackson, and Oliver Abreu at NC State ITRE for participant recruitment and data collection.
REFERENCES
Endsley, M. R. (1995), “Toward a theory of situation awareness in dynamic systems.” Human Factors, 37(1), pp. 32–64. Endsley, M.R. & Kaber, D.B. (1999), “Level of automation effects on performance,
situation awareness and workload in a dynamic control task.” Ergonomics, 42(3), pp.462–492. Eyler, D. R. (2005), “Arterial interchange.” Trans. Res. Record, 1912, 65–71. Hart, S. G., & Staveland, L. E. (1988), “Development of NASA-TLX (Task Load Index): results of empirical and theoretical research.” Advances in Psychology. Inman, V. W., Katz, B. J., & Hanscom, F. R. (2006), “Navigation signing for
roundabouts.” Transportation Research Record, 1973, 18–26. Kaber, D. B., & Endsley, M. R. (2004), “The effects of level of automation and adaptive automation on human performance, situation awareness and workload in a dynamic control task.” Theo. Issues in Ergo. Sci., 5(2), 113–153. Kaber D, Pankok Jr C, Corbett B, et al. (2015), “Driver behavior in use of guide
and logo signs under distraction and complex roadway conditions.” Applied Ergonomics, 47, 99–106. Larson M G. (2008), “Analysis of variance.” Circulation, 117(1): 115–121. Qiao, F., Liu, X., & Yu, L., (2007). “Using driving simulator for advance placement of guide sign design for exits along highways.” Department of Transportation Studies Texas Southern University, January.
Zahabi M, Machado P, Lau M Y, et al., (2017). “Driver performance and attention allocation in use of logo signs on freeway exit ramps.” Appl. Ergo., 65, 70–80. Zahabi M, White M M, Zhang W, et al., (2019). “Application of cognitive task
performance modeling for assessing usability of transradial prostheses.” IEEE Transactions on Human-Machine Systems, 49(4), 381–387. Zhang Y, Harris E, Rogers M, et al., (2013). “Driver distraction and performance effects of highway logo sign design.” Applied Ergonomics, 44(3), 472–479. Zhou, H., Wang, L., Gahrooei, M.R., et al., (2012b). “Contributing factors to wrong-
way driving crashes in Illinois.” ITE Midwestern District Conference and TRB 4th Urban Street Symposium. pp. 24–27.
LISTED IN THE AHFE DIGITAL BOOKSTORE CATALOGUE
Explore the complete digital volume
Human Factors in Transportation
Read this individual research paper free through the original publisher, or explore the full digital proceedings book.
ISBN 978-1-958651-36-0
Explore this ISBN in the AHFE Bookstore ↗Listed in the July 2026 bookstore catalogue; search by ISBN to confirm current availability · Digital book purchase optional