Rungthip Puntumetakul, Usa Karukunchit, Manida Swangnetr, MonteinPuntumetakul (2018). Effect of Time of Day and Treadmill Running on the Vertical Spinal Creep Response. In: Advances in Physical Ergonomics and Human Factors: Part I. AHFE Open Access, vol. 1. https://doi.org/10.54941/10019
Height loss during the day is attributed to gravitational loading of intervertebral discs. Previous research demonstrated treadmill running could maximize magnitude of vertical spinal creep (VSC) response. To date, previous studies have not yet investigated time of day when performing treadmill running has effects on VSC response. The aim of the study was to determine the effect of diurnal variation on VSC response after treadmill running. Sixty healthy subjects were recruited. Subjects were randomly assigned into either treadmill running or control groups. Each subject was asked to visit the lab on three consecutive days. The first day included familiarization sessions. The subsequent two consecutive days was to perform treadmill running or normal daily activity. Each subject was measured VSC responses using height loss stadiometer. For the intervention group, subjects were asked to perform treadmill running. For the control group, subjects were asked to continue normal daily activities during the experimental trials. Subjects were measured VSC responses after the completion of test trials. Paired t-test revealed significant increases in VSC responses in the treadmill running group for morning (p = 0.007) and afternoon sessions (p = 0.023). However, the time of day had no significantly effects on magnitude of VSC responses.
Vertical spinal creep (VSC) or height loss is creep that occurs in response to the effects of gravity (body mass) and to the addition of any extra load applied to the spine when the spine is in an upright posture (Adams & Hutton, 1983). Most tasks of daily living, for instance, static loading (Althoff et al., 1992; Eklund & Corlett, 1984; Puntumetakul et al., 2009; Troup et al., 1985), dynamic loading (Healey et al., 2008; McGill et al., 1996; Tyrrell et al., 1985) and vibration force (Bonney, 1988; Bonney & Corlett, 2003; Magnusson et al., 1992) are performed in upright postures and this could result in causing compressive loads to the spine and finally injure it. It is hypothesized that when the intervertebral disc and its surrounding structures have lost their fluid, this could result in less ability to resist pressure and stress, leading to the spine being easily injured (Wilby et al., 1987).
Moreover, the shrinkage of spinal vertebral periodically changes during the day (Healey et al., 2008). Research has shown that human height starts to decrease in the morning until bed time. The loss in height is about one percent of the body height. For instance, if your height is equal to 2 meters when it is measured in the morning, it will be equal to 1.98 meters when it is measured in the evening.
From this observation, researchers hypothesize that afternoon activity, when the intervertebral discs and its surrounding structures have less fluid leading cause less capability to resist pressure or stress and this might injure spinal tissues more easily than morning activity. In contrast, some researchers have set up a hypothesis that during activities in the morning (forward bending) when there is high fluid in the intervertebral disc and its surrounding structures, the lumbar disc and ligaments are at greater risk of injury (Adams et al., 1986). According to these hypotheses, many researchers have tried to control the effect of diurnal variation by asking their subjects to perform some tasks such as weight lifting (Wilby et al., 1987), walking (Healey et al., 2008) and static loading (Puntumetakul et al., 2009) and comparing the amount of the VSC measured in the morning to that in the afternoon. However, the findings of diurnal effect on the VSC are still controversial.
Running is a form of dynamic loading that decreases disc height more rapidly than static loading (Leatt et al., 1986; Tyrell et al., 1985; White et al., 1990). Nowadays running on a treadmill is one of the popular exercises because this exercise is relatively convenient for people to perform. Some people would prefer to do it in the morning, but some would do it in the evening. To date, no previous studies have demonstrated the effect of diurnal variation on the VSC response after running on a treadmill in a randomized controlled trial design. Therefore, the current study aimed to investigate the effect of time of day on the VSC response after running on a treadmill and to investigate the effect of treadmill running on the VSC response.
METHODS
Design and setting A randomized controlled trail was conducted in the Department of Physical Therapy, Faculty of Associated Medical Sciences, Khon Kaen University, Thailand.
Subjects Sixty asymptomatic subjects who had the same running experience, aged between 20-39 years, with normal BMI (BMI = 18.5-24.9 kg/m2) (www.nhlbisupport.com/bmi/), were screened by the researcher using a screening questionnaire. The subjects were required to give written and informed consent. The inclusion and exclusion criteria for the experiment were based on those used by Puntumetakul (2009). Subjects were included if they were males or females and aged between 20-39 years. The subjects were excluded if they 1) had experienced neck, thoracic or low back pain which required treatment or time off work, study or sport in the past 12 months, had previous injury to the spine including burns, fractures, dislocation, or had undergone surgery to any parts of their spine, 3) were currently on medications that would alter imbibition of water in the intervertebral disc, such as drugs in the groups of anti- inflammatory, prostaglandin inhibitors, steroids and non-steroidal anti-inflammatory drugs, 4) had difficulty with concentration or were currently on medication that affected their ability to concentrate, 5) had previous exposure to repeated radiation of the spine, 6) were diagnosed with a medical condition that affected spinal tissues and structures, such as, diabetes mellitus, ankylosing spondylitis, rheumatiod arthritis, and Scheuermann’s disease, 7) were currently involved in an occupation which entailed heavy manual lifting or whole-body vibration, 8) were diagnosed with heart disease, or 9) were pregnant.
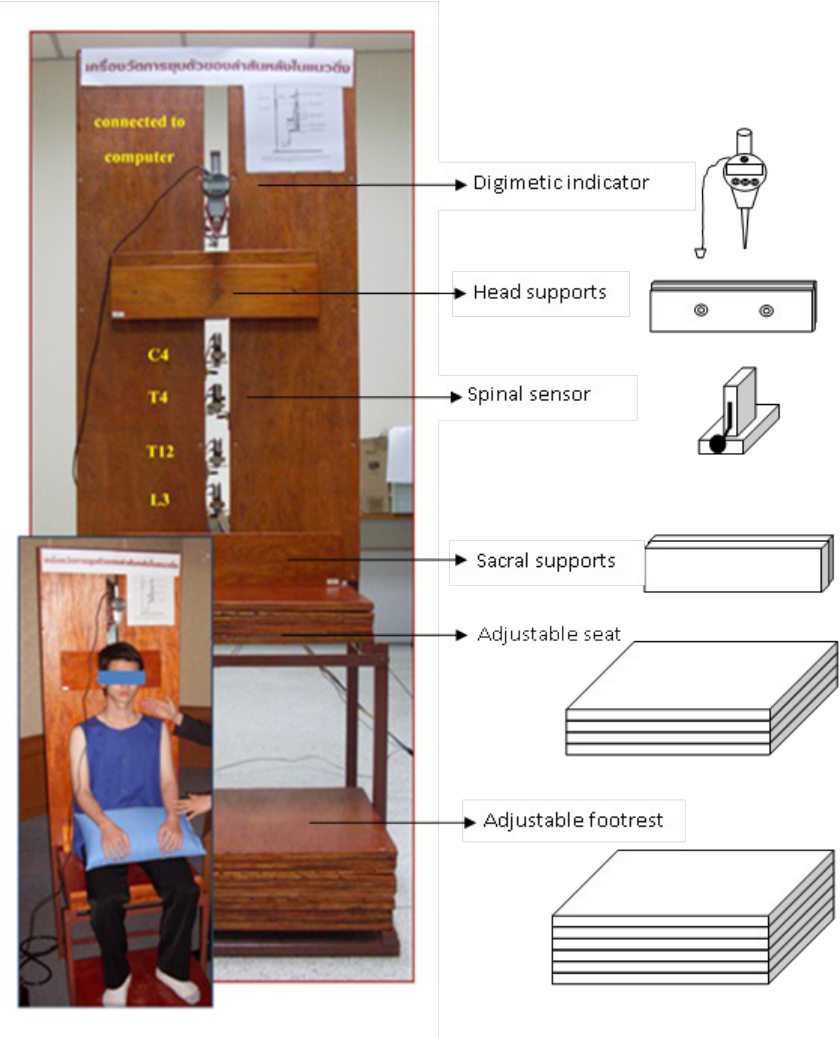
Each subject was randomly assigned to one of the two interventions (treadmill running group versus control group) using a stratified randomized allocation (gender). A height loss measuring stadiometer for measuring the VSC response used in the current study was modified from that invented by Eklund and Corlett (1984). The height loss measuring stadiometer was modified for use in a seated position in the current study (Figure 1). The accuracy and reliability of the equipment measurements were conducted prior to collecting the data.
Figure 1: A height loss measuring stadiometer (Pretty patent number 5607)
Part 1: Reliability test Reliability test of the digimetic indicator was conducted by using feeler guages (Figure 2), which were made from steel and their thicknesses were 0.15, 0.20, 0.25, 0.30, 0.35, 0.40, 0.45, 0.50, 0.55, and 0.60 millimeters. Then the ten feeler gauges were gradually put on in the vertical line, one by one from the maximal to minimal thickness, respectively. Next the digimetic indicator was lowered to contact the feeler gauge for measuring the thickness of the feeler gauge. This step was conducted until the thickness of the ten feeler gauges had been measured. Then the researcher gradually took off the feeler gauges one by one and measured the thickness of the feeler gauge again from the top until the last. The data from the readable digimetic indicator were recorded in the computer every time the feeler gauge was taken off or put on. The researcher repeated this step for three consecutive tests and then the data were calculated and reported to be the Intraclass Correlation Coefficient (ICC 1, 1).
Figure 2 Feeler guages
Intra-tester reliability test was conducted in ten asymptomatic subjects. A test design was used to evaluate the reliability of the VSC response. Each subject was asked to put on a sleeveless waistcoat with a hole along the middle of the back and to sit on a stool with hips and knees flexion at right angles. Four marks were placed on the skin overlying the spinous processes of C4, T4, T12 and L3 by using a waterproof pen. Then, each subject was asked to sit in a relaxed upright position on the height loss measuring stadiometer for three sessions for one minute per session. The magnitude of the VSC response in each session was calculated and reported using the Intraclass Correlation Coefficienct (ICC 3, 1). The ICC is dimensionless and it ranges between 0.00 and 1.00. Values below 0.50 represent poor reliability, values from 0.50 to 0.75 suggest moderate reliability, and values above 0.75 are indicative of good reliability (Portney & Watkins, 2000). The results showed that the intra-tester reliability test of the researcher was high (ICC 3, 1 = 0.96).
The standard error of measurement test (SEM) was conducted in ten asymptomatic subjects. A test design was used to evaluate the reliability of the VSC response. Each subject was asked to put on a sleeveless waistcoat with a hole along the middle of the back and to sit on a stool with hips and knees flexion at right angles. Four marks were placed on the skin overlying the spinous processes of C4, T4, T12 and L3 by using a waterproof pen. Then, each subject was asked to sit in a relaxed upright position on the height loss measuring stadiometer for three times with one minute per session. The magnitude of the VSC response in each session was calculated and reported using the SEM test. The SEM was calculated from formula: where Sx was the pooled standard deviation from three times of the VSC measurement. The results showed that the standard error of measurement (SEM) of the VSC response measured at three times was equal to 0.04 millimeters.
Mean of standard deviations (SDs) of stature measurements on the height loss measuring stadiometer were calculated from ten asymptomatic subjects. The subjects were asked to put on a sleeveless waistcoat with a hole along the middle of the back and to sit on a stool with hips and knees flexion at right angles. Four marks were placed on the skin overlying the spinous processes of C4, T4, T12 and L3 using a waterproof pen. Then, the subjects were asked to sit in a relaxed upright position on the height loss measuring stadiometer for 10 sessions, one minute per session. Each subject was asked to step in and step out for each session of measurement. Stature measurements using the height loss measuring stadiometer were deemed repeatable when a criterion of 10 consecutive stature measurements with a standard deviation of < 0.5 mm was met (Kanlayanaphotporn et al., 2003; Rodacki et al., 2001; Tyrrell et al., 1985). Smaller means of SDs values in relation to the means suggest smaller measurement errors and higher reliability. Each subject was required to attain the desired level of repeatability for the stature measurements (SD ≤ 0.5 mm) during the familiarization session. Mean of standard deviations of the VSC response measured at 10 times was 0.17 millimeters which was less than the generally acceptable value that was less than 0.5 millimeters.
Part 2: The effect of time of day and treadmill running group on the VSC response
After the subjects were randomized into either treadmill running or control group, each subject was asked to attend for three separate occasions. The first occasion was a familiarization session and the next two occasions were for the application of the two different times of day (morning and afternoon). On the familiarization session, the subjects had the aim and experimental procedures explained to them and the researcher asked the subjects if they had any questions regarding the current study. A screening questionnaire fill in complete ensure that they met the inclusion and exclusion criteria. After that they were asked to sign the informed consent for participating in the current study.
Treadmill running group The sequences of the familiarization session in the treadmill running group were as follows: (1) Subjects were asked to remove their shirt/blouse and to put on the sleeveless waistcoat which allowed visualization of the spine for marking, and then the spinous processes of C4, T4, T12 and L3 were marked while the subjects were in the sitting position. (2) Subjects were asked to adopt the unloaded position (Fowler’s position) for 20 minutes, to eliminate any effects of preloading on the spine before the test (Magnusson and Pope 1996). (3) After that subjects were asked to adopt a comfortable sitting posture: flexed hips and flexed knees in 90 degrees, on the height loss measuring stadiometer. Spinal sensors were adjusted to make contact with the marked spinous processes of C4, T4, T12 and L3 until all the light diodes were lit up. The measurement of the VSC response was measured for one minute. (4) Subjects were asked to run on the treadmill with a speed of at least 7 km/h (Adirek-udomrat et al., 2009a; 2009b) for five minutes. (5) Subjects were asked to rest after treadmill running for breathing recovery for 3 minutes (Leatt et al., 1986). (6) Subjects were asked to measure the VSC response on the height loss measuring stadiometer for one minute after running on the treadmill.
The whole familiarization session lasted approximately 25 minutes and it was performed at any time of the day. On completion of the familiarization session, the subjects were asked to arrive for the subsequent test session within 1-2 hours after waking up (6.00 AM – 8.00 AM) on the next day to minimize the effects of diurnal variation on the VSC response for the first experimental session (Kanlayanaphotporn et al., 2002; Tyrrell et al., 1985). Then, the subjects were requested to come back to the laboratory room in the afternoon (4.00 PM – 6.00 PM) on the next consecutive day for the final test session. All subjects were requested to maintain their normal daily activities and to have a good night’s sleep of at least 7 hours. The details of the procedure on the testing session were similar to the procedure on the familiarization session, except the subjects were asked to perform the running process for 41 minutes (2 min for general stretching, 3 min for running warm up, 30 min for running, 3 min for running cool down and 3 min for breathing recovery) (Figure 3) and the duration of the VSC measurement was for 2 minutes.
general stretching running warm up running running cool down breathing recovery 2-min 3-min 30-min 3-min 3-min
Figure 3 The study’s organization of activities
Control group The subjects were asked to perform the protocol similar to the treadmill running group, except they were asked to do normal daily activities for 41 minutes instead of performing the treadmill running and to refrain from any strenuous physical activities, such as running. Additionally, the subjects were asked to refrain from a lying position.
The magnitude of the VSC response using the means of 150 VSC data points recorded at the end of 30 seconds of the second minute was calculated in each experimental session. Demographic data were presented as mean ± standard deviations (SD). A paired t-test was used to compare the magnitude of the VSC response within group. An unpaired t-test was used to compare the magnitude of the VSC between groups. For all statistical tests, the threshold of significance was set at α ≤ 0.05. All analyses were performed on SPSS version 17.
RESULTS
The effect of time of day and treadmill running on the VSC response
Sixty healthy subjects accepted the invitation to participate in the current study. Demographic data of the subjects in each group was reported descriptively by means and standard deviations for age, height, weight and body mass index (Table 1)
Equation reproduced from the original PDF.Equation reproduced from the original PDF.
The magnitude of the VSC response measured in the morning The difference of the magnitude of the VSC response within group, measured in the morning, in the control group was not statistically significant difference (P = 0.09). However there was a statistically significant difference of the VSC response within group, measured in the morning, in the treadmill running group (P = 0.007) (Table 2).
Table 2 The magnitude of the VSC response measured in the morning in the control and treadmill running groups (mean ± standard deviation)
The magnitude of the VSC response measured in the afternoon
The difference of the magnitude of the VSC response within group, measured in the afternoon, in the control group was not statistically significant difference (p = 0.54). However, there was a statistically significant difference of the VSC response within group, measured in the afternoon, in the treadmill running group (p = 0.023) (Table 3).An important component of the human systems integration plan should be a verification and validation process that provides a clear way to evaluate the success of human systems integration. The human systems integration team should develop a test plan that can easily be incorporated into the systems engineering test plan. The effectiveness and performance of the human in the system needs to be validated as part of the overall system. It may seem more attractive to have stand-alone testing for human systems integration to show how the user interacts with controls or displays, how the user performs on a specific task. This methodology can address the performance of the human operator or maintainer with respect to the overall system. The most important thing is to develop a close relationship between human systems integration and systems engineering.
Table 3 The magnitude of the VSC response measured in the afternoon of the control and treadmill running groups (mean ± standard deviation)
When comparing between groups, they have no statistically significant difference in the magnitude of the VSC response between the control and treadmill running groups in both morning and afternoon sessions (Table 4).
Table 4 Comparison of the magnitude of the VSC response measured in the morning and afternoon between control and treadmill running groups (N=60)
Effect of time of day on the magnitude of the VSC response
The magnitude of the VSC response measured in the morning in both control and treadmill running groups are higher than those measured in the afternoon, but there were not statistically significant difference of time of day on the magnitude of the VSC response (Table 5)
Table 5 Comparison of the magnitude of the VSC response between morning AND AFTERNOON WITHIN GROUP (MEAN ± STANDARD DEVIATION)
Effect of time of day on the magnitude of the VSC response between the control and treadmill running groups Comparisons of the magnitude of the VSC response between the two groups showed that the magnitude of the VSC response in the treadmill running group was higher than in the control group measured both in the morning and in the afternoon but there were no significant difference in VSC response between groups (Table 6 and Figure 4).
Table 6 Comparisons of the magnitude of the VSC response between the control and treadmill running groups (N=60)
Figure 4 The magnitude of the VSC response between control group and treadmill running group measured in the morning and in the afternoon
The current study used the height loss measuring stadiometer which is a highly reliable device for investigating the VSC response. The results showed that the effect of time of day had no statistically significant effect on the magnitude of the VSC response in the both groups. And the magnitude of the VSC response compared between groups was not significantly different in both measurement sessions (morning and afternoon).
DISCUSSION
The current study investigated the effect of time of day and treadmill running on VSC response. Sixty healthy subjects who had the same running experience were divided into control and treadmill running groups in order to compare the VSC response between the morning (6.00-8.00 AM) and the afternoon (4.00-6.00 PM) using the height loss measuring stadiometer which measured the magnitude of VSC response which occurred between pretest and posttest.
The results showed that the magnitude of the VSC response measured in the morning of treadmill running group, after the running test (1.95 mm) significantly increased from that measured in before the running test (1.52 mm) (P = 0.007). Similarly, the magnitude of the VSC response measured in the afternoon of treadmill running group, after the running test (1.61 mm) significantly increased from that measured in before the running test (1.88 mm) (P = 0.023). These findings support the results of Dowzer et al. (1998) and Garbutt et al. (1990), that treadmill running is the activity to produce the spinal loading which leads to increased VSC and supports the result of Fowler et al. (2006) who studied the task of postal workers walking as performed using a treadmill that allowed participants to adjust the walking speed according to their self-selected pace throughout the activity, that the loaded condition produced a stature loss double that observed in the unloaded condition. Therefore, this study supports that dynamic loading influences the VSC response. However, the differences of the magnitude of the VSC response were very tiny, which may be no clinical significant difference.
Results from the control group showed that the magnitude of the VSC response after testing was higher than the magnitude of the VSC response before testing. However, there was no significant difference of the VSC response in both morning and afternoon. The magnitude of the VSC response in the control group increased since in the period of testing the subjects in the control group were asked to continue their normal daily activities and the most of activities in this group are standing and sitting which were in the upright posture. In the upright posture, the effect of gravity and the subject’s body weight can produce a compressive load on the intervertebral discs causing fluid in the nucleus pulposus to be expelled into the vertebral bodies and annulus fibrosus, leading to spinal height loss (Adams & Hutton, 1983).
The magnitude of the VSC response in both control and treadmill running groups demonstrated that the testing in the morning provided a greater VSC response than in the afternoon. However, time of day did not significantly affect the VSC response (P > 0.05). The finding was similar to previous studies (Althoff et al., 1992; van Dieen et al., 1994a; Puntumetakul et al., 2009). The study of Althoff et al. (1992) showed a trend towards greater VSC response in the morning than in the afternoon, but did not show a statistically significant difference. In contrast, van Dieen et al. (1994b) also found that the VSC response measured in the afternoon (1.00 PM) was greater than the VSC response measured in the morning (9.00 AM). However, there was no significant difference in VSC response measured in the morning and afternoon. The study of Puntumetakul et al. (2009) studied 48 asymptomatic subjects aged 24.7 ± 3.2 years, body weight 65.1 ± 11.0 kg, height 168.4 ± 8.9 cm and BMI 22.9 ± 3.0 kg/m2. The VSC response was recorded over 25 minutes while subjects remained seated on the stadiometer, at 3 times [morning (8.00 - 9.00 AM), midday (12.00 AM - 1.00 PM) and afternoon (4.00 PM - 5.00 PM)] on the same day. Their results showed that there was no statistically significant difference on the magnitude of the VSC response using a static loading condition (15 percent of subjects’ body weight). However, the load history between occasions of measurement was not controlled. The finding of the study suggests that the VSC measures can be taken at any time of day rather than being restricted to early morning. The previous studies used a different protocol and subjects, but the findings were similar to the current study.
In contrast, the results of the current study were differences from two previous studies (Healey et al., 2008; Wilby et al., 1987). The study of Wilby and co-workers (1987) investigated the circadian variation in the stature of ten females (aged 22.2 ± 3.1 years, body weight 61.4 ± 6.7 kg, and height 166.0 ± 5.0 cm) who were studied in eight exercises which formed weight-training for 20 minutes and found that significantly more stature reduction occurred when load was applied in the morning (5.4 mm) (7.30 AM) compared to the evening (4.3 mm) (10.00 PM).
Moreover, Healey et al. (2008) studied on 11 chronic low back pain (aged 32.8 ± 7.9 years, body weight 74.4 ± 14.2 kg, height 173.0 ± 3.0 cm) and 11 asymptomatic participants (aged 31.0 ± 6.3 years, body weight 72.6 ± 11.5 kg, height 176.0 ± 9.0 cm). Both groups were of mixed gender (male = 6, female = 5). The subjects walked on a treadmill at self-selected pace for 20 minutes wearing a weighted vest (10 percents of body mass), one set in the morning (9.00 AM) and the other set in the afternoon (2.00 PM). Both sessions were completed approximately one week apart. Changes in stature were measured using a standing stadiometer which inclined backwards 15 degrees from the vertical. They found that the VSC response of the asymptomatic group, measured in the morning (5.4 mm), was significantly greater than the VSC response measured in the afternoon (3.7 mm). The VSC response of the chronic LBP group experienced a similar pattern. The value measured in the morning (4.9 mm), was greater than the VSC response measured in the afternoon (4.4 mm). However, the difference between the morning and the afternoon was not statistically significant in the chronic LBP group. There was no significant difference in the VSC response between groups.
They concluded that less disc height was lost in the evening due to the disc having a lower capacity to shrink due to diurnal change, and thus the disc and the surrounding spinal structures have a reduced ability to accept loading stress during evening activity, and are therefore at a greater risk of injury (Wilby et al., 1987). These two studies measured the VSC response in a standing posture may influence the VSC response, and different results between the current study and the two studies may be masked by the difference of measurement method. And the subjects who participated in the previous study had different characteristics from the subjects from the current study.
The magnitude of the VSC response between control and treadmill running group in the current study showed that the magnitude of the VSC response in the treadmill running group was higher than in the control group, but there were no statistically significant differences in the VSC response between groups. The results were similar to the study of Leatt et al. (1986) who found no significant difference in the VSC response between novices (3.25 mm) and experienced runners (2.35 mm). They compared nine novice runners (age 19.9 ± 2.2 years, body weight 69.4 ± 4.0 kg, height 174.0 ± 5.0 cm) and seven experienced runners (age 31.0 ± 10.0 years, body weight 62.4 ± 5.3 kg, height 172.0 ± 4.0 cm) who ran a total of six kilometers. The six kilometers run is typical of a training regime advocated for recreational joggers (Pollock et al., 1987). Additionally, they compared the 6-km run and the 19-km run in experienced runners and found significant differences in the VSC response between distances. The data suggest that the duration of the exercise is a dominant factor in determining the total spinal loading during training runs. However, the current study in the treadmill running group was performed at a speed of 7.80 ± 0.81 km/hr-1 for 30 minutes, and therefore the total distance running was about 3.9 km. This distance running of treadmill running group in the current study may be too low to make a significant difference in the VSC response between treadmill running group and the control group.
CONCLUSION This is the first study to compare the effect of time of day between daily activities and treadmill running on the VSC response using a randomized controlled trial. The effect of time of day did not affect the magnitude of the VSC response in both daily activities and treadmill running groups. Furthermore, the VSC response between daily activities and treadmill running was not significantly different. Therefore, the people who are similar to the subjects in the current study can choose any time of day between the morning and the afternoon for running on the treadmill following the protocol in this study. Our study reflects that the effect of time of day on the VSC response may not require to be strictly controlled in asymptomatic subjects, aged between 20-39 years. Additionally, the height loss measuring stadiometer used in the current study is acceptable to be a high reliability device to measure the magnitude of the VSC response.
REFERENCES
Adams, M.A., Hutton, W.C. (1986), “The effect of posture on the diffusion into lumbar intervertebral discs”, J Anat, 147(8), 121-
34. Adams, M.A., Hutton, W.C. (1983), “The effect of posture on the fluid content of lumbar intervertebral discs”, Spine, 8(6), 665- 71. Adirek-udomrat, J., Puntumetakul, R., Siritaratiwat, W., Phadungkit, S., Boonprakob, Y. (2009), “Effect of treadmill running to spinal range of motion in total lumbar flexion and total lumbar extension (Preliminary study)”, The 12th National Graduate Research Conference, 973-81. Adirek-udomrat, J., Puntumetakul, R., Phadungkit, S., Wanpen, S., Siritaratiwat, W. (2009),”Effects of treadmill running between
novices and experienced runners on total range of lumbar flexion and lumbar extension”, KKU Res J, 9(4), 41-9. Althoff, I., Brinckmann, P., Frobin, W., Sandover, J., Burton, K. (1992), “An improved method of stature measurement for quantitative determination of spinal loading: Application to Sitting Postures and Whole Body Vibration”, Spine, 17(6), 682-93. Bonney, R., Corlett, E.N. (2003), “Vibration and spinal lengthening in simulated vehicle driving”, Appl Ergon, 34(2), 195-200. Bonney, R. (1988), “Some effects on the spine from driving”, Clin Biomech, 3(4), 236-40. Dowzer, C.N., Reilly, T., Cable, N.T. (1998), “Effects of deep and shallow water running on spinal shrinkage”, Br J Sports
Med ,32(1), 44-8. Eklund, J.A., Corlett, E.N. (1984), “Shrinkage as a measure of the effect of load on the spine”, Spine, 9(2), 189-94. Fowler, N.E., Rodacki, A.L.F, Rodacki, C.D. (2006), “Changes in stature and spine kinematics during a loaded walking task”, Gait & Posture, 23(2), 133-41. Garbutt, G., Boocock, M.G., Reilly, T., Troup, J.D. (1990), “Running speed and spinal shrinkage in runners with and without
low back pain”, Med Sci Sports Exerc, 22(6), 769-72. Healey, E., Burden, A.M., McEwan, I.M., Fowler, N.E. (2008), “Stature loss and recovery following a period of loading: effect of time of day and presence or absence of low back pain”, Clin Biomech, 23(6), 721-9. Kanlayanaphotporn, Trott, P., Williams, M., Fulton, I. (2003), “Effects of chronic low back pain, age and gender on vertical
spinal creep”, Ergonomics, 46(6), 561-73. Kanlayanaphotporn, Williams, M., Fulton, I., Trott, P. (2002), “Reliability of vertical spinal creep response measured in sitting (asymptomatic and low-back pain subjects)”, Ergonomics, 45(3), 240-7. Leatt, P., Reilly, T., Troup, J.D.G. (1986), “Spinal loading during circuit weight-training and running”, Br J Sport Med, 20(3),
119-24. Magnusson, M., Almqvist, M., Broman, H., Pope, M., Hansson, T. (1992), “Measurement of height loss during whole body vibrations”, J Spinal Disord, 5(2), 198-203. Magnusson, M., Pope, M.H., Hansson, T. (1996), “Does a back support have a positive biomechanical effect?”, Appl Ergon,
27(3), 201-5. McGill, S.M., van Wijk, M.J, Axler, C.T., Gletsu, M. (1996), “Studies of spinal shrinkage to evaluate low-back loading in the workplace. Ergonomics”, 39(1), 92-102. Portney, L.G., Watkins, M.P. (2000), “Foundations of Clinical Research: applications to Practice (2nd ed.)”, New Jersey Prentice
Hall Health. Puntumetakul, R., Trott, P., Williams, M., Fulton, I. (2009), “Effect of time of day on the vertical spinal creep response”, Appl Ergon, 40(1), 33-48. Rodacki, C.L.N., Fowler, N.E., Rodacki, A.L.F, Birch, K. (2001), “Repeatability of measurement in determining stature in sitting
and standing postures”, Ergonomics, 44(12), 1076-85. Troup, J.D.G., Reilly, L.T., Eklund, J.A.E., Leatt, P. (1985), “Changes in stature with spinal loading and their relation to the perception of exertion or discomfort”, Stress Med, 10(2), 161-4. Twomey, L.T., Taylor, J.R. (1987), “Age changes in lumbar vertebrae and intervertebral discs”, Clin Orthop Relat Res, 224, 97- 104. Tyrrell, A.R., Reilly, T., Troup, J.D. (1985), “Circadian variation in stature and the effects of spinal loading”, Spine, 10(2), 161- 4.
van Dieen, J., Creemers, M., Draisma, I., Toussaint, H.M., Kingma, I. (1994), “Repetitive lifting and spinal shrinkage effects of age lifting technique”, Clin Biomech, 9(6), 367-74. van Dieen, J., Toussaint, H.M., Stam, C., Hol, J. (1994), “Viscoelasticity of the individual spine”, Clin Biomech, 9(6), 367-74. White, A.A., Panjabi, M.M. (1990), “Clinical biomechanics of the spine (2nd ed.)”, Philadelphia: Lippincott. Wilby, J., Linge, K., Reilly, T., Troup, J.D.(1987), “Spinal shrinkage in females: circadian variation and the effects of circuit
weight-training”, Ergonomics, 30(1), 47-54.
LISTED IN THE AHFE DIGITAL BOOKSTORE CATALOGUE
Explore the complete digital volume
Advances in Physical Ergonomics and Human Factors: Part I
Read this individual research paper free through the original publisher, or explore the full digital proceedings book.
ISBN 978-1-4951-2104-3
Explore this ISBN in the AHFE Bookstore ↗Listed in the July 2026 bookstore catalogue; search by ISBN to confirm current availability · Digital book purchase optional