Sharifah Liew, Phoebe Francis, Chen Teck Foong (2022). The Critical Factors in Human Error that Lead to Express Bus Accidents in Malaysia. In: Advances in Human Aspects of Transportation: Part III. AHFE Open Access, vol. 17. https://doi.org/10.54941/ahfe100736
The purpose of this paper is to determine the critical factor in human error that contributes towards express bus accidents. Three main attributes in human error are discussed, which are physical, mental and experience. Thus, this research aims in finding the highest contributor in human error and the main concern in road safety regarding express bus. This research was conducted in which a user opinion and experience on factor causes express bus accidents is accounted with a total of 287 respondents which consist of bus driver, bus passengers or victims, firemen, police officer, express bus management companies and officers of road safety agency participated. The factor analysis method was utilised and the factors attributing to human error was extracted and interpreted. This research indicates that physical, mental and experience attributes of the express bus driver do contribute in human errors towards accidents. It was found that mental attributes of the bus driver has high effect on contributing to human error towards express bus accidents and driver’s sleepiness was the biggest concern in the express bus accident causes. Other attributes were discussed more in this paper and somehow provide an interesting insight of plausible cause of express bus accident.
Road accidents have been recognised as one of the main contributors to human and economic losses both in developed and developing countries. In the year 2011, road accidents in Malaysia have totalled up to 449,040 accidents, and accidents involving bus was reported at 9,986 accidents (Ministry of Transport Malaysia, 2011). These figures keep increasing from year to year and followed by the number of death and injuries caused by road accidents. In year 2011 alone, it can be inferred that 25570 injuries and death were caused by road accidents (Ministry of Transport Malaysia, 2011).
Green and Senders (1997) discussed that human errors has always been associated with the cause of road accidents and mentioned human information processing limitations as the main contributor of human error. In a previous research by Treat et al (1977), it was found that human error had high impact on road accidents compared to other factors such as mechanical and environmental factors.
User state is one of the element in human error that contributes to road accidents. Physical attributes of a driver do play an important role in road safety. One of the physical attributes in order to maintain road safety is driver having good visual abilities. In a previous research by Davidson (1985), it was found that there is a statistically significant relationship that driver having poor vision are more likely to involve in road accidents. It was also found that age do relate with accidents as age increases, the visual abilities decreases (Davidson, 1985). Other than that, illegal drug use, alcohol use and drinking problem contributed highly in the occurrence of road accidents. (Christophersen & Mørland, 1997; Marc & Mura, 2005; Gjerde et al, 2011). The use of mobile phone during driving had brought concern to the safety in driving, too. Although mobile phone may have hands-free feature, it was still observed that there is no safety advantage when compared to hand-held mobile phone while driving (Redelmeier & Tibshirani, 1997; Haigney, Taylor, & Westerman, 2000; Vanlaar & Yannis, 2006).
Sleepiness, fatigue and health problems in drivers were proven to have a high impact in causing accidents. Sleepiness for example have been a frequently discussed issue in road safety in terms how it affects road accidents (Nordbakke & Sagberg, 2007; Anund et al, 2011). This was discussed in mental attributes of human error for a driver. Alongside sleepiness and fatigue are drivers’ behaviour towards other road users and when on the road. Driver fatigue had also always been associated with the causes of road accident. Brown (1994) defined fatigue as a subjectively experienced unwillingness in performing the task at hand, and since bus drivers are known to have irregular time in working, and they might be driving in wee hours, the case of having fatigue is no more an unusual issue.
Previous studies have found that drivers’ behaviour on the road was an important factor in road accident causation Rothengatter, 1997) and driver violations are the major contributor in road accident cause (Sabey & Taylor, 1980; Streff, 1991). Thus, it can be concluded that drivers’ behaviour when on the road is an important issue, too. The objective of this research is to determine the most critical factor in human error that contributes towards express bus accidents in Malaysia. Three main attributes in human error are discussed, which are physical, mental and experience. Thus, this research aims in finding the highest contributor in human error and the main concern in road safety regarding express buses.
CONCEPTUAL FRAMEWORK Based on the report of Van Elslande, Naing, Engel (2008) for traffic accident causation in Europe, classification was done according to user related, vehicle related and environmental related factors which could lead to human functional failures. In their report, user related factors were divided into three main classes, namely, user state, experience and behaviour.
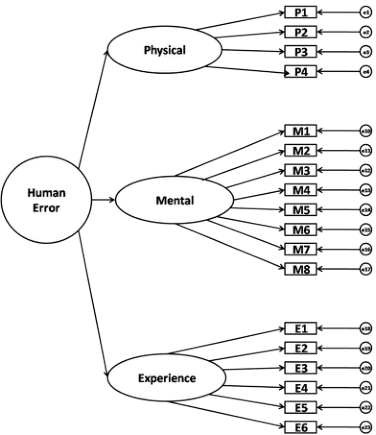
In this study, user states were divided into two main groups, namely physical, and mental. Experience however was maintained under a different group, which is still under user state. The conceptual framework in Figure 1 shows a model of how human error contributes towards accidents. Human error towards accidents, physical, mental and experience are the endogenous variable, whereas, the 18 items in human errors acted as the exogenous variables. Endogenous variables will later be predicted from the exogenous variable. Testing this model require two stages of analysis: an exploratory factor analysis (EFA), followed by confirmatory factor analysis (CFA). In order to extract the underlying structure of latent variables, which are the possibility of occurrence of accidents, EFA was applied.
Figure 1. Conceptual Framework for Research
METHODOLOGY
The questionnaires were divided into several sets according to the type of respondents, in order to collect effective information from each type of groups. Each set consist of four sections. Part A for demographic information, Part B for experiences regarding involvement in express bus accidents, Part C for the Human Factors that may cause accidents, and Part D for suggestions and opinions regarding the current express buses issues in Malaysia and ways to improve and reduce accidents. In order to find the critical factors among human errors that contribute to express bus accidents, the responses were measured on a 5 - point Likert scale. Score 1 means less likely to contribute to cause accident, whereas score 5 has the highest possibility of risk to accidents. These set of variables are considered in order to obtain the main determinants in human error which leads up to bus accidents.
A total of 23 factors that are expected to cause express bus accidents were identified and measured in the Likert scale from 1 - Strongly Disagree to 5 - Strongly Agree. Missing data has always been part of all research. However, missing data up to 10 percent was still acceptable and unlikely to be problematic in analysing the result from studies according to Cohen and Cohen (1983). In order to treat missing values in the data, Expectation Maximisation (EM) algorithm in SPSS was used as EM algorithm is an iterative processing that are applied to predict the values of the missing variables. EM method of data imputation were considered more consistent and accurate in predicting parameter estimates than methods such as list-wise deletion, which was found by Graham et al (1997) in a series of Monte Carlo experiments. For this study, SPSS software version 21 and AMOS software version 21 was used to analyse the data. Exploratory Factor Analysis was run using SPSS, whilst Structural Equation Modelling technique was applied using the AMOS software.
DATA COLLECTION This research was conducted in which user’s opinions and experiences on factor leading to express bus accidents are accounted for. The sample was stratified by the type of respondents with a total of 308 questionnaires collected for this research. However, a total of 287 usable questionnaires were coded for analysis. The type of respondents consisted of bus driver, bus passengers or victims, firemen, police officer, express bus management companies and officers from MIROS. The six types of respondents were selected because they are the most associated respondent with express buses and may have experience in handling accidents regarding express buses. Table 1 illustrates the socio-demographic profiles of the respondents.
Table 1: Socio-demographic profile of the respondents (n = 287) Variable %
Table available in the original PDF paper.
Type of respondents Bus driver 12.9 Passengers/Victims 32.8 Fireman 30 Police officer 10.8 Bus management officer 7.0 MIROS officer 6.6 Gender Male 67.6 Female 32.4 Age 25 and below 28.0 26 - 35 31.1 36 - 45 21.3 46 and above 19.6 Religion Islam 64.8 Buddha 4.5 Hindu 3.8 Christian 26.8 Race
Malay 60.6 Chinese 8.0 Indian 3.5 Bumiputera Sabah 1.0 Bumiputera Sarawak 26.8 Income Less than RM1500 34.5 RM1501 - RM2500 39.0 RM2501 - RM3500 13.6 More than RM3501 12.9 Education Primary 11.1 PMR 47.4 SPM 9.4 STPM/A-Level 13.6 Undergraduate 10.5 Postgraduate 8.0
DATA ANALYSIS This research is theoretically driven and based on previous researches, thus the scale of possibilities of factors contributing to express bus accidents is exclusive to this study and was drawn from a scope of previous studies on factors causing road accidents. EFA was used to identify the underlying dimensions or factors in the data. For this purpose, SPSS is used to analyse the data. Several factors in human errors are included in the factor that causes accident, namely, physical and physiological, mental and emotion, and experience. At a later stage, AMOS a Structural Equation Modelling (SEM) software was used to employ CFA in order to validate and estimate the proposed models.
RESULT
In order to reduce the 23 human error factors that may contribute to express bus accidents, EFA was applied into a more acceptable number of constructs. The EFA was executed using the principal components and varimax rotation methods, with cut-off eigenvalue of 1.0. The results from EFA of the three factors were reduced from 23 items into 18 items and are presented in Table 2.
In the first factor with 15.2% of the total data variance; observed variables, which are the well being or physical factor of the driver, such as driver having poor vision, misusing drugs and using mobile phone while driving were presented. For the second factor, with 23.4% of the total data variance, items such as driver is sleepy, driver ignoring rules and driver is under stress is classified under mental factor. Comprising of 23.4% of the total data variance, the third factor is classified as the experience factor, which comprised of items such as driver does not have enough driving experience of driving bus, driver does not have enough experience of the route taken and driver lack of skill in driving in bad weather. Therefore, the three factors explain approximately 62% of the total data variance. The reliability test for the three factors, physical, mental, experience possessed excellent reliability with coefficient alphas of above 0.7 as recommended by Nunnally (1978).
Table 2: Rotated component matrix of the factors derived from the EFA Factor Question
Table available in the original PDF paper.
Description Physical Mental Experience ID S11 Driver has poor vision 0.586 S14 Driver is drinking alcohol 0.821 S15 Driver is misusing drugs 0.837 S16 Driver is on using mobile phone while driving 0.616 S8 Driver is sleepy 0.740 S9 Driver is tired 0.707 S10 Driver is not a good health 0.519 S17 Driver is over speeding 0.707 S18 Driver ignores rules 0.622 S19 Driver is not respecting others road user 0.620 S20 Driver thinks he/she drives better than others 0.581 S22 Driver is under stress 0.647 S25 Driver does not have enough experience of driving bus 0.733 S26 Driver does not have enough experience of the route taken 0.839 S27 Driver lack of skill in driving in handling bus 0.827 S28 Driver lack of skill in driving in bad weather 0.802 S29 Driver lack of skill in driving in the dark area 0.783 S30 Driver lack of skill in driving in new area/route 0.766 Variance explained 15.2% 23.4% 23.4% Reliability (alpha) 0.822 0.850 0.910
Extraction method: principal component analysis. Rotation method: varimax with Kaiser normalization EFA, exploratory factor analysis
Table 3 summarise the results of internal reliability and convergent validity for constructs. According to Fornell and Larcker (1981), convergent validity was determined based on factor loading, variance extracted and composite reliability. The factor loading for most the items in this study is above 0.5, as recommended by Hair et al (2006), as in order to demonstrate high convergence on a common point, the Standardised Factor Loadings should exceed 0.50 and ideally above 0.7. The average variance extracted (AVE) reflects the average of the squared factor loading for each construct as the AVE accounted were in range between 0.380 and 0.612. Even if AVE is less than 0.5 provided that the composite reliability is higher than 0.6, the convergent validity of the construct is still acceptable (Fornell and Larcker, 1981; Huang et al, 2013). The composite reliability (CR) ranged from 0.787 to 0.904, which were above the recommended level of 0.7 as suggested by Gefen et al. (2000).
Table 3: Convergent validity
Table available in the original PDF paper.
Constuct Item loading AVE CR Physical 0.481 0.787 Driver has poor vision 0.656 Driver is drinking alcohol 0.685 Driver is misusing drugs 0.650 Driver is on using mobile phone while driving 0.776 Mental
0.380 0.790 Driver is sleepy 0.695 Driver is tired 0.525 Driver is not at good health 0.639 Driver is over speeding 0.651 Driver ignores rules 0.601 Driver is not respecting others road user 0.633 Driver thinks he/she drives better than others 0.582 Driver is under stress 0.590 Experience
0.612 0.904 Driver does not have enough experience of driving bus 0.658 Driver does not have enough experience of the route taken 0.770
Driver lack of skill in driving in handling bus 0.842 Driver lack of skill in driving in bad weather 0.837 Driver lack of skill in driving in the dark area 0.798 Driver lack of skill in driving in new area/route 0.774
Using AMOS version 21 software, the structural model was estimated by means of maximum likelihood estimate (MLE). For the test, the overall model fit produced a x2 = 230.533, with p-value less than 0.001 and 103 degree of freedom. All the fit indices exceeded the recommended values of 0.9 cut-off value as recommended (Bagozzi and Yi, 1988) , where the goodness-of-fit index (GFI) (0.919), the comparative fit index (CFI) (0.958), the Tucker-Lewis Index (TLI) (0.938). As suggested by Chau and Hu (2001), the recommended cut-off value for goodness-of-index (AGFI) was 0.8, and the result produced was 0.866, which was above the recommended value. The root mean square error of approximation (RMSEA) (0.066) was lower than 0.08 as suggested by Browne and Cudeck (1993). The normed chi square was 2.238 which were lower than the recommended value of 3 (Bagozzi and Yi, 1988). Therefore, it can be concluded that the structural model fitted the data well.
Table 4 showed the correlation of each construct was less than the square root of the AVE, except for constructs for mental. Discriminant validity measures the degree to which different concepts were examined (Ramayah, Wai, & Lim, 2012). It can be analysed by comparing the correlations between constructs and square root of the variance extracted for a construct (Fornell and Larcker, 1981).
3. Physical 0.481 0.817 0.693 Note: The entries represent the correlations, while diagonals represent the square root of the average variance extracted.
The summary of the structural model is presented in Table 5. It showed that Human Error toward accident is positively related to Physical (β = 0.887, p < 0.01), Human Error towards accidents is positively related to Mental (β = 0.920, p < 0.01) and Human Error towards accidents is positively related to Experience (β = 0.542, p < 0.01). Thus, this shows that all the hypotheses were supported and physical, mental and experience of express bus driver do contribute in human error towards accidents. Mental attributes was the strongest predictor of human error towards accidents, followed by physical attributes and experience.
Table 5: Summary of the structural model
Table available in the original PDF paper.
C.R Result
Path Description Path Coefficient
s HUMAN ERROR [Equation or mathematical symbol available in the original paper PDF] HE1
Human Error towards accidents [Equation or mathematical symbol available in the original paper PDF] Physical 0. 887 9.091** Support
ed HUMAN ERROR [Equation or mathematical symbol available in the original paper PDF] HE2
Human Error towards accidents [Equation or mathematical symbol available in the original paper PDF] Mental 0. 920 10.108 ** Support
ed HUMAN ERROR [Equation or mathematical symbol available in the original paper PDF] HE3
Human Error towards accidents [Equation or mathematical symbol available in the original paper PDF] Experience 0. 542 7.229** Support
ed **p ≤ 0.01
Thus, the result of the final modelling can be concluded as mental attributes has the most significant contribution with regression weight of 0.920, followed by physical attributes with regression weight of 0.887 and experience attributes with regression weight of 0.542. It was also found that the item ‘Driver is sleepy’ had higher significant contribution with item loading value of 0.697.
DISCUSSION AND CONCLUSION This research indicates that physical, mental and experience attributes of the express bus driver do contribute in human errors towards accidents. It was found that mental attributes of the bus driver has a high effect on contributing towards express bus accidents and driver’s sleepiness was the biggest concern in the express bus accident causes. This result may be supported by various researches that has been done previously, as sleepiness was the highest contributor of road accident worldwide (Philip and Åkerstedt, 2006; Smith et al, 2009), Moreover, sleepiness is a good predictor of crash risk (Åkerstedt et al., 2008).
Driver fatigue had also always been associated with the causes of road accident. However, the result from this study showed that driver fatigue may not necessarily cause express bus accidents. Psychological fatigue is defined as a subjectively experienced unwillingness in performing the task at hand and it was showed the driver fatigue was reported as a source of road accidents and that its effects may likely be due to prolonged and irregular working hours that a driver might had (Brown, 1994). Express bus drivers were known with the fact that they do have irregular working hours as they might drive during wee hours, especially during festive seasons, where the demands of using express bus are higher. Thus, MIROS had come out with a report regarding banning the wee-hour express operation in Malaysia, which received mixed reactions from the Malaysians (Norlen et al, 2009). It was later proposed that banning of wee-hour operations is also not a practical solution for sustainability of express bus operations in this country particularly for those who requires long distance journeys.
The physical attributes was found to have positive contribution to the cause of accidents too. Items such as driver is using mobile phones while driving were seen as highest regression weight for physical attributes. There had been several studies, where the use of mobile phone, despite hands-free being used have impact in higher risk in involving in road accidents (Redelmeier & Tibshirani, 1997; Haigney, Taylor, & Westerman, 2000; Vanlaar & Yannis, 2006). Last but not least, the experience attributes in human error, were considered to have lowest contribution to human error towards accidents. Although it was quite low, it is still showed that it does affect road safety. Having an experienced driver is of course safer than a novice driver, and perceived risk of accidents better (Brown & Greoger, 1988). Overall, it can be summarised that physical, mental and experience attributes do contribute in towards road safety, especially express buses. Thus, it shows that a physically and mentally healthy bus driver, equipped with sufficient experience of driving express bus is required in order to have a safe journey especially for long distance route.
ACKNOWLEDGEMENTS
This research was supported financially by the Fundamental Research Grant Scheme (FRGS) of Ministry of Higher Education Malaysia.
REFERENCES
Åkerstedt, T., Connor, J., Gray, A., Kecklund, G., (2008). Predicting road crashes from a mathematical model of alertness regulation—the sleep/wake predictor. Accident Analysis and Prevention 40, 1480–1485. Anund, A., Kecklund, G., & Åkerstedt, T. (2011). Sleepiness, crashes and the effectiveness of countermeasures. Sweden: VTI
National Road and Transport Research Institute. Bagozzi, R.P., Yi, Y. (1988). On the evaluation of structural equation model. Journal of Academy of Marketing Science 16, 74-
94. Brown I. D. & Groeger J. A. (1988). Risk perception and decision taking during the transition between novice and experienced driver status. Ergonomics, 31 (4), 585-597 Brown, I. D. (1994). Driver fatigue. Human factors, 36(2), 298-314. Browne, M.W., Cudeck, R. (1993). Alternative ways of assessing model fit. In: Bollen, K.A., Long, J.S. (Eds.), Testing Structural
Equation Models. Sage, Newbury Park , CA .
Chau, P.Y.K., Hu, P.J.H. (2001). Information technology acceptance by individual professional: a model comparison approach.
Decision Sciences 32, 699-719 . Christophersen, A. S., & Mørland, J. (1997). Drugged driving, a review based on the experience in Norway. Drug and Alcohol Dependence , 125–135. Cohen, J., & Cohen, P. (1983). Applied multiple regression/correlation analysis for the behavioral sciences (2nd edition).
Hillsdale, NJ: Erlbaum. Davison, P. A. (1985). Inter-Relationships Between British Drivers‘ Visual Abilities, Age And Road Accident Histories.
Ophthalmic and Physiological Optics, 5: 195–204. doi: 10.1111/j.1475-1313.1985.tb00656.x Fornell, C., Larcker, D.F., (1981). Evaluating structural equation models with unobservable variables and measurement error.
Journal of Marketing Research 18, 39-50. Gefen, D., Straub, D.W., Boudreau, M.-C. (2000). Structural equation modeling and regression: Guidelines for research practice. Communications of the Association for Information Systems 4, 1e70 Gjerde, H., Normann, P., Christophersen, A., Samuelsen, S., & Mørland, J. (2011). Alcohol, psychoactive drugs and fatal road
traffic accidents in Norway: A case–control study. Accident Analysis & Prevention , 1197–1203. Graham, J.W., Hofer, S.M., Donaldson, S.L., MacKinnon, D.P., & Schafer, J.L. (1997). Analysis with missing data in prevention research. In: Bryant, K., Windle, M. and West, S. (Eds.), The Science of Prevention: Methodological advances from alcohol and substance abuse research, pp. 325-366. American Psychological Association, Washington, DC. Green, M., & Senders, J. (1997). Human Error in Road Accidents. Human Factors Science . Haigney, D., Taylor, R., & Westerman, S. (2000). Concurrent mobile (cellular) phone use and driving. Transportation Research
Part F , 113-121.
Huang, C.-C., Wang, Y.-M., Wu, T.-W., & Wang, P.-A. (2013). An Empirical Analysis of the Antecedents and Performance Consequences of Using the Moodle Platform. International Journal of Informationand Education Technology , III (2), 217-221.
Malhotra N. (2004). Marketing Research - an Applied Orientation, (4th edition). Prentice Hall: Upper Saddle River, NJ Marc, B., & Mura, P. (2005). Road Traffic, Global Overview of Drug and Alcohol Statistics. Encyclopedia of Forensic and Legal Medicine , 38–45. Ministry of Transport Malaysia (2013). Official Publications. Retrieved April 5, 2013, from Ministry Of Transport Malaysia:
http://www.mot.gov.my/en/Publication/Official%20Publications/Statistik%20Pengangkutan%20Malaysia%202011.pdf Nordbakke, S. & Sagberg, F. (2007). Sleepy at the wheel: Knowledge, symptoms and behaviour among car drivers.
Transportation Research Part F, 10, 1-10. Norlen M, Fadhli Y, Ilhamah O, Zarir HZ, Osman MR, Wong SV 2009, An Impact Assessment of Banning Wee-Hour Express Bus Operations, MRR 10/2009, Kuala Lumpur: Malaysian Institute of Road Safety Research. Nunnally, J.C. (1978). Psychometrict theory (2nd ed.). New York: McGraw Hill Philip, P., Åkerstedt, T. (2006). Transport and industrial safety, how are they affected by sleepiness and sleep restriction? Sleep
Medicine Reviews 10 (5), 347–356. Ramayah, T., Wai, J. W., & Lim, S. (2012). Sustaining the environment through recycling: An emperical study. Journal of Environmental Management 102 , 141-147. Redelmeier, D. A., & Tibshirani, R. J. (1997). Association between Cellular-Telephone Calls and Motor Vehicle Collisions. New
England Journal of Medicine , 453-458. Rothengatter, T. (1997). Psychological Aspects of Road User Behaviour. Applied Psychology , 223-234. Sabey. B., & Taylor, H. (1980). The known risks we run: The highway (Report SR 207).Crowthorne, UK: Transport Research Laboratory.
Smitha, S. S., Horswill, M. S., Chambersa, B., & Wetton, M. (2009). Hazard perception in novice and experienced drivers: The effects of sleepiness. Accident Analysis and Prevention , 729–733.
Streff, F.M. (1991). Crash avoidance: New opportunities for behavior analysis. Journal of Applied Behavior Analysis, 24.17-79. Treat, J. R., Tumbas, N. S., McDonald, S. T., Shinar, D., Hume, R. D., Mayer, R. E., Stanisfer, R. L. and Castellan, N. J. (1977) Tri-level study of the causes of traffic accidents. Report No. DOT-HS-034-3-535-77 (TAC) Vanlaar, W., & Yannis, G. (2006). Perception of road accident causes. Accident Analysis and Prevention , 155–161.
LISTED IN THE AHFE DIGITAL BOOKSTORE CATALOGUE
Explore the complete digital volume
Advances in Human Aspects of Transportation: Part III
Read this individual research paper free through the original publisher, or explore the full digital proceedings book.
ISBN 978-1-4951-2099-2
Explore this ISBN in the AHFE Bookstore ↗Listed in the July 2026 bookstore catalogue; search by ISBN to confirm current availability · Digital book purchase optional