Melcher Zeilstra, Marit Wilms, Fenneke Blommers, David de Bruijn (2022). Development of Future Scenarios: Prediction of Mental Workload in a Traffic Management Control Room. In: Advances in Human Aspects of Transportation: Part III. AHFE Open Access, vol. 17. https://doi.org/10.54941/ahfe100730
Existing instruments to investigate mental workload are dedicated to specific and existing monitoring jobs. Objective instruments mostly focus on performance or physiological measures. Subjective instruments are more simply applicable, but not suitable to predict mental workload in a nonexistent situation. To overcome these disadvantages Intergo developed OWATTM (Objective Workload Assessment Technique) to assess mental workload of operators in control rooms. A case study shows the use of OWATTM in development of scenarios for the near future of the traffic management control room of the city of Amsterdam, when new build tunnels are under super- vision of the central traffic management control room of the city of Amsterdam. Prediction of workload was key issue in this scenario development. The jobs assessed are traffic managers of the city of Amsterdam. The OWAT™ assessment made it possible to point out the bottlenecks in workload in current situation and future situation. The highly participative way of assessment of workload was appreciated by participating traffic managers. Results showed that there was an opportunity for a higher ambition in traffic management in the city of Amsterdam.
Existing instruments to investigate mental workload are dedicated to specific and existing monitoring jobs and tasks. Generally it takes months of preparation on analysing employee’s activities before the assessment of the tasks can start. Objective instruments focus on performance or on physiological measures. More generic and simply applicable instruments are subjective instruments. These are not suitable to predict mental workload for nonexisting jobs or situations not existing yet. To overcome these disadvantages Intergo developed OWAT TM (Objective Workload Assessment Technique).
DEVELOPMENT OF OWAT™ As a result of earlier investigation (Breed, 2008) Intergo decided to choose the VACP method, developed by McCracken and Aldrich (1984), as a base for the new technique. VACP is an abbreviation for the 4 modalities of human information processing: visual, auditory, cognitive and psycho-motoric. The VACP method is developed to assess jobs of the military air force. The calculation of mental workload cannot be generalized to other jobs or functions outside the military sector without any thought. To verify whether the VACP method is suitable as a generic instrument to assess and to predict mental workload, alternative calculation and scoring methods were proposed and investigated.
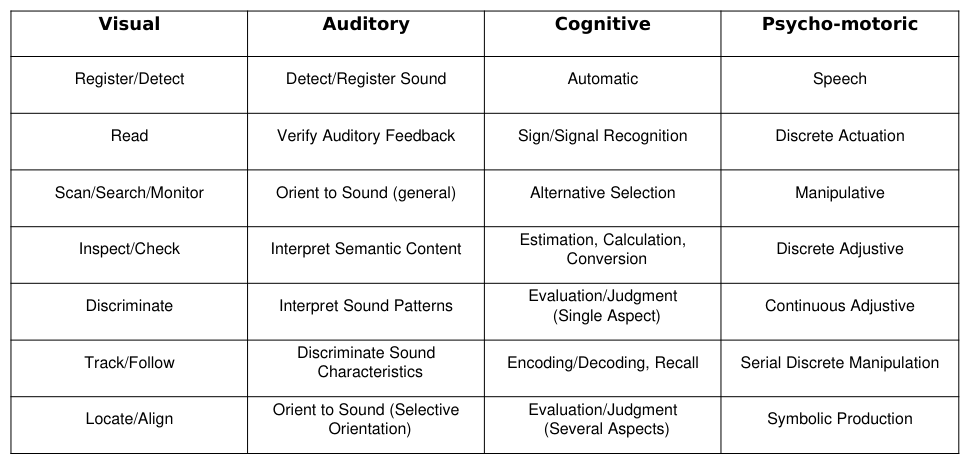
Varieties in VACP-method McCracken and Aldrich (1984) and Bierbaum et al. (1989) developed the VACP method to calculate the workload of a task using these 4 modalities. Within each modality of VACP a number of descriptors are used to categorize a task (Table 1). A descriptor is a general term meant to easily categorize tasks.
Table 1: VACP descriptors (Schuck, 1996)
In Schuck (1996) the descriptor paraphrases of the study by Bierbaum et al. (1989) are adopted. The descriptor paraphrases are both generic as well as unambiguous and without problems applied in various studies (Schuck, 1996). In Schuck (1996) each descriptor is given a weighing score as an indication of the amount of workload. To determine this weighing score for each descriptor some thousands of tasks derived from a database were coupled to the proper descriptor. The most representative set of tasks per descriptor was chosen. These sets of tasks, each with its descriptor, were stated to a panel (e.g. the CP-140 pilots in Schuck, 1996) that is asked to assess the weight of the descriptors compared to each other. The result is transformed linear on a scale from 1.0 to 7.0. So the final weighing score of a descriptor is derived from a panel’s judgment. It is highly questionable whether this descriptor weighing can be generalized to other occupational groups. Unfortunately no studies are known where a panel from outside the military aviation assesses the descriptors of Bierbaum et al. (1989).
To gain a clear understanding of the generalizability of the weighing of four descriptor assessments by CP-pilots (Schuck, 1996), Kiowa observers (Schuck, 1996), Kiawa pilots (Schuck, 1996) and UH-60 crew (Bierbaum et al., 1989) are statistically judged on their intra-class correlation coefficients (ICC’s). From the calculated ICC scores it can be concluded that the descriptor assessments by the panels are not fully consistent. They are well consistent in the auditory and cognitive modalities, but less in the psycho-motoric modality. Consistency in the visual modality is very low. For monitoring jobs the visual modality is the most important, together with the cognitive modality. If the descriptor weighing scores within one occupational group differ that much, it can be expected that the differences among various occupational groups will even be bigger. Therefor it did not seem recommendable to adopt the descriptor weighing from Schuck (1996) as a generic instrument to measure mental workload.
Alternative descriptor weighing Sarno and Wickens (1992) note that omitting the descriptor weighing scores does not alter the validity of the VACP instrument. Inspired by this observation some alternative descriptor scoring methods are proposed and tested within various jobs. The aim of these different methods is to make the descriptors more suitable for a generic instrument and to simplify the procedure to achieve descriptor weighing scores. For the development of OWAT TM several descriptor weighing methods were tested (Prins, 2009). Result of testing was that a descriptor weighing method as noted by Sarno and Wickens (1992), replacing the descriptor weighing scores in the VACP method of McCracken and Aldrich (1984) by 1 when the descriptor is present and 0 when the descriptor is absent, delivers the most practical instrument, with assessment scores equal to other methods. Also the chosen descriptor weighing method is more independent of subjective judgement of the descriptors then other descriptor weighing methods (Prins, 2009).
Validation of the VACP method The validity of the developed assessment technique is demonstrated by comparing mental workload scores calculated with different approved methods with the scores calculated with the proposed methods based on the VACP method (Prins, 2009). Breed (2008) already compared the VACP method with Task Weighing TM, a validated instrument developed by Intergo (Zeilstra et al, 2009) to investigate workload of train dispatchers, within time frames of 5 minutes of performing train dispatching tasks.
But it is also important to investigate the correlation between the separate task scores of the different instruments. Therefor the VACP scores of the supplier of travel information’s task, assessed by Breed (2009) were used. To validate these scores Prins (2009) determined the workload of this job using IWS (Pickup et al, 2005) and the SWORD method (Vidulich et al, 1991), both validated methods to assess mental workload. Results of the assessment of a train dispatchers’ task show a correlation of .69 to .88 between the proposed scoring methods and Task WeighingTM. Results of the assessment of a supplier of travel information’s task show a correlation of 0.75 to 0.88 with the SWORD method and a correlation of .74 to .93 with the IWS method (Prins, 2009). In another study a correlation of 0.71 to 0.85 between OWAT™ assessment and results of SWORD method was shown (Weeda and Zeilstra, 2013).
Limits of acceptable workload People are able to deal with mentally highly demanding tasks during short periods of time. They use compensating strategies to execute the tasks and to prevent faults and misses (Wickens, 2002; Kahneman, 1973; Embrey et al, 2006; Rueb et al, 1994). These compensating strategies are in the long term associated with performance devaluation, and problems with health and motivation. So the question is: when will the mental workload become too high? Limits for acceptable workload are developed to assess nonexisting jobs or tasks, using earlier investigations by Intergo using Task WeighingTM (Zeilstra et al, 2009; Weeda and Zeilstra (2013).
CURRENT TRAFFIC MANAGEMENT CONTROL ROOM OF THE CITY OF AMSTERDAM Lay out of current traffic management control room
The job concerning is the traffic manager in the traffic management control room of the city of Amsterdam. This traffic management control room monitors traffic in the city center of Amsterdam and several routes into the city center. Also there are 2 bigger tunnels and 2 smaller tunnels, which have to be monitored with special focus on tunnel safety and free flow of traffic through these tunnels. There are 3 monitoring desks in the control room. Each monitoring desk has its own video wall, tunnel control systems per tunnel, and several communication systems. Figure 1 shows schematically the layout of the current traffic management control room.
Figure 1. Schematic lay-out of the current traffic management control room
Figure available in the original PDF paper.
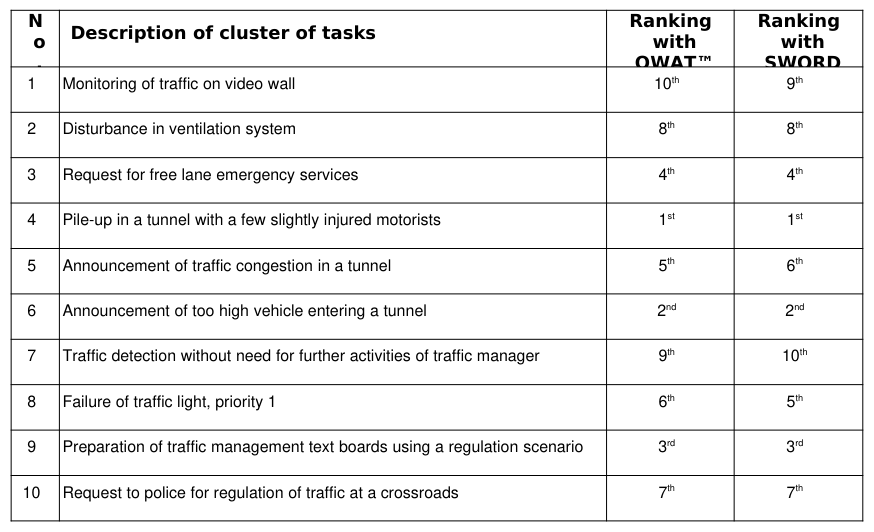
Mental workload in current situation At the start of the project a project team was formed with a representation of traffic managers and senior management of the traffic management control room. First step was to investigate historic data which situations could be representative for workload calculations for the current situation. Based on task descriptions, training documentation and historic data a clustering of tasks was made, which could be representative for all tasks in all tunnels. Each cluster of tasks described a certain occasion which gives rise to action of a traffic manager (see Table 2, second column).
Together with the project team of traffic managers each cluster of tasks is assessed for aspects related to workload in information processing activities; the descriptors of the VACP method chosen for OWAT™. Ranking of clusters of tasks, based on OWAT™ scores, is shown in Table 2, third column. The cluster of tasks indicated with 1st is most demanding for mental workload, the task indicated with 10th is least demanding.
The assessment resulting in the OWAT™ scores of the clusters of tasks was validated using the subjective instrument SWORD (Subjective Workload Dominance). The SWORD method, developed by Vidulich et al (1991), compares the mental workload of different tasks within a job by presenting each possible pair of tasks in a questionnaire. With SWORD mental workload is assessed on a 17 points scale. There was a good correlation between all respondents in the SWORD assessment (Intraclass correlation of 0.81, Portney and Watkins, 1993). The result of this validation in terms of ranking is also shown in Table 2, fourth column. The correlation coefficient for correlation between OWAT™ scores and SWORD scores on group level was 0,97 (Pearsons product moment correlation Coefficient). Differences in ranking could be clarified for the most by taking the amount of routine in execution of tasks and the experienced user-friendliness of various systems into account.
Table 2: Ranking of clusters of tasks of the traffic managers
The traffic managers described 2 imaginary but realistic cases of 2 hours work, one during rush hour (07.30 a.m. till 09.30 a.m.) and one during a disturbance during rush hours. Disturbances to be described were based on historic data over the last year and traffic managers made use of the defined clusters of tasks. The OWAT™ scores for each task were projected on the cases to predict the workload in both situations. The scores per 5 minutes were added up and weighted against the limits for acceptable workload.
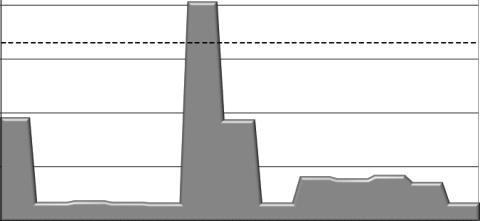
Figure 2 and Table 3 show the results of OWATTM calculations during rush hours without disturbances for a specific monitoring desk. In these situations traffic managers have to monitor traffic in the neighbourhood of the tunnel and in the tunnel and they have to react on more or less demanding alerts regarding traffic management systems and regarding tunnel installations.
Figure 2. Workload for traffic manager during rush hours without disturbances (desk 3)
Limits of acceptable workload are part of the OWAT™ instrument. The lines in Figure 2 represent the several limits of acceptable workload when assessed by use of OWAT™. Calculations showed that workload is acceptable during rush hours without disturbances.
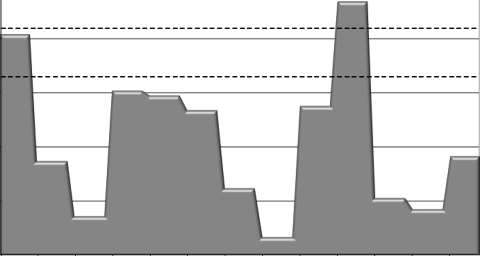
During a disturbance the traffic managers have to safeguard tunnel safety by manipulating tunnel installations and traffic management systems and contact by phone with emergency services and local assistance personnel. Calculations showed that at the beginning of a disturbance, workload would be unacceptable for one traffic manager, but two can do the job using a certain prioritization in execution of tasks. Figure 3 and Table 3 show the result of the workload assessment for the traffic manager of desk 3, with use of rules of prioritization and with support by the traffic manager of desk 1 necessary for further decrease in peak load. Calculations showed that also for situations comparing rush hours with disturbances workload is acceptable for 2 traffic managers.
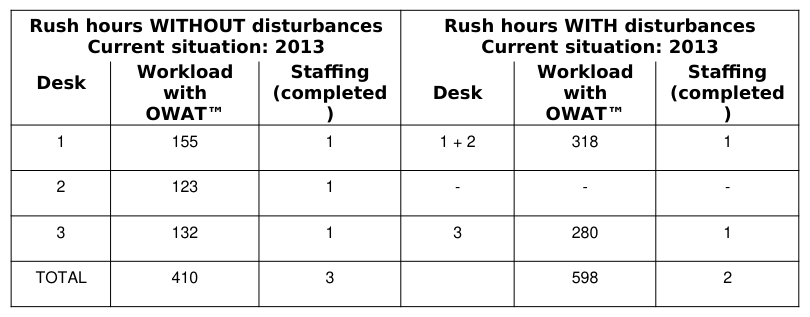
Note in Table 3 that staffing during rush hours with disturbances is smaller than staffing during rush hours without disturbances. During certain modelled disturbances one of the traffic managers leaves the traffic management control room to provide assistance locally at one of the tunnels with a pile up and later on at one of the tunnels with detection of too high vehicle stopped at the entrance of the tunnel. The other 2 traffic managers take over his monitoring desk. Another reason why staffing during disturbances can be limited to 2 traffic managers is that using rules of prioritization and collaboration during limited time, occurring peak load can be reduced. Ergonomic disadvantages caused by limited staffing during situations with disturbances, especially regarding monitoring 2 video walls instead of 1 and controlling systems of 2 monitoring desks instead of 1 desk, are acceptable when duration is limited.
Workload desk 3: 07.30 - 08.30 uur rush hours with disturbances (pile-up in tunnel) with support by traffic manager desk 1
60
50
40
30
OWAT-weging
20
10
0
07:30
07:35
07:40
07:45
07:50
07:55
08:00
08:05
08:10
08:15
08:20
08:25
08:30
tijd
Figure 3. Workload for traffic manager during rush hours with disturbances (desk 3)
In Table 3 results of workload calculation per tunnel monitoring desk during rush hours without disturbances and during rush hours with disturbances are shown. Also staffing is shown in this table.
Table 3: Workload and staffing for several monitoring desks – current situation Rush hours WITHOUT disturbances Rush hours WITH disturbances
FUTURE TRAFFIC MANAGEMENT CONTROL ROOM OF THE CITY OF AMSTERDAM Development of future scenarios
Definition of future scenarios was principally based on progress in development of new tunnels in the city of Amsterdam during the period 2014 tot 2018. Question was whether current staffing of the traffic management control room could monitor these new tunnels and safeguard tunnel safety in these tunnels.
First step in detailing future scenarios was again investigating historic data with special scope of possible simultaneous occurrence of occasions, which require action of a traffic manager. Together with the project team an estimation about future possible simultaneous occurrence was made, based on trends in traffic growth in the city of Amsterdam and based on trends in historic data mentioned.
Second stop was to describe of developments on several fields of interest, regarding the work organization of the traffic management control room, modernization and expansion of tunnel installations, changes in tunnel safety and control systems (from analog to digital control), expansion of the areal of traffic management equipment throughout the city. Also collaboration with other traffic management control rooms of other parties was considered.
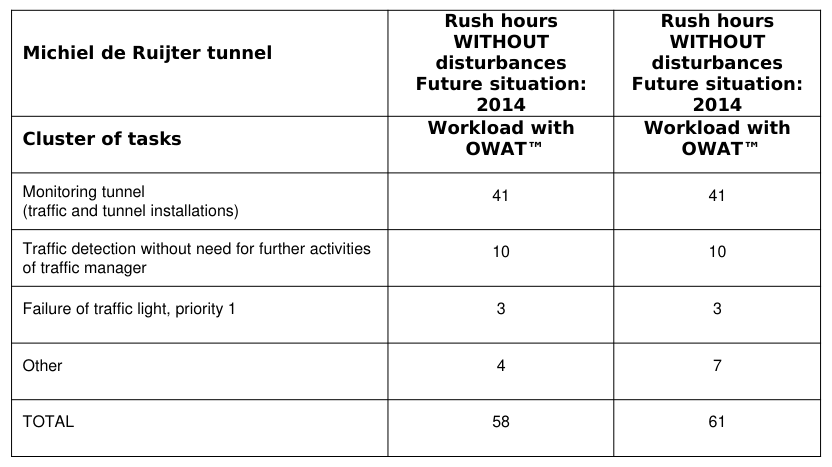
Third step was to project results of first two steps on each new tunnel in order to determine impact of commissioning of these tunnels during the period of 2014 till 2018. Results were translated in most likely occurrence of clusters of tasks as defined earlier in the project (Table 2). In this step per new tunnel workload calculations were made for again 2 situations: rush hours without disturbances and rush hours with disturbances. Table 4 shows results of workload calculation related to commissioning of the new Michiel de Ruijter tunnel in 2014.
Fourth step was to assess implications of results of step 2 for current tunnels (current desk 1 and current desk 3) and traffic management (current desk 2).
Table 4: Workload related to commissioning of new Michiel de Ruijter tunnel – future situation 2014
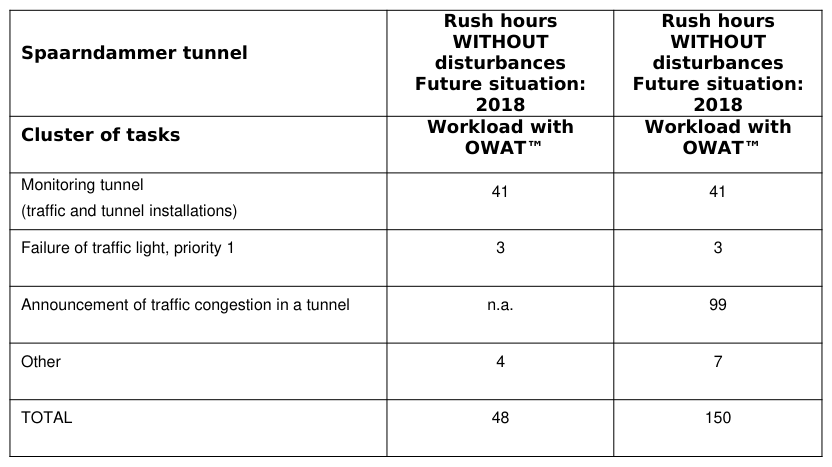
Table 5 shows results of workload calculation related to commissioning of the new Spaarndammer tunnel in 2018.
Table 5: Workload related to commissioning of new Spaarndammer tunnel – future situation 2018
Assessment of workload in future scenarios In order to assess workload per monitoring desk in several future scenarios next step in the design process was to investigate which current monitoring desk from the perspective of workload could handle a new tunnel. Special emphasis was on assessment of feasibility to monitor traffic in the several tunnels, which would be monitored by one traffic manager at one monitoring desk. Together with traffic managers, this combined monitoring of tunnels was explicitly modelled and scored with OWAT™.
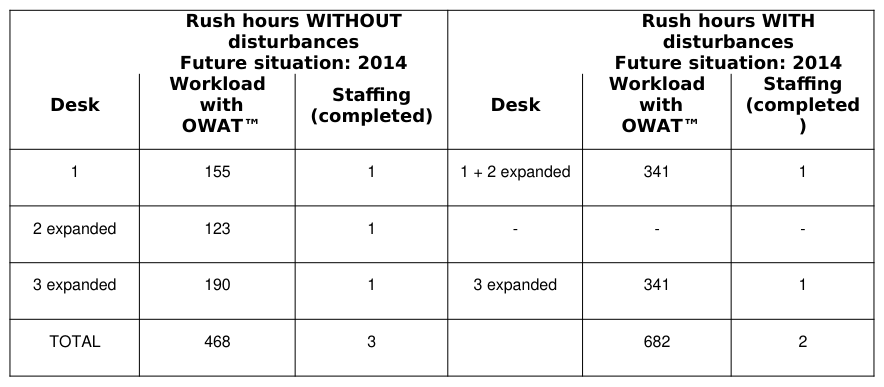
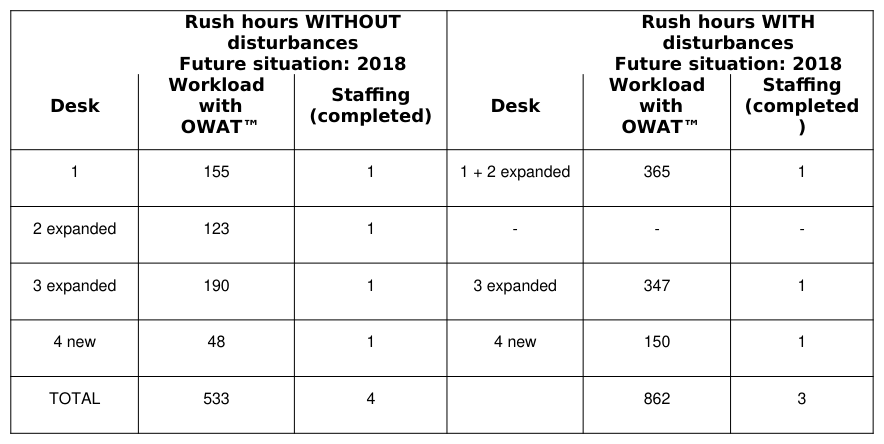
For rush hours without disturbances there was not a clear preference, which desk could handle one new tunnel or even both new tunnels. But during rush hours with disturbances, there was a clear preference, based on the chance of long lasting mental overload and the chance of peak load. Conclusion was that the first new tunnel, commissioning foreseen in 2014, could easily be integrated on the current traffic management control room on currently available desks. For commissioning of the second new tunnel, as foreseen in 2018, an extra monitoring desk would be necessary. Table 6 and Table 7 show the results of the calculations for the chosen future scenarios.
Table 6: Workload and staffing for several monitoring desks – future situation 2014 Rush hours WITHOUT Rush hours WITH disturbances Future situation: 2014 disturbances Future situation: 2014Table 7: Workload and staffing for several monitoring desks – future situation 2018 Rush hours WITHOUT Rush hours WITH disturbances Future situation: 2018 disturbances Future situation: 2018
Also, both the future situation of 2014 and the future situation of 2018, it should be noted that staffing during situation with disturbances is smaller than staffing during situation without disturbances. Limitations and preconditions for acceptability of this smaller staffing during disturbances are the same as described for the current situation. Workload for desk 4, especially in situation without disturbances but also in situation with disturbance, will be very low so under load will be likely. The management of the traffic management control room considers this as an opportunity for higher ambition in traffic management across the city of Amsterdam.
Because of the nature of the traffic managers job in the traffic management control room, long lasting workload is not the only relevant factor for calculation of staffing. Peak load can be so demanding that extra staffing can be necessary. Based on patterns in workload during rush hours with disturbances in the current situation, see Figure 3, together with participating traffic managers an assessment of ‘spare capacity’ for peak load is made. Rules of prioritization in performance of activities and possibilities for collaboration between traffic managers of the several desks can be used to decrease peak load. When doing so, first conclusion of this assessment was that in future situations peak load can be handled. Second conclusion was that there would be enough spare capacity for handling events additional to clusters of tasks modelled for future situation as mentioned in Table 2.
Future traffic management control room A schematic layout of the future traffic management control room was designed, based on the chosen scenario, see Figure 4. The figure shows the layout for the situation of 2018, when the new Michiel de Ruijter tunnel (commissioning in 2014) and the new Spaarndammertunnel (commissioning in 2018) are ready.
Monitoring and traffic management of the new Michiel de Ruijtertunnel is assigned to desk 3, a currently existing desk, but with expanded number of tunnels under its responsibility. Workload calculations showed that this assignment to desk 3 is valid for de situation of 2014 as well as the situation of 2018.
Monitoring and traffic management of the new Spaarndammer tunnel is assigned to a new desk, desk 4, because workload on other desks was to high to integrate the new tunnel on these desks. Also other ergonomic aspects, like ergonomic quality of the design of a desk, and number of displays on the videowall, were reason to decide for a new desk 4.
Special attention was paid to collaboration between traffic managers on several desks. In 2018 there will be a corridor for traffic near the city center of Amsterdam, and traffic manager of desk 2, 3 and 4 will manage this corridor. Because workload calculation for desk 4 showed that there is spare capacity for a higher ambition in traffic management, desk 4 is placed right next to desk 2, the desk with focus on traffic management through the city of Amsterdam.
Figure 4. Schematic lay-out of the future traffic management control room
Figure available in the original PDF paper.
CONCLUSIONS
Traffic managers in the project team agreed with the results of workload assessments with OWATTM in both cases described. The highly participative way of assessment of workload was appreciated. They recognized their own job in the assessment, in contrast with earlier assessment of workload with a far more limited tool based on frequency of occurrence of observable psycho-motoric activity. OWAT™ emphasizes cognitive activities, which better suits monitoring tasks in control rooms.
The OWAT™ assessment made it possible to point out the bottlenecks in workload and relate them to certain circumstances. Also various future scenarios could be suggested, using the description of the cases, the numerical calculations and the graphical representations of workload, resulting from an OWAT™ assessment. Results also showed that there was an opportunity for a higher ambition in traffic management in the city of Amsterdam. This was against expectations at the start of the project, but the results of the assessment were clear and there was full support of all traffic managers for the results of the assessment.
REFERENCES
Bierbaum, C.R., Szabo, S.M., Aldrich, T.B. (1989). “Task Analysis of the UH-60 Mission and Decision Rules for Developing a UH-60 Workload Prediction Model”, Fort Rucker U.S. Army Research Institute for the Behavioral and Social Sciences, Breed, I. (2008). “Mentale Werkbelasting voorspellen: het VACP-model”, Utrecht: Intergo bv, confidential Embrey, D., Blackett, C., Marsden, P., Peachey, J. (2006). “Development of a Human Cognitive Workload Assessment Tool”,
Lancashire: Human Reliability Associates Hamilton, W.I., Boughton, J. (2004). “A Theoretically Coherent Workload Prediction Technique”, Bristol: Human Engineering Ltd Kahneman, D. (1973). “Attention and effort”, New York: Prentice-Hall McCracken, J.H., Aldrich, T.B. (1984). “Analysis of selected LHX mission functions implications for operator workload and
system automation goals”, Alabama: Anacapa Sciences, INC. Military programs Pickup, L., Wilson, J. R., Norris, B. J., Mitchell, L., Morrisroe, G. (2005). “The Integrated Workload Scale (IWS): A new selfreport tool to assess railway signaller workload”. Applied Ergonomics , 36, 681-693. Portney L.G., Watkins M.P. (1993). “Foundations of Clinical Research. Applications and Practice”, Appleton & Lange,
Norwalk, Conneticut ISBN 0-8385-1065-5 p. 509-516. Prins, E. (2009), “Ontwikkeling van een generiek meetinstrument voor mentale werkbelasting: OWAT”, Utrecht: Intergo bv, confidential Rueb, J.D., Vidulich, M.A., Hassoun, J.A. (1994). “Use of Workload Redlines: A KC-135 Crew-Reduction Application”,
International Journal of Aviation Psychology, 4, 47-64 Sarno, K.J., Wickens, C.D. (1992). “Predictive Workload Models and Multiple-task Performance”, Proceedings of the Human Factors and Ergonomics Society Annual Meeting October 1992, 36, 12-16 Schuck, M.M. (1996). “Development of equal-interval task rating scales and task conflict matrices as predictors of attentional
demand”, Ergonomics, 39, 345-357 Vidulich, M.A., Ward, G.F., Schueren, J. (1991). “Using the Subjective Workload Dominance (SWORD) Technique for Projective Workload Assessment”, Human Factors: The Journal of the Human Factors and Ergonomics Society, 33: 677- 691 Wickens, C.D. (2002). “Multiple resources and performance prediction”, Theoretical Issues in Ergonomics Science, Volume 3,
2, 159-177 Weeda, C.E., Zeilstra, M.P. (2013). Prediction of mental workload of monitoring tasks. In: Nadashi, N., Scott, A., Wilson, J.R., Mills, A., Rail Human Factors Supporting reliability, safety and cost reduction, Proceedings of the Fourth International Conference on Rail Human Factors, London (pp 633-640), London: Taylor & Francis Zeilstra, M.P., de Bruijn, D.W., van der Weide, R. (2009). Development and implementation of a predictive tool for optimizing
workload of train dispatchers. In J.R. Wilson, A. Mills, T. Clarke, J. Rajan, N. Dadashi (Eds), Rail Human Factors around the World, Impact on and of People for Succesful Rail Operations, Proceedings of the third European Conference on Rail Human Factors (pp 444-453), London: Taylor & Francis.
LISTED IN THE AHFE DIGITAL BOOKSTORE CATALOGUE
Explore the complete digital volume
Advances in Human Aspects of Transportation: Part III
Read this individual research paper free through the original publisher, or explore the full digital proceedings book.
ISBN 978-1-4951-2099-2
Explore this ISBN in the AHFE Bookstore ↗Listed in the July 2026 bookstore catalogue; search by ISBN to confirm current availability · Digital book purchase optional