Alessandro Soroa, Sabine Wollstädterb, Andry Rakotonirainya (2021). Advanced In-Vehicle Applicationsto Mitigate Driver Aggression. In: Advances in Human Aspects of Transportation: Part II. AHFE Open Access, vol. 16. https://doi.org/10.54941/ahfe100698
Aggressive behavior at the steering wheel has been indicated as a contributing factor in a majority of crashes and anger has been compared to alcohol impairment in terms of probability to cause a crash. It has been shown that being in a state of anger or excitement while driving can decrease the drivers’ performances. . This paper reports the evaluation of 6 novel design alternatives of In-Vehicle Information Systems (IVIS) aimed at mitigating driver aggression. Each application presented was designed to tackle the following contributing factors to driver aggression: competitiveness, anonymity, territoriality, stress as well as social and emotional isolation. The 6 applications were simulated using computer vision algorithm to automatically overlay the real traffic conditions with ‘Head-Up Display’ visualizations. Two applications emerged over the others from participant’s evaluation: shared music combined the known calming effect of music with the sense of sympathy and intimacy caused by hearing other drivers’ music. The Shared Snapshot application provided an immediate gratification and was evaluated as a potential prevention of roadside quarrels. The paper presents Theoretical foundation, participant’s evaluations, implications and limitations of the study.
Aggressive behavior at the steering wheel has been indicated as a contributing factor in a majority of crashes (AAAFoundation.org, 2009) and anger has been compared to alcohol impairment in terms of probability to cause a crash (Cook, Knight, & Olson, 2005) . It has been shown that being in a state of anger or excitement (as opposite to a neutral mood) while driving can decrease the drivers’ performances (e.g. (Cai, Lin, & Mourant, 2007)). The development of in-vehicle applications aimed at preventing aggressive driving is on its infancy, and generally involves the adoption of advanced in-Vehicle information Systems (IVIS) to provide the driver with socially relevant information, calming messages, entertainment. More details are provided further on in the paper; the design approach of such new IVIS is changing too, moving towards a more user centered approach (Cardoso & Clarkson, 2012; Gellatly & Hansen, 2010; Lindgren, Chen, Amdahl, & Chaikiat, 2007), and hence emphasizing the need to evaluate early prototypes, test alternatives, and observe actual performances (Marcus, 2004). However, evaluating early prototypes of automotive user interfaces involving real users in real contexts, which is a core practice of evaluating interaction design, is difficult to apply. Hence, most (if not all) of the above examples have been evaluated in laboratory studies, often supported by a driving simulator system. Very little is found in the literature on how to deploy and evaluate such concepts in a realistic (if not real) driving situation. Using a naturalistic driving setting to introducing a new, experimental technology raises the topic of risk management in a context in which the life of the user is at stake.
This paper reports on the evaluation of 6 novel design alternatives aimed at mitigating driver aggression and the methodological approach that was applied in the evaluation. Each application presented was designed to tackle one or more of the main contributing factors of driver aggression: competitiveness, anonymity, territoriality, stress as well as social and emotional isolation. Definitions and the rationale for each design alternatives are presented in the relevant sections. The methodology for evaluation was aimed at combining some of the advantages of a naturalistic driving study with the safety and predictability of a driving simulator environment: participants were asked to drive an instrumented research vehicle through several suburbs/traffic conditions. Real frustrating events from their test drive were captured on video and later re-played in a driving simulator, where early prototypes of the applications described here could be deployed and tested.
Predicting and Mitigating Driver Aggression In a recent survey 50% of drivers admitted to have verbally abused another driver; remarkably 82% of them felt such act to be justified (AAMI, 2011). Driver aggression can take many forms; while larger majority of cases consist of mild aggression (such as verbal abuse, obscene gestures and tailgating), up to 18% of motorists reported severe aggressions, e.g. having been chased, run off the road, or assaulted (Soole, Lennon, Watson, & Bingham, 2011). Yet, it is difficult to estimate how aggressive driving contributes to crashes. This is partly due to a lack of consistency in the use of terms such as driver aggression, hostile or angry driving and road rage (Dula & Geller, 2003). The repertoire of behaviors that have been labeled as aggressive driving is just as wide, and spans from honking and flashing headlights to using the vehicle as a weapon to attack and possibly kill another road user (Soole et al., 2011). Several factors have been found to elicit episodes of driver aggression: personal factors such as age, sex, competitiveness and sensation seeking; as well as situational factors such as isolation, anonymity, previous states of anger or stress, road congestion and time pressure (O’Brien, Tay, & Watson, 2004; Soole et al., 2011). Furthermore, the physical and psychological distance between drivers makes it difficult to manage emotional arousal (Deffenbacher, Lynch, Oetting, & Swaim, 2002). It has been observed, that, the obstruction caused by the vehicle design blocks any attempt to express irritation, solicit and apology or even the attention of the supposedly offending person after a frustrating incident or episode (Parkinson, 2001). On the contrary, cars and their immediate surrounding have been demarcated as the driver’s own territory (Fraine, Smith, Zinkiewicz, Chapman, & Sheehan, 2007), potentially defended by occupants or owners (Altman & Chemers, 1980).
Anger, when articulated, is an important component of social interaction; it has the function of soliciting cooperation or apology from a supposedly offending person, or to direct accordingly the blame of onlookers. In face to face interaction, anger typically cools down as soon as an acknowledgment is received (Parkinson, 2008). In the car, attempts of expressing anger and receiving feedback or apology are limited: social cues such as voice tone or face expressions are unavailable unless overly exaggerated, and cannot promptly reach other drivers. Similarly, the offending driver will only receive over-amplified expressions of anger. Such disproportion and the lack or delay of feedback exacerbates issues of anger (Parkinson, 2001), as a result, anger at the steering wheel is experienced more often and more intensely than in face to face interactions. Lupton has further observed how people tend to de- humanize other drivers, often referring to them as ‘machines’ (Deborah Lupton, 1999). Cars provide to the driver and passengers a protective and personal armor, which Leckie and Hopkins referred to as ‘semiprivate metal containers’ (Leckie & Hopkins, 2002). Marketing strategies have often insisted on such concept, presenting cars as an extension of the self or a member of the family (D. Lupton, 2002; Deborah Lupton, 1999).
The sense of social and emotional isolation that drivers experience has also been connected to aggressive and anti- social driving. Social and emotional skills seem to be compromised or obstructed when driving: for example a majority of drivers regard themselves as less risky and more skillful of the average fellow driver (Svenson, 1981). Despite this, drivers struggle to re-establish a channel of social communication, and invent means of exchanging non-verbal cues, using those tools that they have at hand: headlights, hazard lamps, blinkers, and of course, hand gestures, in what Renge has dubbed ‘roadway interpersonal communication’ (Renge, 2000).
There is evidence that such interpersonal communication can be mediated and augmented by means of proper technology capable of visualizing for example other drivers’ emotions, goals and attention could discourage aggressive behaviors. Previous research has demonstrated that perceiving the eye gaze of other drivers, represented Human Aspects of Transportation II (2021) with digital avatars could promote a pro-social behavior (Rakotonirainy, Feller, & Haworth, 2009). Studies exist that explore the feasibility of automatically sensing and sharing the emotional state of the driver with other road users (Schroeter, Soro, & Rakotonirainy, 2013), or the possibility of visualizing common interests and similarities based on social media profiles (Mitrevska, Castronovo, Mahr, & Müller, 2012). Furthermore, several solutions have been proposed to prevent or mitigate driver aggression by means of specially designed In-Vehicle Information Systems (IVIS). The scope of intervention includes for example inducing a re-appraisal of potentially frustrating events (e.g. (Harris & Nass, 2011)), adapting the interface to the mood of the driver (e.g. (Jonsson, Nass, Harris, & Takayama, 2005; Nass et al., 2005)), displaying additional information about other drivers’ intentions or behaviors (e.g. (Rakotonirainy et al., 2009)), exploiting gamification to break anonymity (e.g. (Schroeter, Rakotonirainy, & Foth, 2012)), exploiting the calming effect of music (e.g. (Wollstädter, Pfister, & Höger, 2013)). Some applications (see e.g. (Diewald, Möller, Roalter, Stockinger, & Kranz, 2013)) aim at simultaneously achieving the goals of (i) encouraging the adoption of a new technology and (ii) rewarding the achievement of a safety related goal, such as having a greener driving style, given that the distinctive features of a green driver (e.g. anticipating and planning ahead, smooth accelerations and braking, sensible choice of speed) can as well describe a safe driver (Young, Birrell, & Stanton, 2011). Such game-like applications have the advantage of being particularly attractive to the young driver population who are known to have higher crash rates (see e.g. ((Fitz-Walter, Tjondronegoro, & Wyeth, 2012)). Yet, the design and assessment of in-vehicle applications to mitigate or counteract driver aggression is in its seminal phase, and the possibilities of exploiting driver-to-driver interaction principles is a relatively new and unexplored territory.
Research Aim Our goal is to test whether drivers’ behavior intention can be positively affected by in-car systems and to identify potential design alternatives for future in-car communication systems. For this we follow a qualitative approach: after completing a naturalistic test drive and several questionnaires, participants evaluate certain design alternatives of future in-vehicle communication systems (countermeasures). The design alternatives, described below, derive ideas from different research disciplines (e.g. social media, gaming and education).
METHOD
Participants Eleven Participants participated in the study. However, the first two sessions were aimed to fine-tune the software and the method itself and were not included in the analysis. The demographics of the remaining nine participants are: 27,3% females, age from 23 to 58 with a mean of 34 years. All participants held a valid driving license and 36% drove to work in rush-hour traffic. Participants were recruited through mailing lists.
Material: Rationale and Description The design ideas presented below focus on the attempt to address the situational factors that could influence aggressive behavior, with specific emphasis on competitiveness, anonymity, territoriality, stress, social and emotional isolation. The applications have been evaluated following the methodology presented further on. The descriptions presented hereafter were actually read out to the participant before the driving simulator session. However, the underlying rationale for each application, described further down, was not presented to the participants.
Eco-Driving Reward: This application, illustrated in figure 1, comprises the idea that drivers would earn ‘green leaves’ when they drive fuel-efficient. Thus, a green and eco-friendly driving state would be achieved by saving fuel (e.g. by slowing down and avoiding sharp accelerations/braking). More leaves would indicate a more eco-friendly driver. In this case the car would be fitted with an appropriate device capable of gathering the relevant data from the on board GPS and car electronics and of scoring the performances of the driver: for example calculating the saving with respect to average fuel consumption for the specific type of road. The leaves could be visualized using a special projection on the windscreen (Head Up Display).
Driving-Behavior Badges: In this example application, illustrated in figure 2, drivers would earn a ‘color badge’ Human Aspects of Transportation II (2021) based on their behavior on the road: a green badge would indicate a good driver, a red badge would point out a bad one (e.g. one that ignore speed limits, doesn’t keep safe distances, etc.), an amber badge would indicate an ‘average’ driver (e.g. one that has received both good and bad votes). Such badges would be assigned on the basis of a ‘social’ score system. Each driver would have the opportunity to ‘vote’ other drivers’ performances, either good or bad, on the road. Each individual score would be an average of the votes received. Every car could have a button on the steering wheel that could be hit to assign a vote to another driver nearby. All the votes would then published and shared among all drivers. The badges could be visualized using a special projection on the windscreen (Head Up Display).
Shared Emotions: The following example allows the drivers to share their emotional states; it is illustrated in figure 3. This application would be one way to break the isolation between cars driving in close proximity. Drivers will be able to share their emotional state with other drivers nearby. The emoticons would be similar to the ones, which drivers may already use in digital communication (e.g. Chatting via Skype or Facebook, text messages, email). The visualization could be through a Head Up Display, i.e. overlaying graphics to the real street view.
Shared Music: Drivers perceive their car as a private and solid shield. However, the reality is that drivers, as users of the same road, are actually using a public space. This could be made explicit by adding the opportunity to share the music they are listening to with other drivers nearby. Every driver would have the option to tune in the music offered by others or not, while at the same time sharing his/her own music. This would be similar to sharing music with friends e.g. via Spotify or other music sharing social networks. The in-car entertainment system would be able to alert the driver when other drivers nearby want to share their music. This application is depicted in figure 4.
Shared Chat: In this scenario drivers would have the opportunity to talk to other drivers’ nearby/in close proximity, as illustrated in figure 5. The conversation could be one to one or could involve many drivers. Drivers would have the option of keeping the conversation private (e.g., talking being in a private space) or to leave the conversation open (e.g., chatting in the corridor). Other drivers could then enter a conversation, just as it happens in face to face encounters. If a car is nearby a in-car application would indicate whether other drivers are having a conversation or not. The application would also indicate whether a conversation is open or private respectively whether other drivers are open for a conversation.
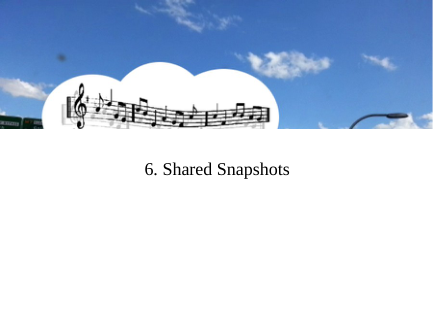
Shared Snapshots: This application would give drivers the opportunity to share (frustrating) scenes or pictures from (frustrating) driving events with their friends (e.g. on Facebook). It would be the choice of the drivers to share their annoyance virtually with their social network instead of using the horn to express their irritation or anger. The car could be fitted with a camera and a device capable of taking a picture and posting it together with a predefined dislike statement (e.g. a button on the wheel next to the honk to operate the system taking the picture and sending it seamlessly). The application is represented in figure 6.
Rationale Socially inspired gamification techniques, represented in Applications 1 (Eco-Driving Reward) and 2 (Driving- Behavior Badges) leverage people’s natural desires for achievement, managing to direct the driver’s competitiveness towards a safe goal (gaining eco-driving rewards or driver-behavior badges). Hence the hypothesis that a carefully designed gamified IVIS could provide an incentive towards a safe behavior, and, at the same time, provide visual feedback on other drivers’ score (i.e. usual behavior).
Applications 3 (Shared Emotions), 4 (Shared Music) and 5 (Shared Chat) have been designed to address the sense of isolation, making visible and audible the presence, goals and emotions of other humans on the cars nearby. While they are similar to each other in how they try to create a shared information space to overlay the physical space, the 3 applications articulate different key concepts. Shared Emotions aims at fostering a sense of empathy towards the other road users, and at the same time allows the driver to express his or her own feelings, whether positive or negative, thus fighting the sense of emotional isolation. Shared Music tries to reduce stress building on the calming effect of music (Wollstädter et al., 2013, Wiesenthal, Hennessy, & Totten, 2003, van der Zwaag & Fairclough, 2011). Shared Chat aims at providing a channel for casual conversation, such as the generally polite and peaceful negotiation of the shared path that is common between pedestrians. Both Shared-Chat and Shared-Music expose the private space of the car to the influence of other road users, thus breaking anonymity and territoriality.
1. Eco-Driving Reward 2. Driving-Behaviour Badge
3. Shared Emotions 4. Shared Music
5. Shared Chat 6. Shared Snapshots
Figure 1: In-vehicle application to mitigate driver aggression
Finally, Application 6 (Shared Snapshots) is designed to provide the drivers with a mean of expressing their anger or irritation that is less prone to escalating or result in an open conflict. The action of exposing the offending behavior to friends and personal contacts could provide an immediate gratification, and replacing the need of aggressively seeking further apology from the offender. On the other hand, evidence exists that the presence of other people in the car is a deterrent to risky driving (Fleiter, Lennon, & Watson, 2010); this application explores the possibility to exploit the virtual presence of friends to remove the sense of isolation.
Procedure, Apparatus and Measures The study consisted of two parts: First, participants drove a naturalistic drive in a CARRS-Q research vehicle which Human Aspects of Transportation II (2021) was equipped with video recording devices. The naturalistic test drive was to identify frustrating driving incidents, which were experienced in a real driving situation for each participant and which were used as video footage for the second part of the study. The predefined test drive comprised specific segments of different predictable difficulty (e.g. standing in the parking area; exiting the parking ramp; city driving; residential areas; merging into traffic; driving in the CBD). For the entire duration of the test drive, which took approximately 45 minutes, a researcher sat on the back seat and did annotate frustrating events (e.g. merging conflicts, high traffic with weaving car in front etc.). Participants were asked to refrain from using radio or mobile phone, and to strictly obey traffic rules. Prior to the test drive informed consent was completed and each participant agreed to be video recorded and completed a questionnaire to assess the demographic.
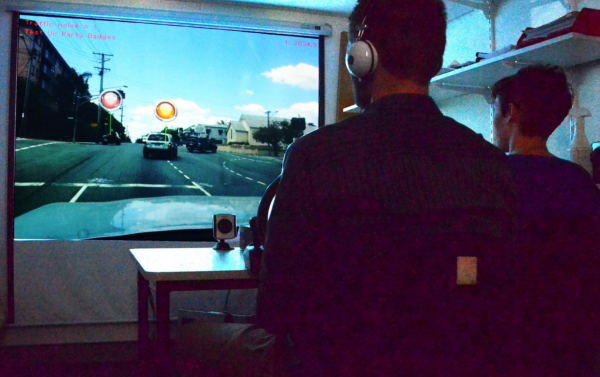
The second part took place in a SCANeRTMstudio driving simulator, which was located in the CARRS-Q laboratory, Brisbane, Australia. The driving simulator was equipped with steering wheel, foot pedals and headphones for replaying traffic noise and with one projector which presented the traffic situation onto one wall screens with a 60° field of view. This second part of the study aimed to discuss the above-described six in-vehicle applications and lasted approximately 40 minutes. The 6 applications were simulated using computer vision algorithms to automatically render the HUD visualizations on top of the real traffic conditions and were presented in a random sequence for each participant. Figure 2 shows a snapshot from an evaluation session: the participant (left) seats at the steering wheel of the driver simulator. Although no steering is actually possible, he gets an immersive sense of the traffic conditions thanks to the large display and headset. The operator (right) controls the simulation choosing which one of the six applications to display, deciding the appropriate badge to assign the ‘offending’ car, and selecting the appropriate background noise and sounds. The researcher (not shown) takes a seat at the left of the participant and moderates the evaluation, requesting detailed comments when necessary.
Figure 2: Recreating stressful conditions and evaluating the applications in the driving simulator As said above, the second part followed directly after participants finished their test drive. A short interview was conducted after the driving session in order to agree with each participant on a specific event, which occurred during the test drive and had been a cause of irritation. Often the video footage was rapidly reviewed to help the participant recall the event, or to re-evoke the sense of irritation experienced. Each participant was then asked to rate the base level of anger, irritation and calmness experienced during the selected event (see Table 1) on a 7-point scale from 1 ‘not at all’ to 7 ‘very much’. In total seven ratings where completed throughout the study (base level plus 6 applications).
Then, in turn, the 6 applications were presented in a randomized order, replaying the video sequence of the selected event, enriched with the video/audio augmentation. To this purpose an interactive software emulator was implemented capable of recognizing in real time the cars in the video footage via a cascade classifier of Haar-like features (Viola & Jones, 2011) and of following such cars frame to frame by means of optical flow analysis. During the evaluation, an operator can chose what visual elements (e.g. smileys, green leaves) will be added to the scene, to which car(s) and when. The operator has also the possibility to choose among several background noises (light traffic, normal traffic, traffic congestion) and sound tracks (music, chatter) to be played in the headset. After participants evaluated all applications they received a reimbursement of AUD25 for their participation.
Table 1. Participants‘ evaluation of the 6 applications
Table available in the original PDF paper.
Participant
Shared Music Shared Chat Shared Snapshot Base Eco-Driving
9 2 2 6 -1 0 1 0 0 0 1 1 -1 -1 -1 1 -1 -1 1 0 0 0 Mean 2,33 3,89 4,11 0,11 -0,6 0,44 -0,1 -0,7 0,56 0,43 0,44 -0,4 -0,1 -0,9 1,11 0,22 0,11 -0,4 -0,2 -0,8 0,44 Note: Subjective ratings for emotional experience: A (Anger), I (Irritation), C (Calmness). Ratings are measured on a 7-point scale. Gain scores (D = Y2 − Y1) were calculated as indicator of mitigation of driver’s frustration. Lower values: Less anger, irritation and calmness; Higher values indicate more anger, irritation and calmness.
RESULTS
Qualitative and Quantitative analysis were conducted. First, audio recordings of the qualitative interview were transformed in written transcripts. Excerpts from the interviews, which are used describing the results, are at the level of whole sentences or paragraphs.
Second, quantitative data was prepared using Microsoft Excel. Subjective ratings of anger, irritation and calmness were analyzed as indicators of driver’s frustration. Gain scores (D = Y2 − Y1) were calculated. For example, Participant 1 (see Table 1) gave the following ratings for anger “4”, irritation “6” and calmness “2” (on a 7-point- likert scale). Differential values (gain scores) where then calculated for each application to have an indicator for the mitigating effect of driver’s frustration when confronted with each application prototype (Difference = Application- Rating – Base-Rating). For example, the sense of irritation was slightly lower for participant 1 when the simulation of Application 1 (Eco-Driving Reward) was applied to the frustrating driving scene (see Table 1 first column: I = - 1); There was no change for anger and calmness for this participant evaluating the Eco-Driving Reward application. Thus, we follow that for this participant there isn’t a valuable mitigating effect for driving frustration when the Eco- Driving Reward-Application was applied. On the other hand, when the application Shared Snapshot was applied higher changes where observed (see Table 1). The ratings for each application were also measured on a 7-point- likert scale. For each participant the subjective evaluation of anger, irritation and calmness, with and without intervention, are reported in Table 1. Further on, the subjective evaluations are commented with the help of excerpts from the interviews.
Eco-Driving Reward and Driving-Behavior Badge Of the other 4 applications, Eco-Driving Rewards and Driver-behavior Badges were given analogous evaluations: The effect on irritation was scored positive but modest by 5/9 Eco-Driving Rewards and by 4/9 participants respectively for the Driver-Behavior Badge. The effect on calmness was rated positive by 3/9 for Eco-Driving Rewards and by 2/9 participants for Driver-Behavior Badge. The effect on anger though was uncertain, with some participants feeling a minor improvement and other rating a smaller increase of anger. Analogously to the Snapshot, when commenting on the application Driving-Behavior Badge participants stressed on the risk of abuse, but also highlighted the advantages of giving and receiving feedback on driving behavior, with the dual advantage of expressing irritation and visualizing other driver’s reputation, allowing to take extra precautions.
P01: “A lot of people would just use the bad and they'd use it for everybody. Or (...) use it too much and not enough would use the good. (…) I'd have my finger like over the red button all the time.”
P06: “If they do something wrong you can punish them, in a way, by voting down. (..) well, mostly it is kind of a way to make my frustration known and then it might take it off my chest.”
P02: “Yeah I think that one has some validity, in terms of… like you're getting continuous… like live feedback to someone's performance, which is really quite useful.”
P09: “I don't think it would change the way I felt (…) it would make me more careful depending on the rating that they had” Shared Music
The application Shared Music emerges as the preferred one, in terms of its capacity to mitigate irritation (6 out of 9 participants) and improve calmness (5/9). In absolute terms, the presence of music has the higher (positive) impact on the sense of calmness (+1.11 on average) and on irritation (-0.89 on average). Even though the effect on anger is moderate 3 participants reported a small positive effect, 3 reported no effect at all, while 3 reported a slight increase of anger.
This effect resulted from the qualitative analysis, too: All participants agreed on the calming effect of music, and some agreed on the potential of such application of breaking the shield of anonymity.
P02: “I like the fact that you'll be sharing a space with someone, rather than being isolated from them.”
P04: “I think music is a great way to modify people's emotional experiences. (..) And it's a way of communicating where you know it doesn't have to get too personal about anyone who might be annoying you.”
P09: “It’s a way of associating a personality with some feature of that person.”
However, several participants were critical towards to risk of being forced to share music that they would not like, or anticipated a negative appraisal of other drivers based on their taste in music.
P01: "I can just see myself getting really angry all the time listening to everyone else’s choices, probably irritated as well [...] the odds are probably gonna get more people listening to stuff you don’t like [...] I probably wouldn’t cos’ I like to listen to my stuff.”
P06: “Since the other driver has a decent taste in music I guess I’m most likely to sympathize with him if we have something in common. If he was playing (…) then it might get on my nerves.”
Shared Emotions and Shared Chat The applications Shared Emotions and Shared Chat on the other hand were reported to have a negative effect on all three dimensions, and hence to have potentially the effect of escalating anger and irritation.
This is represented in the interview comments, too. The attempts to support emotional reciprocity through a visualization of drivers’ mood in Shared Emotions proved the more difficult and less effective. Specifically, the effect of humanization provided by the smileys superimposed on the scene doesn’t appear to counteract, in general, the irritation caused by the driving conflict.
P01: “He knows he's cranky and he's still driving like an idiot, which is pretty terrible.”
P01 “[I feel] Probably more irritated (…) I'm gonna really wanna avoid them because they've made an effort to show the world that they're cranky or upset or whatever” P02: "If they’re angry and they pull out in front of you, I think that would make me angry as well.”
P08: “If I see something (…) that says that that driver is very irritated then I would be equally irritated.”
P09: “I would assume that the motivation was because he was angry that he was paying less attention to other people, or taking advantage of them.”
Shared Snapshot The application Shared Snapshots was rated to positively impact irritation by 4/9 and improved calmness by 3/9 participants. Again the effect on anger was moderate according to the subjective ratings.
Taking the qualitative data into account, the aspect of socially rating other drivers’ behavior received (sometimes strongly) contrasting evaluations. The application Shared Snapshots was understood as a way of taking immediate revenge on another drivers’ actions.
P01: “That's actually brilliant, because it's [immediate] gratification and naming and shaming. That this guy is an idiot and everybody gets to see, which is fantastic!”
P03: “A bit like name and shame isn't it? I wouldn't like somebody doing it to me [...] seeing lots of that on my Facebook, with other people doing it.”
DISCUSSION AND CONCLUSION The aim of this study was to identify potential design alternatives for future in-car communication systems aimed at mitigating driver aggression. Focusing on 6 design alternatives we have invited several drivers and potential users to evaluate if/how their behavior, mood and feelings towards other drivers could be influenced.
Our results indicate that a potential benefit could come from advanced IVIS in terms of reducing driver aggression. Confirming related research, music is an appropriate means to reduce driver’s anger in frustrating driving events. Our contribution additionally shows that such channel can be further exploited to break the sense of isolation and territoriality, as was the aim of the Shared Music Application. Yet, several conflicting points of view emerged, especially from the qualitative analysis, which suggests that no one single application could be developed to solve the problem of aggressive driving. We summarize below some criticalities that were evidenced.
Behavior versus Feelings: it could be argued that an application aimed at reducing driver aggression should have the dual goal of (i) improving the mood of the driver, and (ii) encouraging a safer driving behavior. Shared Music had a largely positive impact on feelings, but the participants wouldn’t change their driving behavior when using it. On the other end, Shared Emotion was rated to have a negative impact on feelings, causing the participant to reciprocate the other drivers’ bad mood. In this case however participants consistently declared that they would give more space from another driver, were his/her bad mood visible. Answering whether the two goals (safety vs feeling) could be conciliated is out of scope for this study. Our contribution indicates that different users react differently to a same application, suggesting, once more, that no one application, but rather a choice or combination of applications, can positively address the problem.
Territoriality: breaking the sense of territoriality proved to be extremely difficult, and several participants resisted strongly to the idea of a possible intrusion. While sensible differences could exist between age groups in this respect, given e.g. the different attitude towards social networking sites manifested by younger users, yet most of the applications failed in leveraging a sense of being in a public space when driving.
User Acceptance: participants were often suspicious regarding the introduction of new devices in the car. Again, there may be expected important differences between age groups, that this study was not designed to capture. Yet table 2 evidences strong differences between drivers that reported sensible differences when, either in positive or in negative, when using the applications (e.g. P04) and drivers that starting from the base evaluation reported ‘ideal’ values of total calmness and no anger/irritation (e.g. P07) or simply didn’t notice any significant chance when using the applications (P05). If both positions are legitimate and there’s no reason to attribute them to an excess of enthusiasm or hostility, yet such contrast seems to reveal a methodological issue that designers are likely to face during evaluation.
Driver Distraction, together with speed, alcohol, fatigue and unfastened seat-belts, is a major issues, and the cause of a large proportion of on-road fatalities. Distraction was intentionally left out of the study, that aimed instead at assessing which ones (if any) of the 6 applications were worth investigating further and why. Evaluating the potential distraction of IVIS is of paramount importance, and the distraction caused by some of the applications was underlined by several participants. The problem was exacerbated by the imperfections of the prototype implementation. However, it is clear that any added information layer (such as the visual overlay given by a HUD) adds to the cognitive burden of the driver; yet, striking the balance between the cognitive cost and the safety benefit was out the scope this study.
This study has implications for companies interested in improving car safety. Recently, automotive industry has started to examine the influence of in-vehicle communication on aggressive driving. In particular, they are interested in understanding how individuals can be influenced by in-vehicle communication systems to decrease maladjusted driving behavior. The points raised above are open questions that this study helped to focus, and will be the aim of future work.
REFERENCES
AAAFoundation.org. (2009). Aggressive Driving: Research Update. AAAFoundation.org. AAMI. (2011). Annual Road Safety Index. Melbourne, Australia: AAMI Ltd. Altman, I., & Chemers, M. (1980). Culture and environment. Brooks/Cole, Monterey, CA. Cai, H., Lin, Y., & Mourant, R. R. (2007). Study on driver emotion in driver-vehicle-environment systems using multiple networked driving simulators. In Proceedings of the Driving Simulation Conference North America (DSC’07). Cardoso, C., & Clarkson, P. (2012). Simulation in user-centred design: helping designers to empathise with atypical users.
Journal of Engineering Design. Cook, L. J., Knight, S., & Olson, L. M. (2005). A comparison of aggressive and DUI crashes. Journal of Safety Research, 36(5),
491. Deffenbacher, J. L., Lynch, R. S., Oetting, E. R., & Swaim, R. C. (2002). The Driving Anger Expression Inventory: a measure of how people express their anger on the road. Behaviour Research and Therapy, 40(6), 717–737. Diewald, S., Möller, A., Roalter, L., Stockinger, T., & Kranz, M. (2013). Gameful design in the automotive domain. In
Proceedings of the 5th International Conference on Automotive User Interfaces and Interactive Vehicular Applications - AutomotiveUI ’13 (pp. 262–265). New York, New York, USA: ACM Press. doi:10.1145/2516540.2516575 Dula, C. S., & Geller, E. S. (2003). Risky, aggressive, or emotional driving: Addressing the need for consistent communication in research. Journal of Safety Research, 34(5), 559–566. doi:10.1016/j.jsr.2003.03.004 Fitz-Walter, Z., Tjondronegoro, D. W., & Wyeth, P. (2012, November 5). Encouraging learners to drive using game elements and
smartphones. Proceedings of the 24th Australian Computer-Human Interaction Conference (OzCHI 2012). ACM. Fleiter, J., Lennon, A., & Watson, B. (2010). How do other people influence your driving speed? Exploring the “who”and the “how”of social influences on speeding from a qualitative perspective. Transportation Research Part F: Traffic Psychology and …. Fraine, G., Smith, S. G., Zinkiewicz, L., Chapman, R. L., & Sheehan, M. C. (2007). At home on the road? Can drivers’
relationships with their cars be associated with territoriality? Journal of Environmental Psychology, 27(3), 204–214. Gellatly, A., & Hansen, C. (2010). Journey: General Motors’ move to incorporate contextual design into its next generation of automotive HMI designs. … Conference on Automotive …. Harris, H., & Nass, C. (2011). Emotion regulation for frustrating driving contexts. Proceedings of the SIGCHI Conference on
Human …. Jonsson, I. M., Nass, C., Harris, H., & Takayama, L. (2005). Matching In-Car Voice with Driver State : Impact on Attitude and Driving Performance. In Proceedings of the Third International Driving Symposium on Human Factors in Driver Assessment, Training and Vehicle Design (pp. 173–181). Leckie, G. J., & Hopkins, J. (2002). The public place of central libraries: Findings from Toronto and Vancouver. The Library
Quarterly, 72(3), 326–372. Lindgren, A., Chen, F., Amdahl, P., & Chaikiat, P. (2007). Using personas and scenarios as an interface design tool for advanced driver assistance systems. Universal Access in Human- …. Lupton, D. (1999). Monsters in Metal Cocoons: `Road Rage’ and Cyborg Bodies. Body & Society, 5(1), 57–72.
doi:10.1177/1357034X99005001005 Lupton, D. (2002). Road rage: drivers’ understandings and experiences. Journal of Sociology, 38(3), 275–290.
doi:10.1177/144078302128756660 Marcus, A. (2004). The next revolution: Vehicle User Interfaces. Interactions, 11(1), 40. doi:10.1145/962342.962358 Mitrevska, M., Castronovo, S., Mahr, A., & Müller, C. (2012). Physical and spiritual proximity: Linking Car2X Communication with Online Social Networks. In Proceedings of the 4th International Conference on Automotive User Interfaces and Interactive Vehicular Applications - AutomotiveUI ’12 (p. 249). New York, New York, USA: ACM Press. doi:10.1145/2390256.2390297 Nass, C., Jonsson, I.-M., Harris, H., Reaves, B., Endo, J., Brave, S., & Takayama, L. (2005). Improving automotive safety by
pairing driver emotion and car voice emotion. In CHI ’05 extended abstracts on Human factors in computing systems (pp. 1973–1976). New York, NY, USA: ACM. doi:10.1145/1056808.1057070 O’Brien, S. R., Tay, R. S., & Watson, B. C. (2004). Situational factors contributing to the expression of aggression on the roads.
IATSS Research, 28(1), 101–107. Parkinson, B. (2001). Anger on and off the road. British Journal of Psychology, 92(3), 507–526. doi:10.1348/000712601162310 Parkinson, B. (2008). Emotions in direct and remote social interaction: Getting through the spaces between us. Computers in Human Behavior, 24(4), 1510–1529. doi:10.1016/j.chb.2007.05.006 Rakotonirainy, A., Feller, F., & Haworth, N. (2009). In-Vehicle Avatars to Elicit Social Response and Change Driving
Behaviour. International Journal of Technology and Human Interaction (IJTHI), 5(4), 80–104. Renge, K. (2000). Effect of driving experience on drivers’ decoding process of roadway interpersonal communication.
Ergonomics, 43(1), 27–39. doi:10.1080/001401300184648 Schroeter, R., Rakotonirainy, A., & Foth, M. (2012). The social car : new interactive vehicular applications derived from social media and urban informatics. In 4th International Conference on Automotive User Interfaces and Interactive Vehicular Applications (AutomotiveUI 2012) (pp. 107–110). Portsmouth, New Hampshire: ACM. Schroeter, R., Soro, A., & Rakotonirainy, A. (2013). Social Cars : Sensing , Gathering , Sharing and Conveying Social Cues to
Road Users. In B. Guo, D. Riboni, & H. Peizhao (Eds.), Creating Personal, Social and Urban Awareness through Pervasive Computing. IGI Global. Soole, D., Lennon, A., Watson, B., & Bingham, C. (2011). Towards a comprehensive model of driver aggression: a review of the literature and directions for the future. In C. N. Ferraro (Ed.), Traffic Safety (pp. 69–97). Nova Science Publishers, Inc. Svenson, O. (1981). Are we all less risky and more skillful than our fellow drivers? Acta Psychologica, 47(2), 143–148.
doi:10.1016/0001-6918(81)90005-6 Viola, P., & Jones, M. (2011). Rapid object detection using a boosted cascade of simple features. In Proceedings of the 2001 IEEE Computer Society Conference on Computer Vision and Pattern Recognition. CVPR 2001 (Vol. 1, pp. 511–518). IEEE Comput. Soc. doi:10.1109/CVPR.2001.990517 Wollstädter, S., Pfister, H., & Höger, R. (2013). The role of music characteristics on drivers’ anger regulation.
Arsrpe.acrs.org.au. Young, M. S., Birrell, S. A., & Stanton, N. A. (2011). Safe driving in a green world: a review of driver performance benchmarks and technologies to support “smart” driving. Applied Ergonomics, 42(4), 533–9. doi:10.1016/j.apergo.2010.08.012
LISTED IN THE AHFE DIGITAL BOOKSTORE CATALOGUE
Explore the complete digital volume
Advances in Human Aspects of Transportation: Part II
Read this individual research paper free through the original publisher, or explore the full digital proceedings book.
ISBN 978-1-4951-2098-5
Explore this ISBN in the AHFE Bookstore ↗Listed in the July 2026 bookstore catalogue; search by ISBN to confirm current availability · Digital book purchase optional