Andrzej Szarataa, Olga Kokkinoub, Socrates Basbasb, Ioannis Politisb (2021). Evaluation of Telematic Applications for Information Provision in Public Transport. In: Advances in Human Aspects of Transportation: Part II. AHFE Open Access, vol. 16. https://doi.org/10.54941/ahfe100700
This paper investigates various parameters that are related with the information provided by telematics applications in public transport. The telematics applications examined are a) a web site portal that provides real time information to PT users, b) a smartphone application that utilizes the advantages of location identification and c) an interactive voice response (IVR) system. The examination was performed through a revealed and stated preference questionnaire-survey that was addressed to public transport users in the city of Thessaloniki, Greece. The parameters investigated are related with the socioeconomic background of the public transport users, their mobility patterns and attitudes as well as with stated opinions about changes that telematics applications may have on their current travel behavior. Finally, a linear multiple regression model was developed, indicating that the parameters which may have an impact on the perceived cost of these application (as a percentage of the total fare level) are related with the application itself, the age of the PT user as well as with his/her educational level.
The effects and the impacts of the provision of (real-time) information to public transport users, has been examined by numerous studies. Katrin & Kottenhoff, 2007, identified 7 main effects that real-time information may have to the Public Transport customers; on their study, they found that a 20% reduction of the perceived waiting time can be achieved through the installation of dynamic Variable Message Signs at stops. Furthermore, they found that these installations may have impact on adjusted walking speeds. The effect of passengers’ waiting time on Public Transport assignment to lines and routes and the value of information to schedule Public Transport were extensively discussed on a paper by Odd & Sunde, 2008. The benefits of Real Time Passenger Information Systems and the way these systems affect the perceived quality of Public Transport have been recently explored by Monzon, Hernadez & Cascajo, 2013. Finally, in a paper by Guo, 2011, the relationship between the conventional transit maps and the Advanced Transit Information Systems and their effect on passengers’ travel decision are examined in a comparative manner.
Interactive Voice Response (IVR) systems have been traditionally used by public transport operators to support customers on their trip Casey et al., 1998. These systems tend to have limited use the last decade since information provision is gradually replaced by new developed telematics applications and therefore few research studies which analyze the impact of IVR systems on travel behavior can be identified in the literature (Nelson & Mulley, 2013).
Web based public transport information systems are the pioneer applications for real time information provision. In most cases, an advance Web Geographic Information System (web-G.I.S.) is developed and among other services, these applications are primarily used for path finding and optimization (Peng & Ruihong, 2000 and Ziliaskopoulos & Travis, 2000). From simple one-mode applications, these applications are now providing multimodal path services with various real cases implementations worldwide (Su & Chih-hung, 2010). The price sensitivity as well as the willingness to pay for web-enable Public Transport Information Services was discussed at papers by Molin & Harry, 2006 and Zheng et al, 2010.
The continuous increase of mobile usage is also considered as a new entry key player on the information provision. The ability of smartphones to locate the position of the user anytime, as well as the development of high technology applications that can be downloaded for free by smartphone users, gave the opportunity for provision of customized/personalized accurate information with numerous positive effects. Watkins et al, 2011 found that mobile real time information provision reduces not only the perceived waiting time at bus stops, but also the actual waiting time. New implications of smartphone usage, such as the Crow Sourcing, and how these can affect the routing and the path change of Public Transport users are being examined (Velaga et al, 2013).
Hickman & Wilson, 1995 explored the impact that real time information provision may have on path choice between public transport users. On a simulation study, various origin-destination paths were examined and a behavioral model of Public Transport path choice was developed. Based on their analysis, which was published in 1995 where real time information provision was limited and given only through traditional methods, they did not found valuable quantitative benefits that can be gained by the user.
Another important factor, which will not be discussed in detail in this paper, is the content of the information. One study by Abdel-aty, 2001 showed that frequency of service, number of transfers, seat availability, walking time to the transit stop and fare information are among significant information types that commuters desire. Almost most of these services are provided nowadays from the variety of the telematics applications The paper examines the impact of three telematics applications installed by the Organization of Urban Transport of Thessaloniki, Greece (OASTH) on travelers’ behavior. The applications are providing real time travel information on issues related with the routing and scheduling of the buses, aiming to increase in this way the attractiveness of Public Transport (P.T.) against private cars. The applications being examined are a) the website portal of the organization b) a smartphone application and c) an interactive voice response (IVR) system. Three revealed preference questionnaire surveys were conducted respectively in order to assess the level of awareness and acceptance of these applications. The research corresponds to preliminary descriptive and inferential statistic analyses and investigates a number of parameters that are related both with the passenger (e.g. age, income etc) and with the application itself and examines their potential for forcing travelers to change their current travel behavior e.g. by selecting more sustainable ways of travelling. Furthermore, a linear multiple regression model was developed in order to assess the cost of these applications as it is perceived by the customers.
THE TELEMATICS APPLICATIONS As it is mentioned in the previous section, the telematics applications examined in this paper are a website portal, a smartphone application and an interactive voice response system. All these applications have been developed, operated and regularly updated by the Organization of Urban Transport of Thessaloniki (OASTH) which is the sole Public Bus Transport Operator in the conurbation of Thessaloniki. The objective of this section is to briefly present the three applications and their respective services.
The website portal, directly accessible through the address http://www.oasth.gr, is a dynamic webpage which provides information about: bus routes, optimal route search, maps of bus lines (though Google maps), real time information about bus arrivals at a selected bus stop, real time depiction of buses in Google maps, points of interests, duration of a route etc. According to OASTH, in December 2010, almost 250,000 unique visitors had visited this webpage (OASTH, 2010).
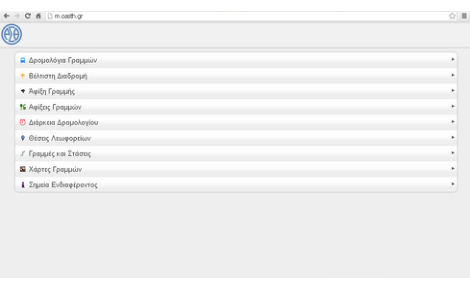
Similar information is provided also by the smartphone application which can be easily downloaded by android or iphone users. The services are directly accessible through the address http://m.oasth.gr. Figure 1 shows screenshots from the telematics application of the website portal and the smartphone respectively.
Figure 1: . The telematics application of the website portal and the smartphone application of OASTH respectively
Finally, the interactive voice response system is accessible though the telephone center of OASTH. A voice record menu is available and guides the listener to real-time services such as arrivals of a bus line to a specific stop, information about the bus stops of a specific bus line, which bus lines are passing through a specific bus stop etc. According to OASTH, more than 2,500 people had been served by the IVR system, in January 2011 (OASTH, 2011).
RESEARCH METHODOLOGY The Questionnaire Survey
In order to evaluate the effects and the impacts of these applications on peoples’ mobility and in order to examine in what extent these applications are perceived by the customers as useful and important, a questionnaire survey was carried out addressed to the public transport users of the city of Thessaloniki (Kokkinou, 2011).
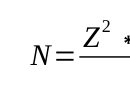
The questionnaire survey was conducted at three bus stops which are located at the city center. The bus stops were selected in order to primarily avoid bias at the sample population; the city center is daily attracting high number of people with various socioeconomic, travel and behavioral profiles. Additionally, these bus stops serve large number of people and therefore it was easier to collect the necessary number of questionnaires. The sample size was calculated by using the following traditional sample size calculation formula (ASTM, 2013):
Equation reproduced from the original PDF.
2
2∗( p)∗( p−1) c
where: Z = Z value (e.g. 1.96 for 95% confidence level) p = response distribution (percentage picking a choice expressed as decimal, usual 0.5 used for normally distributed responses) c = the amount of uncertainty (confidence interval, expressed as decimal, for example 0 .04 represent a tolerance of ±4)
At the survey design phase, the assumptions made to predefine the sample size where: confidence interval (c) equal to 0.06, response distribution (p) equal to 0.5, confidence level equal to 95%. The targeted population was estimated to 250,000 since the modal split for Public Transport at the Greater Agglomeration of the City of Thessaloniki (populated over 1,000,000 inhabitants) is estimated to 24-25%. With these assumptions the sample size was calculated to 267 cases. Finally, 319 valid questionnaires were gathered, returning a margin of error (confidence interval) equal to approximately 5%.
The questionnaire itself, consisted of 18 questions and it was divided into five discrete sections; at the first section, the socioeconomic profile of the respondents was identified (sex, age, education etc), at the second section the travel characteristics of the respondents were determined (e.g. whether the respondent is using his car for daily trips or not, the type of the ticket is usually used), at the third section, the experience of the customer related to the three telematics applications was examined (e.g. how often they are using these applications, whether they find the information provided useful and reliable, what type of information usually want), at the fourth section , the impact that these applications may have on traveler behavior is explored (e.g. how possible is to shift from car to bus due to the applications and how possible is to make additional trips due to the existence of these applications). Finally, at the last section, questions regarding the willingness to pay (WTP) were included so as to identify the level of acceptance for the examined applications.
It was decided to collect equal responses (questionnaires) for each one of the three applications. Therefore, from the 319 collected questionnaires, 103 questionnaires were for the mobile application, 105 questionnaires for the IVR application and 111 questionnaires for the website application.
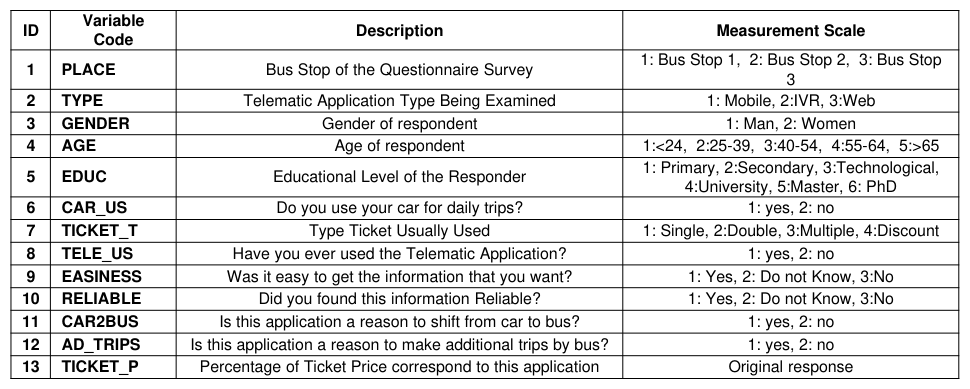
For the purposes of the study, the questions of the questionnaire were coded into specific variables. Table 1 show the 13 variables which were used in this study, together with a short description and their measurement scale.
Table 1: Variables used in the study
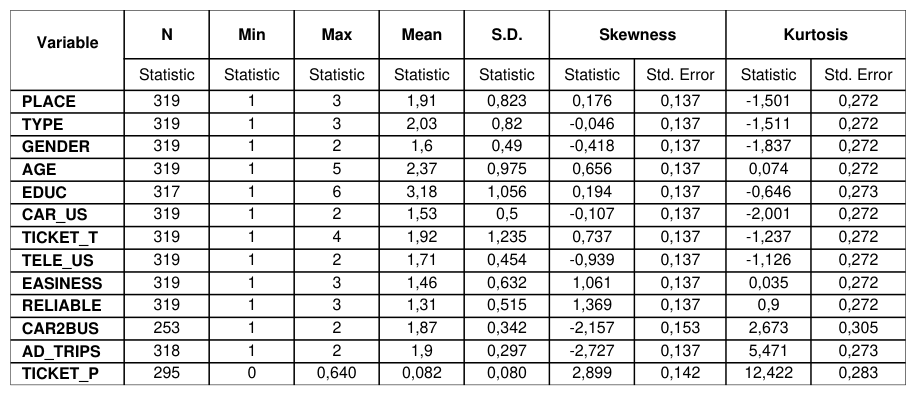
Descriptive and Inferential Statistics The variables of the study were manipulated through the statistical programs of SPSS and LISREL. Table 2, presents the descriptive statistics of the 13 variables together with the normality tests of Skewness and Kurtosis. Although the table indicates a kurtosis for the variables of additional trips (AD_TRIPS) and percentage of ticket that corresponds to the cost of the application (TICKET_P), it was decided not to apply any traditional transformation of these variables since the values are not high enough and the Q-Q plots indeed did not indicated any serious violation of the normality. Additionally, the mean values of the variables that are related with the socioeconomic characteristics of the respondents (e.g. 1.6 value for gender, 2.37 value for age, 3.18 value for educational level) confirms the initial willingness to equally represent various population segments in the study.
Table 2: Descriptive statistics and normality tests Variable N Min Max Mean S.D. Skewness Kurtosis
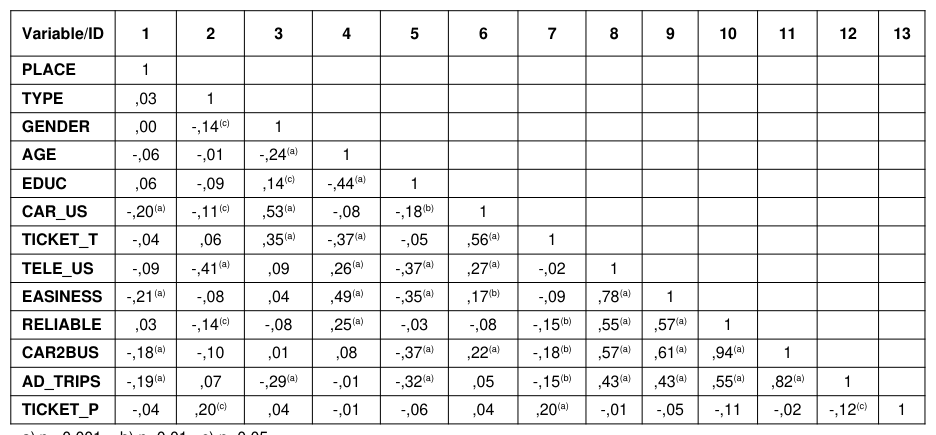
Table 3, presents the various correlations (pearson product-moment, tetrachoric, polychoric, contingency etc) between the 13 variables, together with the statistical significance for two tailed probabilities.
Table 3: Correlation matrix and two tailed probabilities
a) p <0.001, b) p<0.01, c) p<0.05
The presentation of the correlations between the variables, can lead to numerous useful outcomes. Regarding the selection of the bus stops, it seems that there is a statistically significant difference at the responses related to the car usage (r = -.20, p<0.001), the way people are perceiving the given information (r = -.21, p<0.001) and the potential to change their current travel behavior (r = -.18, p<0.001 for replacing car trips with the bus and r = -.19, p<0.001 for making additional trips with the bus to the existence of the telematics applications). No violation on the assumption of equal representation of the socioeconomic background between the respondents is detected within the bus stops. The above indicate that indeed no differences can be observed regarding the socioeconomic profile between bus stops that are located very close each other and in the city center; however strong variation is observed on the travel characteristics of the respondents and the impact that telematics application can have on their travel behaviour.
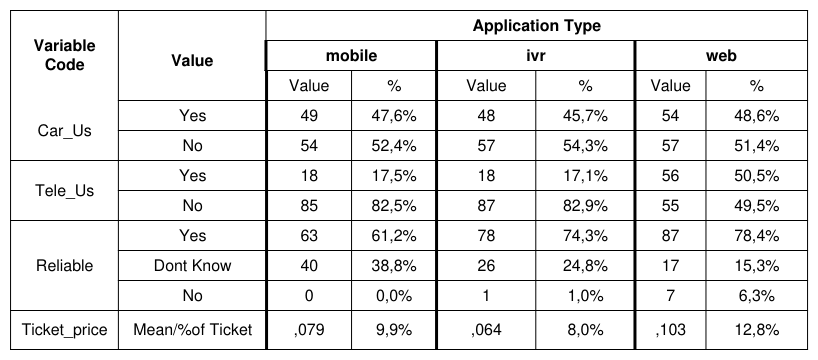
Regarding the telematics applications, differences have been observed on the gender (r = -.14, p<0.05) and this outcome is obviously related with the sampling distribution between the three types of the examined applications, the usage of the car for daily trips (r = -.11, p<0.05), the experience of the respondent to the specific application type (r = -.41, p<0.001), the level of perceiving the information provided as reliable or not (r = -.14, p<0.05) and the level of the perceived cost needed to develop and operate each one of the three applications (r = .20, p<0.05). Table 4 presents the distribution of the responses for the four variables that was found to have a statistically significant difference between the telematics applications. From this Table it can be concluded that the people who use their car for their daily trips are those who detected most on the website questionnaires. Furthermore, as expected, this application has the broadest usage between the users (almost 51% has an experience on using the website portal) and it is considered as the telematics application with the most reliable information (more than 78% believe that the information is reliable). However, respondents believe that the cost of the website application is greater compared to the other two applications (mean perceived cost as a percentage to the total fare which is 0.8 euros).
Table 4: Statistically different responses related to the telematics applications
Regarding gender differences, Table 3 indicates a strong differentiation in the age levels (r = -.24, p<0.001) with the males at the sample to be older compared to females, with a lower educational level (r = .14, p<0.05). As expected, females stated that they do not use their car for daily trips so often compared to males (r = .53, p<0.001) and prefer tickets for multiple trips (r = .35, p<0.001). Finally, males stated more frequently compared to females that the existence of the telematics applications will not motivate them to make additional trips (r = -.29, p<0.001).
Regarding statistically significant differences between age segments, the correlation matrix confirms the expected outcome that older users do not use very often the telematics applications (r = .26, p<0.001), have problems in easily understanding the information provided by the applications (r = .49, p<0.001) and do not trust the content of this information (r = .25, p<0.001), compared to younger users.
Amongst other valuable outcomes delivered from the correlation matrix is that users that do not often use the telematics applications do not intent to change their current travel behavior (using more often bus instead of cars - r = .57, p<0.001- and make additional trips by bus - r = .43, p<0.001) as well as the fact this change is not likely to happen when users meet difficulties to understand the given information (r = .61, p<0.001) or believe that this information is not accurate (r = .43, p<0.001)
THE LINEAR MULTIPLE REGRESSION MODEL Model Specification
Following the outcomes that have been derived from the previous sections, it was decided to develop a regression model, in order to estimate which parameters - and in which manner - can have an impact on users’ perception regarding the cost of this telematics application. As already discussed, the cost of these applications was identified as a perceived percentage of the passenger fare that corresponds to the development and operation of these applications (total ticket fee for a single ticket equals to 0,8 euros).
Therefore, the proposed model has as dependent variable, the variable TICKET_P and as independent variables the total of the variables presented in Table 1. Assuming a linear relationship between the dependent and the independent variables, a linear multiple regression model was developed and tested.
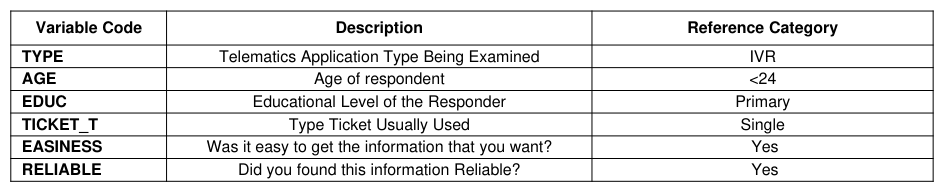
Since all independent variables are non-continuous scale (ordinal and nominal), they all have been recorded as dichotomous with a reference category each time. Table 5 gives the reference category for each ordinal scale variable
Table 5: Recoding of Ordinal Variables
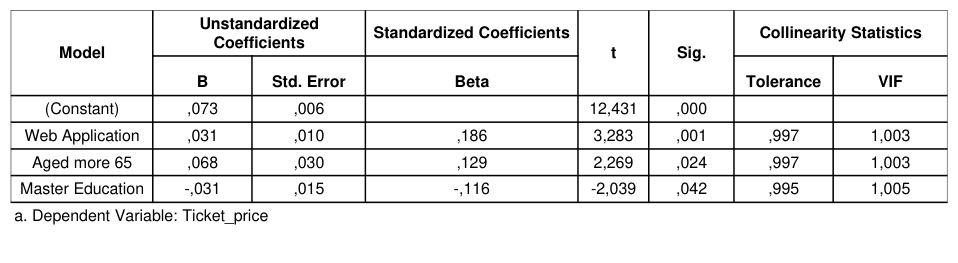
Model Estimation For the model estimation, a stepwise forward procedure was applied in order to estimate which variables have a statistically significant impact on the dependent variable TICKET_P. Table 6, presents the beta estimates (standardized and unstandardized) of these variables which are a) the web application (compared to the reference category of IVR), b) the people aged more than 65 (compare to the reference category of people aged less than 24 years old), and c) the users holding a Master Degree (compared to those have completed Primary education). Further, the calculation of Variance Inflation Factor (VIF) indicates no outliers and influential cases (values close to 1).
Table 6: Multiple Regression Model Results Unstandardized
The ANOVA statistical test, indicated that the prediction model was statistically significant, F (3, 291) = 6.809, p < 0.001, and accounted for approximately 6% of the variance of ticket price. This means that although the model includes variables that can predict the dependent variable, there are also other important predictors that are contributing on the estimation of the cost of the telematics applications and are not included in the proposed model.
The regression formula that derives after the results of Table 6 is the following: ¿ ¿
Where: i=1,,,,,,295, the valid cases to predict the variable TICKET_P for each individual i TYPE= 0 for IVR application and 1 for the web application AGE= 0 for users aged less than 24 years old and 1 for users aged more than 65 years old EDU=0 for users with Primarily Education and 1 for users with Master Degree.
Normality and Homogeneity of Variance A main test that is performed in linear regression analyses is that of error variance assumption. Figure 2 presents the histogram for the residuals where a normally distribution can be observed. Thus, based on these results, the normality of residual assumption is satisfied.
Figure 2. Frequency histogram of the standardized residuals of the dependent variable
Figure available in the original PDF paper.
Figure 3. Scatter Plot of Unstandardized Predicted Variable against Unstandardized Residuals In order to evaluate the homogeneity of the variance, a Scatter Plot of Unstandardized Predicted Variable against Unstandardized Residuals is presented in Figure 3. From the scatter plot it can concluded that no serious heteroscedasticity exists, e.g. no violation of the homogeneity of variance assumption is observed.
Figure available in the original PDF paper.
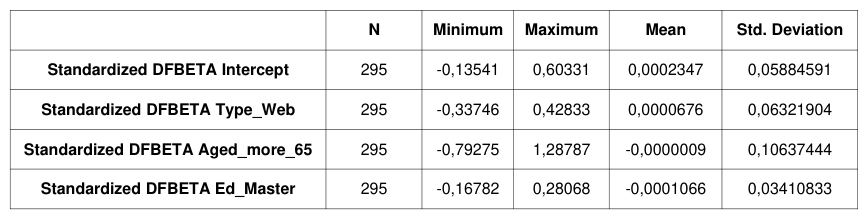
Finally, DfBetas values of the proposed model are examined in order to identify outliers and influential cases. Table 7 shows the descriptive statistics for the DfBetas of the statistical significant variables of the proposed model. Minimum and Maxinum values do not exit the cutting off criterion of ±2 therefore it can conclude that the dataset does not include outliers or influential cases.
Table 7: Outliers and Influential Cases Examination N Minimum Maximum Mean Std. Deviation
Model Interpretation The interpretation of the model is done through the unstandardized coefficients of Table 6. The constant value of 0.073, corresponds to the ticket price that is used to developed and operate the IVR telematics application (Type=0), as it is perceived by young users aged less than 24 years old (AGE=0) with Primary education (EDUC=0).
Useful outcomes can be also derived from the interpretation of the coefficients for the independent variables that found to have a statistical significant prediction. For example, the coefficient value of 0.031 means that regarding the type of the application, the website portal is perceived as more costly compared to the IVR application by 0.031 units (euro) per ticket.
However, the most important parameter regarding the perceived cost of the telematics applications is the age of the user. As expected, older users (aged over 65 years old) perceive the examined applications as more costly compared to younger users (below 24 years old) by 0.068 units (euro) per ticket. This is a plausible outcome since older users tend to be impressed more about the capabilities of the new technologies and the services that can offer and therefore they intend to overestimate the budget that is needed to develop and operate them.
Finally, statistical significant differences were also observed regarding the educational level of the responders and how they are estimating the cost of the telematics applications. The regression model indicates that people, who hold a master degree, perceive the cost of telematics applications lower by a unit of 0.031euros per ticket, compared to people who have completed just the primary education. This is also a plausible outcome, since people who are highly educated can give better estimations about the technological background needed in order to develop such applications and therefore they tend to give lower cost values compared to lower educated users.
CONCLUSIONS
Information and Communication Technologies (ICT) are considered as one of the most promising supporting tools to tackle urban congestion and manage with an optimum manner, the travel demand and mobility. Ongoing research and new applications, such as social media and crowdsourcing, are utilizing the benefits of ICT and provide more accurate, reliable and user-demand services.
However, these ICT are subject to users’ perception, level of acceptance and willingness to pay. Like other services, these applications can differ among the end users (e.g. public transport users) in various ways. An in-depth analysis of the factors that may have an impact on the acceptance of these applications by the end users as well as an impact on influencing their travel behavior is essential.
In this study, the various parameters that may have an effect on peoples’ mobility and acceptance of ICT applications were investigated. Three telematics applications were tested, already installed and operating at the city of Thessaloniki Greece. The analysis showed that various differentiations can be observed between the population clusters and these differentiations can have an impact on the travel behaviour of the public transport user.
Furthermore, the study found statistical significant differences related to age, application examined and educational level as well as the perceived cost required developing and operating the three case study applications.
All the above, indicateg that an appropriate categorization and analysis of the targeted population must be done ex ante, before the installation of any telematics application, so as to have better estimations about the impacts that are expected to be observed afterwards.
REFERENCES
American Society for Testing and Materials (ASTM), E122-07: Standard Practice for Calculating Sample Size to Estimate, With Specified Precision, the Average for a Characteristic of a Lot or Process, 2013 Abdel-aty, Mohamed A. 2001. “Using Ordered Probit Modeling to Study the Effect of ATIS on Transit Ridership.”
Transportation Research Part C: Emerging Technologies 9: 265–77. Casey, Robert F, Lawrence N Labell, Elisabeth J Carpenter, Joseph A Lovecchio, Jackson W Royal, Judith C Schwenk, and Carol L Schweiger. 1998. “Transportation Systems : The State of the Art.”, US Department of Transportation, Federal Transit Association. Dziekan, Katrin, and Karl Kottenhoff. 2007. “Dynamic at-Stop Real-Time Information Displays for Public Transport: Effects on
Customers.” Transportation Research Part A: Policy and Practice 41(6): 489–501. Guo, Zhan. 2011. “Mind the Map! The Impact of Transit Maps on Path Choice in Public Transit.” Transportation Research Part A: Policy and Practice 45(7): 625–39. Hickman, Mark D., and Nigel H.M. Wilson. 1995. “Passenger Travel Time and Path Choice Implications of Real-Time Transit
Information.” Transportation Research Part C: Emerging Technologies 3(4): 211–26. Kokkinou Olga. 2011, “Evaluation of Traveler Information Systems at the Public Transport Users”, Master Thesis, October 2011 (In Greek). Larsen, Odd I., and Øyvind Sunde. 2008. “Waiting Time and the Role and Value of Information in Scheduled Transport.”
Research in Transportation Economics 23(1): 41–52. Li, Zheng, David a. Hensher, and John M. Rose. 2010. “Willingness to Pay for Travel Time Reliability in Passenger Transport: A Review and Some New Empirical Evidence.” Transportation Research Part E: Logistics and Transportation Review 46(3): 384–403. Molin, Eric J.E., and Harry J.P. Timmermans. 2006. “Traveler Expectations and Willingness-to-Pay for Web-Enabled Public
Transport Information Services.” Transportation Research Part C: Emerging Technologies 14(2): 57–67. Monzon, Andres, Sara Hernandez, and Rocio Cascajo. 2013. “Quality of Bus Services Performance: Benefits of Real Time Passenger Information Systems.” Transport and Telecommunication 14(2): 155–66. Nelson, John D, and Corinne Mulley. 2013. “The Impact of the Application of New Technology on Public Transport Service
Provision and the Passenger Experience: A Focus on Implementation in Australia.”, Research in Transportation Economics, 39: 300–308. Organization of Urban Transportation of Thessaloniki (OASTH), 2011, Various Unpublished Statistical Data. Peng, Zhong-Ren, and Ruihong Huang. 2000. “Design and Development of Interactive Trip Planning for Web-Based Transit Information Systems.” Transportation Research Part C: Emerging Technologies 8(1-6): 409–25. Su, Jau-ming, and Chih-hung Chang. 2010. “The Multimodal Trip Planning System of Intercity Transportation in Taiwan.”
Expert Systems with Applications 37(10): 6850–61. Velaga, N., Nelson, J., Edwards, P., Corsar, D., Sripada, S., Sharma, N., and Beecroft, M. (2013). ”Development of a Map- Matching Algorithm for Rural Passenger Information Systems through Mobile Phones and Crowd Sourcing.” Journal of Computational Civil Engineering, 27(6), 732–742. Watkins, Kari Edison, Brian Ferris, Alan Borning, G. Scott Rutherford, and David Layton. 2011. “Where Is My Bus? Impact of
Mobile Real-Time Information on the Perceived and Actual Wait Time of Transit Riders.” Transportation Research Part A: Policy and Practice 45(8): 839–48. Ziliaskopoulos, Athanasios K, and S.Travis Waller. 2000. “An Internet-Based Geographic Information System That Integrates Data, Models and Users for Transportation Applications.” Transportation Research Part C: Emerging Technologies 8(1-6): 427–44.
LISTED IN THE AHFE DIGITAL BOOKSTORE CATALOGUE
Explore the complete digital volume
Advances in Human Aspects of Transportation: Part II
Read this individual research paper free through the original publisher, or explore the full digital proceedings book.
ISBN 978-1-4951-2098-5
Explore this ISBN in the AHFE Bookstore ↗Listed in the July 2026 bookstore catalogue; search by ISBN to confirm current availability · Digital book purchase optional