Eleni Misokefalou, Nikolaos Eliou (2021). Recording and Evaluation Procedure of Drivers’ Distraction in Accordance with Driver’s Characteristics in High Speed Arterials. In: Advances in Human Aspects of Transportation: Part II. AHFE Open Access, vol. 16. https://doi.org/10.54941/ahfe100704
Over the last years, distracted driving constitutes a considerably increasing road safety problem with disastrous results and it possesses a leading position among the accidents causes. The present study deals with driver’s distraction due to out of the vehicle factors as well as factors related to the driver such as age, gender, driving experience etc. Considering exterior factors as the most significant, we can group them in four categories: built roadway, situational entities, the natural environment, and the built environment. Regarding the fourth category, it is related to the wide variety of civil infrastructure, the commercial land use combined with the high vehicle speeds. All these contribute to the setup of a very dangerous environment by increasing driver’s distraction and inattention. This research is based on a medium scale experimental procedure which took place in three urban freeways in Greece, using a sample of 77 drivers. The distraction of the driver’s attention is evaluated via a continuous recording of his gaze which acts as the main indicator regarding driver’s performance. The main objective of this paper is to assess the side effects of roadside advertising and overloaded informational signs to driver’s distraction and inattention. The results of this type of research procedures are very useful as a tool to prevent the forthcoming pressure for more and more billboards and trademarks on the roads as well as to encourage the adaptation of more precise regulations with regard to the road infrastructure, the placement of roadside elements, etc.
The distraction of driver’s attention during the implementation of the driving task is not simply a theory. It is a procedure which is activated and developed depending on many factors. It is detected in all drivers, with varying extent and frequency of appearance, but, in every case, the results of this distraction are intense for the driving task, the driver’s safety and, finally, for the rest of road users. Distraction at all forms, has become object of research recently, with distraction from a secondary task concentrating most of the research on the subject, particularly after the widespread use of mobile phones and the integration of driver assistance systems in modern vehicles. Naturally, priority is given to drivers of passenger cars without overlooking the other road users’ categories such as truck drivers, motorcyclists, bicyclists etc (Misokefalou et al. 2010).
Definition and Characteristics of Driver Distraction The first step to a proper approach is to understand the basic characteristics of distraction as it appears in general. Distraction may be visual, cognitive, biomechanical and auditory (Ranney et al. 2001). Many researchers have tried to define driver distraction and as a result the related literature contains a significant number of those definitions. In the first International Conference on Distracted Driving (Hedlund et al. 2005:2) the scientific community agreed on a definition for distracted driving:
“Distraction involves a diversion of attention from driving because the driver is temporarily focusing on an object, person, task, or event not related to driving, which reduces the driver’s awareness, decision-making, and/or performance, leading to an increased risk of corrective actions, near-crashes, or crashes” [3].
The main causes of distraction are classified into two categories: Those coming from the interior of the vehicle and those from the external environment. In the second category, one finds some very important potential sources of driver distraction which can be grouped in four major categories: built roadway, situational entities, the natural environment, and the built environment (Horberry et al. 2009). According to the writers one component of built environment which consists the fourth category of the previous categorization is the billboards and any other kind of road advertising. In the case of causes related to advertising, it should be particularly emphasized that the purpose of their presence at some point at the roadside, or even in a moving vehicle in the road, is to capture the driver’s gaze in order for him/her to devote the required time so as to assimilate the information obtained. Roadside advertising billboards are designed by their very nature to attract attention. Crucially, though, the related potential threat to road safety is generally not acknowledged by the industry (Crundall et al. 2006). This is the reason why distraction by advertising is a very significant road safety phenomenon which must be elucidated by using all the available means and methods.
Frequency of Driver Distraction The importance of this issue emerges from data which shows distraction from a secondary task as a cause of serious accidents as well as crashes. A characteristic research was carried out by the Virginia Tech Transportation Institute (VTTI) for NHTSA, the “100- Car Naturalistic Driving Study” (Klauer et al. 2006). During the 100-Car Naturalistic Driving Study, driver involvement in secondary tasks contributed to over 22 % of all crashes and near-crashes recorded during the study period. At this point it should be noted that, as near crash is defined the subjective judgment of any circumstance that requires, but is not limited to, a rapid, evasive maneuver by the subject vehicle, or any other vehicle, pedestrian, cyclist, or animal to avoid a crash (Klauer et al. 2006). These secondary tasks, which can distract the driver from the primary task of driving (steering, accelerating, braking, speed choice, lane choice, manoeuvring in traffic, navigation to destination, and scanning for hazards), are manifold and include such things as eating/drinking, grooming, reading billboards, using and adjusting in-vehicle entertainment devices, conversation with passenger(s), viewing the scenery, tending to children and pets, smoking, cell phone use and related conversation, use of other wireless communication devices, and note-taking, to name a few (Hendlud et al. 2006). But, not all of the above distracters involve secondary tasks initiated by driver –they can be events, objects, activities or people both inside/outside the vehicle (Tasca 2005). The statistics of the above research are confirmed by the data from accidents in many countries (e.g. accident data from United States in 2008 (NHTSA, 2009) and Greek Police for 2009 and 2010 (Greek Police 2011)) as well as by a large number of other studies in the field.
Particularly for billboards, Crundall in his study (Crundall et al. 2006) supports that though it is acknowledged that research into advertisement distraction has been extremely limited (Beijer et al. 2004), the few studies that have been conducted have demonstrated that drivers do look at and process roadside advertisements (Hughes et al. 1986), and that fixations upon advertisements can be made at short headways or in other unsafe circumstances (Smiley et al. 2004). Previous studies of accident statistics have also identified external distractors, including advertisements, as a significant self-reported cause of traffic accidents (Stutts et al. 2001). Particularly, for roadside distractors, evidence is mounting that roadside distractions (and advertising in particular) present a ‘small but significant’ risk to driving safety (Lay2004). Conservative estimates collated from a review of several accident databases put external distractors responsible for up to 10% of all accidents (Wallace 2003). This is confirmed also by a recent simulator study (Young et al. 2009) in which there is a tentative suggestion that more crashes occur when billboards are present.
METHOD
Methods of Evaluating Driver Distraction The only certain way for the researcher to detect driver’s distraction is via the results that distraction produces. The use of standardized methods gives the researchers the possibility to exchange data, conclusions and best practices. Therefore, it is important to detect the most suitable method of data collection (Rockwell. 1998). This aim can be achieved via a comparative study between the allocated methods, examining the advantages and disadvantages of every method separately as well as the usefulness and necessity of the results that every one of them produces. An analysis of this kind was made by the Univerity of the Thessaly (Eliou et al. 2009). During this study all the available methods were examined. The most popular among the available methods are based on elements of accidents, on experiments, on observation and surveys. Furthermore, there are some kinds of methods that are not included in any of the previous categories like Peripheral Detection Task and Visual Occlusion.
Selection of the Appropriate Method The method considered the most appropriate is an observational-naturalistic study, which takes place in the field, using specially equipped vehicles with regard to record the driver’s eye movements in order to measure the frequency and the duration of the glances at every object considered potential source of visual distraction. The available equipment (Facelab machine) is capable of making continuous data recording. The main advantage is that with this method, in contrast with all the others categories, driving comes as close to the real thing as possible which is important for the research when we study human reactions. Naturally, there are some limitations both in designing and carrying out the experiment. The most important of these is the limited number of participants in comparison with other methods like questionnaires study, the unfamiliar vehicle which causes stress to the driver, the anxiety because of the sense of being monitored as the vehicle is equipped with cameras and, finally, the subjective discretion of the analyst-observer at the data processing.
Captiv software, which is compatible with FaceLab L2100, was used for the analysis of the results. This software gives the opportunity to analyse the data in detail by recording the number of glances at every billboard as well as the total time that the billboard captured driver’s gaze during driving. At this point it should be noted that as distraction, in this study, is considered the continuous or intermittent but repeated capture of the gaze from a theme for longer than a total of two seconds as glances that last more than this time are related to driving errors (Rockwell, 1998). Smaller time intervals (0-0.7 seconds, 0.7-1.0 seconds, 1.0-1,6 seconds, 1,6-2.0 seconds >2 seconds) were also studied in order the results to be comparable with the results of other related studies. Highly experienced analysers carefully analysed the produced by Facelab machine videos and all the data were statistically analysed.
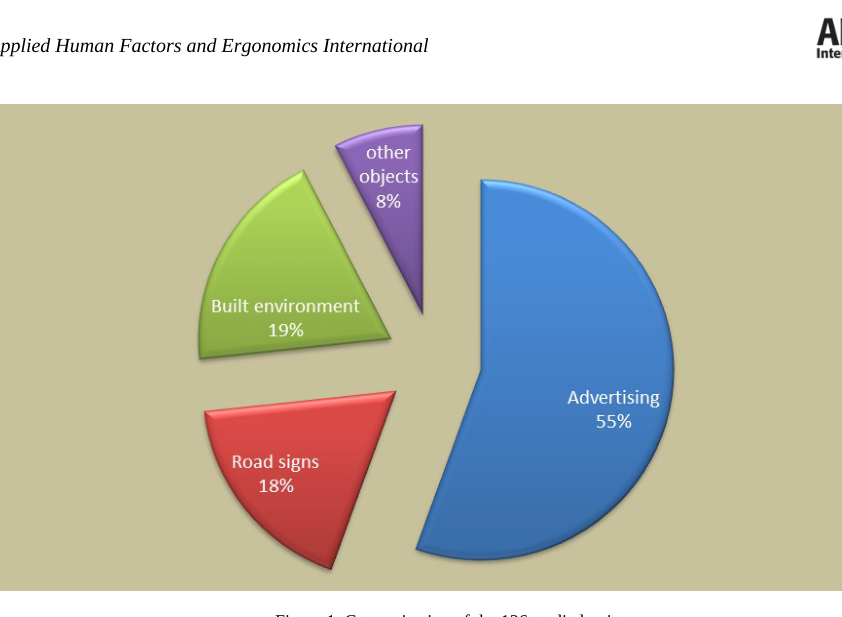
Experimental Site The research took place from June 2011 to February 20102, in 3 suburban greek roads. The first road is Attiki Odos, a suburban highway in the city of Athens. There were three routes under observation with a length of 19, 16.8 and 15 km respectively. The second road is Leoforos Kifisou which is also located in the city of Athens and the route under observation has a total length of 10 km. The third road is the national road between the city of Thessaloniki and the city of Giannitsa. The studied section is 7.7 km.At the last two roads, drivers drove both directions. The flow of vehicles is continual without being interrupted by traffic lights. The speed limit of the road is 90km/h. The total number of the points at which the data were collected is 136, of which the first 69 are at the first route, the following 40 at the second route and the last 27 at the third route. In this study other objects besides the advertisement has been selected to participate in order to act as comparison points to the advertising. The general categorization and the percentages of its participating category are shown in the following chart (Figure 1).
Figure 1. Categorization of the 136 studied points.
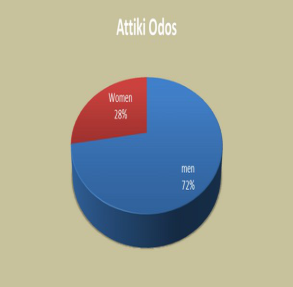
Participants Using volunteer drivers, who are required to drive a car on the three selected roads, under the supervision of the researcher, who was always in the passenger seat checking the proper function of the system, the obtained results are characterized by a high degree of reliability and validity. Seventy seven drivers participated in the survey. Their sex distribution can be seen in Figure 2.
Figure 2. Participants’ sex distribution.
The drivers were selected with criterion their familiarity with the selected roads in order to eliminate the stress which an unfamiliar route induces. All drivers were familiar with the road, as they use it in a daily basis, but the subject of the study was completely unknown to them. Regarding the limitation of the unfamiliar vehicle, each one of them, in order to become familiar the vehicle drove the selected route 2 times before the third run which was the one that we focused our attention at during the analysis process.
The drivers are between 26 and 45 years old and the vast majority of them, in all three traffic routes, possesses a driving license and drives systematically for more than ten years.
Material - Data Collection
The equipment used in the survey was very carefully chosen in order to produce the optimal quality, completeness and integrity of results. It includes a passenger vehicle and a monitoring and recording system (Facelab, Seeing machines), which detects and records every single movement of the driver’s gaze and the driver’s head. It is composed of two cameras for the recording of the above and an external camera for the recording of the road scene. All measurements for the experiment took place during the day, under normal traffic conditions as well as normal weather and lighting conditions.
RESULTS
In this study, the information isolated and analysed in depth, is related to the external impulses that cause driver distraction and concentrates interest mainly on billboards near the road and their role in driver’s distraction of attention. For this purpose, billboards along the road were identified and mapped for both directions of the route. Among them there are billboards, banners, soundpannels with graffiti and posters on them and gas station signs. Additionally, other elements on the road, such as road signs and buildings were under study. The analysis included an examination of driver behaviour, as far as concern the reactions of drivers’ pupils of the eyes while driving under the existence of these potentially evocative distraction elements of the road environment.
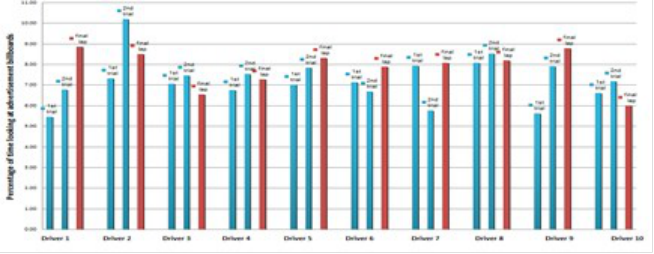
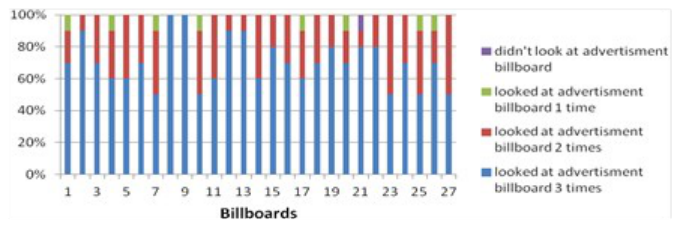
The following 3 figures (Figure 3,4 and 5) show the percentages from the analysis of the gaze direction to the observed points of each route. Each driver drove the selected route 3 times but we decided to focus our attention at the third one because of the familiarization of the driver with the vehicle which was analysed at the method section. As it shows, distraction there are certain points on the route which attract attention more than the allowed, from the aspect of safety, time.
Figure 3. Percentage of driving time looking at advertisement billboards.
The detailed analysis of the data came from the eye gaze, in terms of glance duration and frequency, led us to the following conclusions:
All roadside billboards of the route distract the majority of the drivers (gaze captured for more than 2 seconds).
At the points of the route where many billboards are placed in a short distance (e.g. advertisement billboard number 9 and 21), the majority of drivers are distracted as their gaze is captured by more than one billboard. At these points, it is observed intermittent but repeated capture of the drivers’ gaze.
Billboards attracts women’s gaze more than men’s. The average of percentages of the total time that women look at advertisement billboards is 8.7%, while for men is 7.5%.
The billboards found in the center or near the central field of vision are more likely to attract the driver’s gaze.
At the section which contains the high gather of posters placed in disorder, the large number of illegal posters attracts multiple glances from drivers so that the visual disturbance leads to confusion.
During the third route, 50 percent of drivers’ gaze is captured by more advertisement billboards than during the first route.
At Fig. 3 is obvious that there are certain advertisement billboards that capture drivers’ gaze during all three rides. The percentage of billboards that capture drivers’ gaze mostly at the second and the third route is limited.
Figure 4. Percentages of drivers distracted from billboards at all three, at two, at one and at none of the routes.
From the survey results arises that the presence of distraction, and more specifically the kind caused due to billboards, is common in drivers and depends largely on the characteristics of the billboards and their position in the field of vision.
CONCLUSIONS
Distraction of driver’s attention during driving is a major road safety problem, which threatens not only the driver’s safety but also the safety of other drivers and road users. The focus of the research on drivers of passenger vehicles is due to the fact that those drivers consist the largest category of road users with growing involvement in accidents, which are caused by the distraction of driver’s attention. The goal of the research is to identify and clarify the causes, the frequency of appearance and the way that certain factors influence the distraction of attention of each driver, focusing on the role played by roadside advertising in Greece as a parameter of the distraction of the driver’s attention.
The methods commonly used in a study of driver distraction aren’t all feasible or effective to the same extent. The chosen method allows the continuous data recording with its main advantage being the fact that driving is as close to the real thing as possible. Thus, the results are characterized by a high degree of reliability and validity. It, also, gives the opportunity to the participant to have an adjustment period with the vehicle in order to obtain a normal driving behaviour. The small possibility of the researcher to control the situations and create desirable driving scenarios is among the disadvantages of this method. The environmental conditions, also, cannot be controlled. Another disadvantage is the increased cost of the method due to the eye tracker. Finally, as disadvantage of the eye tracker we could mention the difficulty of the installation in the car as well as its sensitivity to changes (e.g. lightness conditions).
This research concluded that all roadside billboards of the route distract the majority of the with signs in the raw causing the greater distraction. Also, the more centrally positioned in the field of vision the signs are placed, the more eye-catching they are. There is a need to relate the drivers’ distraction to specific aspects of advertising signs (size, message content, position by the road).
The results of this type of research procedures are very useful as a tool to prevent the forthcoming pressure for more and more billboards and trademarks on the roads as well as to encourage the adaptation of more precise regulations with regard to the road infrastructure, the placement of roadside elements, etc.
Much of the data analysis requires collaboration with experts such as psychologists and doctors in order to provide an integrated approach. Furthermore, a comprehensive policy to reduce the visual pollution near the roads, such as billboards, can help not only to improve the road aesthetic but also to significantly improve road safety by eliminating driver’s visual distraction of attention.
To sum up, it is a fact that driver distraction is a major cause of accidents; therefore, the responsibility over the issue translates into efforts to reduce the number of injured and dead drivers. In order to achieve that, the solution of the distraction phenomenon could be found in the combination: “research-education-design- legislation”.
This research is under further analysis, as a number of 30 variables - from the road, the conditions, the points and the driver - is available to the researchers and is being statistically analysed in order to conclude about contribution of those variables in driver distraction.
ACKNOWLEDGEMENTS
We acknowledge the contribution of the company Attikes Diadromes S.A. who granted the use of the Facelab equipment for the purposes of this research. We also acknowledge the valuable contribution of all the participants who voluntarily devoted their time and energy to our research.
REFERENCES
Beijer, D.D., Smiley, A. & Eizenman, M. (2004), “Observed driver glance behavior at roadside advertising signs”, Transport Research Record, 1899, 96–10. Crundall, D., Van Loon, E. & Underwood, G. (2006), “Attraction and distraction of attention with roadside
advertisements”, Accident Analysis & Prevention, 38, 671–677. Eliou, Ν. & Misokefalou, E. (2009), “Comparative analysis of drivers’ distraction assessment methods”, 22nd ICTCT Workshop, Towards and Beyond the 2010 Road Safety Targets-Identifying the Stubborn Issues and their Solutions, Leeds, UK Greek Police. (2011), Accident Statistics for the Year 2011, Ministry of Citizen Protection, Greece. Hedlund, J., Simpson, H.M. & Mayhew, D.R. (2006), “International conference on distracted driving-summary of
proceedings and recommendations”, International Conference on Distracted Driving, Toronto (2–5October 2005). Hughes, P.K. & Cole, B.L. (2010), “What attracts attention when driving?”, Ergonomics, 29, 311–391, 1986. Klauer, S.G., Dingus, T.A., Neale, V.L., Sudweeks, J.D &, Ramsey, D.J. (2006), The impact of driver inattention on near-crash/crash risk: an analysis using the 100-car naturalistic driving study data, Report No. DOT HS 810 594, National Highway Traffic Safety Administration, Washington, D.C. Lay, M.G.: Design of traffic signs. In C. Castro & T. Horberry (Eds.). (2004), “The human factors of transport
signs”, 25–48, Boca Raton, FL: CRC Press. Misokefalou, E., Eliou, N. & Galanis, A. (2010), “Driving distraction of attention audit of motorcycle and bicycle users in urban areas, Case study in the city of Volos”, Greece, 5th international congress on transportation research, Volos, Greece. Ranney, T.A., Garrott, W.R. & Goodman, M.J. (2001), “National Highway Traffic Safety Administration driver
distraction research: past, present and future”, 17th International Technical Conference on Enhanced Safety of Vehicles, Amsterdam. Rockwell, T.H. (1998), “Spare visual capacity in driving- revisited”, In A.G. Gale, H.M. Freeman, C.M. Haslegrave, P. Smith & S.P. Taylor (Eds.) Vision in Vehicles II, 317-324. Amsterdam: Elsevier. Smiley, A., Smahel, T. & Eizenman, M. (2004), “Impact of video advertising on driver fixation patterns”, Transport
Research Record, 1899, 76–83.
Stutts, J.C., Reinfurt, D.W., Staplin, L.W. & Rodgman, E.A. (2011), “The Role of Driver Distraction in Traffic Crashes”, AAA Foundation for Traffic Safety, Washington, DC. Tasca, L. (2005), “Driver distraction: towards a working definition”, International Conference on Distracted
Driving, Toronto (2–5October 2005). Young, K., Mahfoud, J.M., Stanton, N. A., Salmon, P.M., Jenkins, D.P. & Walker, G.H. (2009), “Conflicts of interest: The implications of roadside advertising for driver attention while driving: Skill and awareness during inspection of the scene”, Transportation Research Part F 12, 381–388. Wallace, B.: “Driver distraction by advertising: Genuine risk or urban myth?”, (2003), Municipal Engineer, 156,
185–190.
LISTED IN THE AHFE DIGITAL BOOKSTORE CATALOGUE
Explore the complete digital volume
Advances in Human Aspects of Transportation: Part II
Read this individual research paper free through the original publisher, or explore the full digital proceedings book.
ISBN 978-1-4951-2098-5
Explore this ISBN in the AHFE Bookstore ↗Listed in the July 2026 bookstore catalogue; search by ISBN to confirm current availability · Digital book purchase optional