Toshihisa Doi, Toshiki Kuroda, Sayaka Noda, Chika Nakatani, Seiji Minami, Satsuki Harada (2026). An Empirical Examination of Optimal Stimulation Theory and Prototype Theory for the Perceived Fit of Chairs in Office Spaces. In: Human Factors and Ergonomics In Design. AHFE Open Access, vol. 210, pp. 81–88. https://doi.org/10.54941/ahfe1007428
This study investigates the psychological mechanisms underlying the perception that a chair “fits into” an office space, focusing on the applicability of Optimal Stimulation Theory and Prototype Theory in environmental psychology. A web-based questionnaire survey was conducted with 100 office workers, using 12 CG-based office space images generated by Adobe Firefly. Participants evaluated the perceived fit of the chair and their impressions of each space using seven-point Likert and semantic differential scales. Because each participant evaluated multiple images, linear mixed-effects models with crossed random effects for participants and images were employed. The perceived fit of the chair was treated as the dependent variable, and impression variables were included as predictors with both linear and quadratic effects. The results showed limited evidence for inverse U-shaped relationships predicted by Optimal Stimulation Theory. In contrast, typicality of chair and predictability demonstrated positive linear effects on perceived fit. These findings suggest that perceived fit is less influenced by optimal stimulation levels and more strongly governed by cognitive fluency and prototype-based evaluation. This exploratory study provides insights into how furniture–space relationships are perceived and offers implications for office furniture and environmental design.
In office space design, whether a chair is perceived as “fitting into” a space is an important issue. Space designers and/or customers sometimes require furniture manufacturers to provide chairs that are perceived as fitting into a given space. However, given the increasing diversity of office environments, it is difficult to derive clear design guidelines for mass-produced, general- purpose chairs with respect to how they should “fit” into various spaces.
To respond to such demands, it is important to clarify what it means for a chair to fit into a space and to identify the factors that contribute to this perception. If the mechanisms underlying the feeling that a chair fits into a space can be understood, this knowledge could be applied to the design of furniture and spatial environments. One theoretical framework Received January 22, 2026; Revised March 31, 2026; Accepted April 14, 2026; Available online July 20, 2026
used to explain how people form impressions of spaces and environments is Optimal Stimulation Theory, proposed by Berlyne (1970). According to this theory, evaluative responses decrease when the level of stimulation is either too low or too high, and are maximized at a moderate level of stimulation, forming an inverted U-shaped relationship. For example, in the context of environmental evaluation, Akalin et al. (2009) conducted an impression evaluation of residential façades and reported an inverted U-shaped relationship between preference and complexity, with moderate levels of complexity being the most preferred. However, on the other hand, it has also been reported that inverted U-shaped relationships are not always observed, even for positive affective responses such as beauty, pleasantness, and liking, depending on the type of affective measure considered (Marin et al., 2016; Marin and Leder, 2013).
In contrast, another framework for explaining environmental evaluation is based on Prototype Theory. Here, a prototype refers to a typical image of a category held by an individual, and stimuli that are closer to this prototype are more easily recalled. For example, when considering the category of birds, many people readily think of sparrows or pigeons, whereas penguins or ostriches are less easily recalled. Applying this idea to environmental evaluation, it has been reported that environments or spaces are evaluated more positively when they are perceived as typical, that is, when they have a high degree of similarity to a prototype (Whitfield, 1983). It has also been suggested that evaluations may be higher when there is a moderate deviation from the prototype (Purcell and Nasar, 1992).
The concept of “fitting into” a space, which is the focus of the present study, is considered to be a subjective sensation related to both the appropriateness of the stimulation level and typicality. Therefore, we considered that the factors contributing to this perception could be examined by using Optimal Stimulation Theory and Prototype Theory as starting points.
Therefore, the present study aims to investigate the psychological mechanisms underlying the perception that a chair fits into an office space. Specifically, we examined whether this perceptual evaluation can be explained by Optimal Stimulation Theory and Prototype Theory, both of which have been widely referenced in environmental psychology research. Two key research questions were addressed: (1) whether the perceived fit of a chair is maximized at an optimal level of stimulation, and (2) whether a chair is perceived as fitting into a space when it closely matches a prototypical image.
METHOD
Participants A web-based questionnaire survey was conducted on 100 workers (mean 44.83 years, SD: 13.50, 50 males and 50 females) recruited via an Internet research company. The participants were workers who worked in an office or a coworking space at least three days per week. All of them lived in Japan and worked in Japan.
An Empirical Examination of Optimal Stimulation Theory and Prototype Theory 83 Questionnaire Survey
In this questionnaire survey, participants were presented with images of office spaces and were asked to evaluate their impressions of these images. Based on a preliminary interview study conducted in advance (Kuroda et al., 2025), the office images were prepared to differ in material appearance, shape, height, and color, which were predicted to be related to the perceived fit between the chair and the space. Because the influence on perceived fit was expected to differ depending on the intended use of the space, the present study limited the stimuli image to office environments. A total of 12 images were presented to the participants, all of which were generated using Adobe Firefly. Examples of the presented images are shown in Figure 1. In this survey, all 100 participants were required to evaluate all 12 images. Thus, a total of 1,200 samples were collected through repeated measurements (100 participants × 12 images).
Figure 1: Examples of presented stimulus images.
Next, the evaluation variables for each image are described as follows. As the dependent variable, the perceived fit between the chair and the space was assessed using a seven-point Likert scale. As independent variables, variables that were considered to influence arousal in spatial evaluation were examined. According to previous research (Motoyama and Hanyu, 2015), factors such as incongruity, novelty, surprise, and complexity are used to consider arousal level. Based on this perspective, items assessing comfort, stimulation, simplicity, predictability, and familiarity of the space were included. In addition, because previous studies (Whitfield, 1983; Purcell and Nasar, 1992) have suggested that environmental evaluation is influenced by prototypes (i.e., typical members within a category), variables assessing the typicality of the space and the typicality of the chair as an office chair were also included. These seven independent variables were measured using seven- point semantic differential (SD) scales. The questionnaire items used in this study are shown in Table 1.
Table 1: Questionnaire items.
Table available in the original PDF paper.
Variables Questionnaire Perceived fit The chair in this image fits well into the space. (7-point Likert scale)
Data Analysis In this study, perceived fit was used as the dependent variable, and the seven variables using SD scale were used as independent variables; all variables were treated as continuous. Because the collected data consisted of repeated measurements in which the same participants evaluated multiple images, linear mixed-effects models were employed, with participants and images treated as random effects. The fixed effects in the model were the seven impression-related variables. To examine whether inverted U-shaped relationships with the dependent variable existed, as suggested by Optimal Stimulation Theory, both linear (first-order) and quadratic (second-order) effects were included. As random effects, random intercepts were specified for participants and for images.
Prior to the analysis, the seven SD scale variables included as fixed effects were mean-centered. Quadratic terms were created after centering. In this analysis, if only the linear term was significant, the relationship was interpreted as a simple linear relationship. If the quadratic term was significant and its coefficient was positive, the relationship with perceived fit was interpreted as U-shaped, whereas a negative coefficient was interpreted as an inverted U-shaped relationship. As a supplementary analysis, separate models including linear and quadratic terms were also estimated for each individual impression variable.
The significance level was set at α = 0.05. All analyses were conducted using R (ver. 4.5.2), and linear mixed-effects models were estimated using the lme4 package.
RESULTS
The correlation coefficients among variables are shown in Table 2.
Table 2: Correlation coefficients among the variables.
Table available in the original PDF paper.
Perceived Fit Comfort Stimul ation Simplicity Predic tability
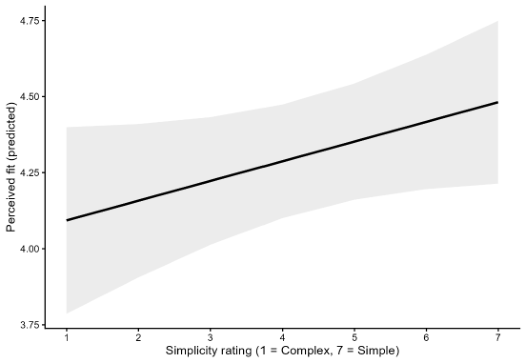
Next, Table 3 presents the estimation results of the linear mixed-effects model in which all fixed effects were included (a total of 14 variables consisting of the linear and quadratic terms of the seven SD scales). The random effects of this model are shown in Table 4. As indices of model fit, the Marginal R² was 0.119, the Conditional R² was 0.417, and the RMSE was 0.949. Additionally, because a significant quadratic term with a small positive coefficient was observed in Simplicity, the predicted curve of perceived fit as a function of Simplicity was plotted (Figure 2).
Table 3: Results of linear mixed-effects model (fixed effect).
Table available in the original PDF paper.
Predictor β SE df t p VIF Comfort (Linear) 0.227 0.038 1182 6.042 <.001 ** 1.478
Table 4: Results of linear mixed- effects model (random effect).
Table available in the original PDF paper.
Group SD Participan 0.682
Image 0.202 Residual 0.995
Figure 2: Predicted relationship between perceived fit and simplicity rating (The solid line represents the fixed-effects prediction, and the shaded area indicates the 95% confidence interval.)
Furthermore, models including only each individual SD scale as a fixed effect were estimated to examine the effect of each variable. In these models, the fixed effects consisted only of the linear and quadratic terms for a single impression variable. Table 5 shows the partial regression coefficients (β) for the linear and quadratic terms obtained from the models estimated separately for each of the seven impression variables.
Table 5: Results of linear mixed-effects models of each impression.
Table available in the original PDF paper.
Model β (Linear) p (Linear) β (Quadratic) p (Quadratic) Comfort 0.24 <.001 0.1 <.01
First, regarding the indices of model fit, the Marginal R² was low, indicating that the explanatory power of the fixed effects included in the present model was limited. When considering the Conditional R², which includes random effects, the model explained approximately 40% of the variance. These results suggest that the seven impression variables included as fixed effects, together with their quadratic terms, provide some explanatory power for perceived fit when random effects are taken into account, but they are not dominant factors.
As shown in Table 2, no pairs of variables exhibited exceptionally strong correlations, and the VIF values shown in Table 3 were all low. Therefore, multicollinearity was not considered to be a problem in the present model, and the results were interpreted based on the estimated values.
Next, with respect to the fixed effects shown in Table 3, Comfort (linear), Simplicity (quadratic), Predictability (linear), and Typicality_chair (linear) were significant. Based on the β coefficients of these variables, perceived fit increased as comfort, predictability, and the typicality of the chair increased. Comfort can be regarded as a comprehensive evaluative indicator. Among all variables, the association between perceived fit and comfort was the strongest, suggesting that, at least in the office environments examined in this study, perceived fit is an important factor in creating comfortable spaces. In addition, the relationships indicating that higher chair typicality and higher predictability lead to higher perceived fit are consistent with the findings of Whitefield (1983), who reported that evaluations become more favorable as similarity to a prototype increases. High chair typicality and high predictability likely indicate greater similarity to participants’ prototypes of office spaces. In other words, office spaces that are easier for participants to predict tend to result in higher perceived fit.
As shown in Table 3, only the quadratic term for Simplicity was significant. However, its β coefficient was small and positive. Even when examining the single-variable models in Table 5, there were no variables for which only the quadratic term was significant. As shown in Figure 2, the present results do not provide clear support for the inverted U-shaped relationship predicted by Optimal Stimulation Theory in the context of perceived fit between chairs and office spaces. It should be noted that the significance of the quadratic term does not necessarily indicate a distinct U-shaped relationship, but rather reflects a slight curvature superimposed on an overall monotonic trend.
Next, regarding the random effects (Table 4), individual differences among participants were larger than differences among images, suggesting that there were substantial differences among participants in how they perceived fit. That is, even when viewing the same image (space), the average evaluations of perceived fit differed considerably across participants. When considered together with the conditional R² results, these individual differences are thought to contribute substantially to the explanatory power of the model. In contrast, differences among images were relatively small; although there were some average differences in evaluation across the 12 images, these differences were not necessarily dominant in the present model.
In summary, the evaluation that a chair fits into a space appears to be influenced more by cognitive processing ease, such as how predictable and typical the space and chair are, rather than being explained by an optimal level of stimulation. However, given the limited explanatory power of the fixed effects alone, it should be noted that these factors are not dominant determinants of perceived fit. Furthermore, because the stimulus images were limited to office spaces and the sample size was restricted to 100 participants, caution is required when generalizing the present findings.
CONCLUSION
In this study, factors contributing to the perception that a chair fits into an office space were examined. Focusing on Optimal Stimulation Theory and Prototype Theory, an exploratory investigation was conducted to determine whether perceived fit could be explained from these perspectives. To this end, linear mixed-effects models were applied to impression evaluation questionnaire data collected using images of office spaces, and the effects of impression-related variables on perceived fit were analyzed. The results showed that perceived fit was higher in spaces that were perceived as more predictable and as having more typical chairs, suggesting a relationship between prototype conformity and perceived fit.
REFERENCES
Akalin, A., Yildirim, K., Wilson, C., Kilicoglu, O. (2009) Architecture and engineering students’ evaluations of house façades: Preference, complexity and impressiveness, Journal of Environmental Psychology, 29, 124–132. Berlyne, D.E. (1970) Novelty, complexity, and hedonic value, Perception &
Psychophysics, 8(5A), 279–286. Kuroda, T., Doi, T., Noda, S., Nakatani, C., Minami, S., Ito, H. (2025) Examination of factors contributing to the perception of office chairs and spaces as “blending in” using the Evaluation Grid Method, 2025 Japan Human Factors and Ergonomics Society Kansai Branch Annual Meeting, 4A–4. (in Japanese) Marin, M.M., Lampatz, A., Wandl, M., Leader, H. (2016) Berlyne Revisited: Evidence
for the multifaceted nature of hedonic tone in the appreciation of paintings and music, Frontiers in Human Neuroscience, 10, 536. Marin, M.M., Leader, H. (2013) Examining complexity across domains: Relating subjective and objective measures of affective environmental scenes, paintings and music, PLOS ONE, 8(8), e72412. Motoyama, Y., Hanyu, K. (2015) The effect of public art on affective appraisals of
urban landscapes, MERA Journal, 17(2), 1–10. (in Japanese) Purcell, A.T., Nasar, J.L. (1992) Experiencing other people’s houses: a model of similarities and differences in environmental experience, Journal of Environmental Psychology, 12(3), 199–211. Whitefield, T.W.A. (1983) Predicting preference for familiar, everyday objects: An
experimental confrontation between two theories of aesthetic behaviour, Journal of Environmental Psychology, 3, 221–237.
LISTED IN THE AHFE DIGITAL BOOKSTORE CATALOGUE
Explore the complete digital volume
Human Factors and Ergonomics In Design
Read this individual research paper free through the original publisher, or explore the full digital proceedings book.
ISBN 978-1-964867-86-1
Explore this ISBN in the AHFE Bookstore ↗Listed in the July 2026 bookstore catalogue; search by ISBN to confirm current availability · Digital book purchase optional