Ye Tian (2025). mHealth Application User Interface Design for Improving Transparency of Healthcare Insurance Spending Progress. In: Human Factors in Design, Engineering, and Computing. AHFE Open Access, vol. 199, pp. 434–440. https://doi.org/10.54941/ahfe1006855
Health insurance terminology is often considered confusing by the general public, which leads to making healthcare decisions based on incomplete understandings. This work explores how mobile interfaces can improve insurance literacy and spending transparency. Through a three-phase study with 26 participants enrolled in employer-sponsored insurance, we examined comprehension of fundamental insurance concepts. Our pilot study identified key confusion points, informing the development of a prototype interface iteratively improved through comparison testing. Results reveal that effective mobile interfaces enhance insurance literacy by separating complex concepts into distinct visual components, providing contextual explanations through strategically placed tooltips, and balancing comprehensive information with progressive disclosure. The final design showed substantial improvements in both cost estimation accuracy and user confidence, demonstrating that thoughtfully designed interfaces can transform abstract insurance concepts into comprehensible frameworks that empower informed healthcare decisions.
In the United States (US), the healthcare system is notoriously complex. Recently, the proliferation of mobile applications (apps) in the healthcare industry has transformed how individuals track and manage their healthcare- related activities (Abernethy et al., 2022). Intuitive and easy-to-navigate user interfaces (UI) have greatly improved information localization and cognitive processing (McCurdie et al., 2012). Currently, mobile health (mHealth) UI design research extensively explores areas like symptom tracking (Lalloo et al., 2019) and chronic disease management (Fu et al., 2016). However, there remains a gap in understanding how individuals can effectively track health insurance spending and comprehend complex insurance terminologies through mobile apps (Schnall et al., 2016).
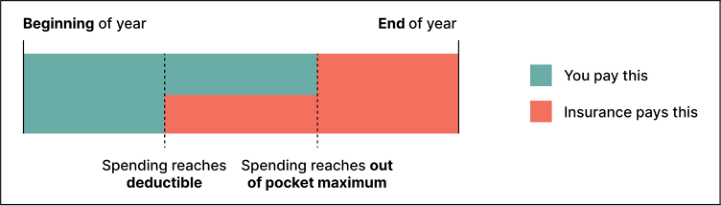
Users face significant challenges in navigating different types of health insurance plans (Bhargava & Loewenstein, 2015). Healthcare terminology such as “deductible” and “out-of-pocket (OOP) maximum” remains confusing to many individuals. Fig. 1 shows a simplified diagram of how the concepts of deductible and OOP maximum in health insurance plans work in the US. Intricate concepts often force users to make healthcare-related
In this work, utilizing the concept of progressive disclosure, we develop a UI design that reimagines how insurance information can be presented such that it empowers users to understand complex insurance terminology while providing tracking mechanisms. Following this goal, we ask two research questions:
RQ1: What artifact is the most understandable format to health insurance holders?
RQ2: How can a mobile UI assist with improving insurance literacy?
To address these two questions, we conducted five preliminary participant interview sessions to identify current user confusion and gaps around health insurance literacy. Then, we proposed a new design solution and validated the effectiveness through two rounds of comparison testing with 21 participants.
Figure 1: Simplified graphic of how insurance plans work in the US.
PILOT STUDY To identify main confusions in understanding insurance contribution mechanisms and determine intuitive presentation formats, i.e., RQ1, we conducted moderated interviews with five participants enrolled in employer- sponsored individual health insurance plans.
Method
Participants were presented with the following healthcare plan:
Deductible in the plan year: $4000
OOP Maximum in the plan year: $7000
Original price for an in-network specialist visit: $200
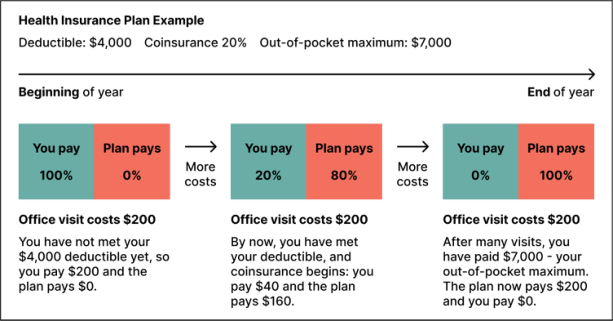
Insurance plan coinsurance for specialist visits: 20% In round 1 of the study, we showed participants a graphical explanation (Fig. 1) of the concepts of deductible, OOP Maximum, and coinsurance. In round 2, we present the participants a text-based example (Fig. 2). We compare how the participants grasps the aforementioned insurance concepts by asking the participants to calculate the payment amount at three different
436 Tian
stages: before meeting deductible (Q1), after meeting the deductible but before reaching OOP maximum (Q2), and after meeting the OOP maximum (Q3). The correct answers are $200, $40, and $0, respectively. Then, we evaluate their understanding of the concepts using the following two metrics:
Figure 2: Detailed graphic of how insurance plans work in the US, incorporating textual explanations.
Result
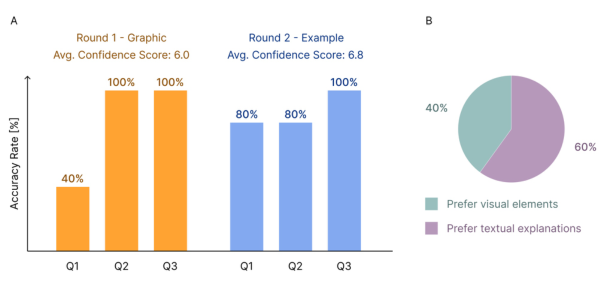
From Fig. 3.A, we can conclude that most of the confusion occurred at stage one (pre-deductible). Text-based examples improved comprehension significantly (40% accuracy rate in Q1 in round 1 vs. 80% in round 2), with confidence scores increasing from 6.0 to 6.8. Both proportional data visualization and textual details proved beneficial. From Fig. 3.B, participants didn’t express strong preferences regarding information format, finding both proportional data visualization and detailed text helpful.
Figure 3: Pilot study results. Plot A shows the accuracy rate after presenting participants with Fig. 1. and Fig. 2. Plot B shows that participants prefer the visual elements and textual explanations in Fig. 2.
mHealth Application User Interface Design for Improving Transparency of Healthcare 437
Design Assumption Based on these insights, we developed a design option incorporating:
Display of the amount already spent
Visual progress bar representation (this simulates the graphic that was presented to participants)
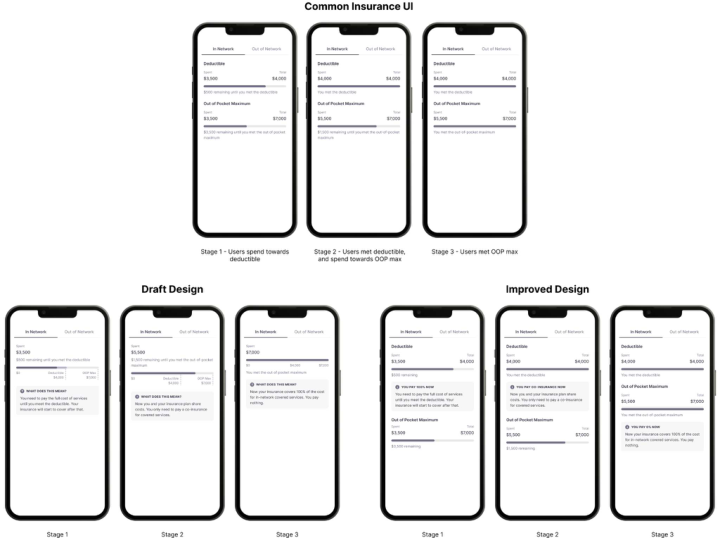
Tooltip message clarifying monetary information and progress (this simulates the text-based example that was presented to participants).
Figure 4: Design evolution: common insurance UI, draft design, and improved design.
DESIGN DRAFT
Method
We conducted a comparison test between the current common insurance solution and our proposed design draft. We recruited 11 participants residing in the US who are currently enrolled in employer-sponsored health insurance plans. The participants were presented with the same scenario and questions as in Section 2.
Result
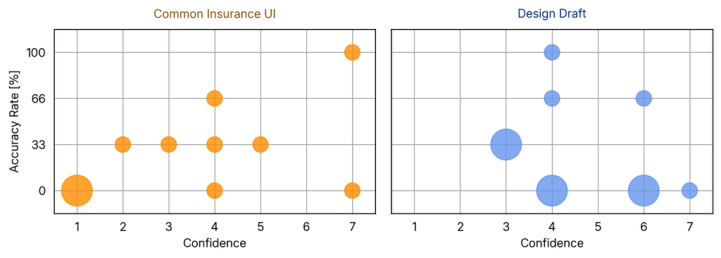
As shown in Fig. 5, our study reveals that comprehension challenges exist in both designs. For the common insurance UI (left plot in Fig. 5), the answers to payment estimates range between $40 and $50. The results for our design draft (right plot in Fig. 5) also demonstrate a large payment estimate range. This result suggests the existence of fundamental difficulties with
438 Tian
understanding insurance cost structures, which transcends interface design. However, the confidence patterns differ between the two designs. For the common insurance UI, we observe a more distributed confidence pattern with varying levels of correctness. However, the results for our design draft show that participants felt more confident when answering spending questions. This suggests that explanatory tooltips enhanced perceived understanding independent of how the data is visualized.
Figure 5: Testing results between the common insurance UI and our draft design. In both figures, the radius of the circles is proportional to the number of participants who have the same confidence-accuracy-rate-pair.
Analysis In addition to the questions listed in Method, we asked the participants their preference between a progressive-disclosure-style design (joint progress bar) or a design that presents all the information upfront (separate progress bars). Based on the testing results and the participant’s answer to this question, we make the following analysis. While progressive disclosure can potentially simplify complex information, in the context of health insurance contribution progress, users value immediate access to complete information even at early contribution stages. The joint progress bar presented in the draft design (Fig. 4) potentially introduced confusion. Future iterations should balance progressive disclosure with comprehensive data visibility.
IMPROVED DESIGN
Method
Based on the findings in Design Draft, we revised the design to maintain separate visual indicators for deductible and OOP maximum while adding contextual tooltips that provide forward-looking guidance about subsequent insurance stages, as shown in Fig. 4. To evaluate the effectiveness of these modifications, we conducted a second comparison test with 10 participants. The testing methodology is consistent with the first round.
Result
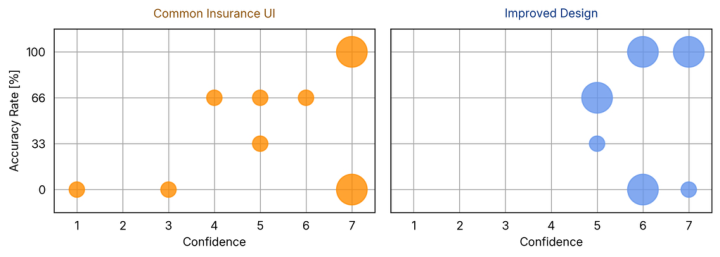
The result of the comparison test between the common insurance UI and the improved design (Fig. 6) demonstrates a notable improvement in confidence mHealth Application User Interface Design for Improving Transparency of Healthcare 439 metrics. Similar to the results shown in Fig. 5, when presented with the common insurance UI (left plot of Fig. 6) and asked about the questions shown in Method, the participants displayed a more distributed confidence pattern with varying levels of correctness. However, after being presented with the improved design, the participants were able to answer the questions with higher confidence. This transformation suggests the improved design effectively enhanced user confidence. Analysis of the scatter plots reveals several significant developments between our draft and improved design, not only a higher confidence score but also a greater accuracy rate in participant response. While the design draft (Fig. 5) showed confidence ratings distributed primarily between values 3–6 with varying accuracy, the improved design results (Fig. 6) exhibit a distinct rightward shift, with confidence ratings concentrated between values 5–7.
Figure 6: Testing results between the common insurance UI and our improved design. The design of this figure follows Fig. 5.
The presence of larger clusters at accuracy rates 66% and 100% suggests the improved design has successfully established a more robust insurance knowledge understanding among participants.
SUMMARY The presented results validate the importance of visual separation between insurance concepts while providing contextual progression guidance. The substantial improvements in accuracy and confidence suggest this approach offers a promising foundation for enhancing transparency in health insurance contribution visualization in mHealth applications. Regarding RQ2, our findings demonstrate that effective mobile interfaces can significantly enhance insurance literacy through: (1) separating complex concepts into distinct visual components rather than merged representations; (2) providing contextual explanations through strategically placed tooltips that clarify current status and future implications; and (3) balancing comprehensive information access with progressive disclosure principles. The marked enhancements confirm that thoughtfully designed mobile interfaces can transform abstract insurance concepts into comprehensible financial frameworks, thereby empowering users to make more informed healthcare decisions.
440 Tian
LIMITATIONS AND FUTURE WORK Several limitations warrant consideration. The relatively small sample size in three testing phases limits the generalizability of our findings. Additionally, our testing focused primarily on employer-sponsored individual insurance plans, and the application of these design principles may vary across different insurance structures (e.g., medicare plans, marketplace plans). Future research should explore the longitudinal impact of these interface improvements on healthcare decision-making behaviors and outcomes. Potential future work also includes an investigation into how these design principles transfer to other complex financial domains, such as retirement planning or mortgage management (Politi et al., 2014).
REFERENCES
Amy Abernethy, Laura Adams, Meredith Barrett, Christine Bechtel, Patricia Brennan, Atul Butte, Judith Faulkner, Elaine Fontaine, Stephen Friedhoff, John Halamka, Michael Howell, Kevin Johnson, Peter Long, Deven McGraw, Redonda Miller, Peter Lee, Jonathan Perlin, Donald Rucker, Lew Sandy, Lucia Savage, Lisa Stump, Paul Tang, Eric Topol, Reed Tuckson, and Kristen Valdes. 2022. The Promise of Digital Health: Then, Now, and the Future. NAM Perspect (2022). Chitra Lalloo, Amos Hundert, Lauren Harris, Quynh Pham, Fiona Campbell,
Jill Chorney, Bruce Dick, Mark Simmonds, Joseph Cafazzo, and Jennifer Stinson. 2019. Capturing Daily Disease Experiences of Adolescents With Chronic Pain: mHealth-Mediated Symptom Tracking. JMIR Mhealth Uhealth 7, 1 (2019), e11838. George Loewenstein, Joelle Y Friedman, Barbara McGill, Sarah Ahmad, Suzanne Linck, Stacey Sinkula, John Beshears, James J Choi, Jonathan Kolstad, David Laibson, Brigitte C Madrian, John A List, and Kevin G Volpp. 2013. Consumers’ misunderstanding of health insurance. Journal of Health Economics 32, 5 (2013), 850–862. Mary C. Politi, Kimberly A. Kaphingst, Matthew Kreuter, Enbal Shacham, Melissa C. Lovell, and Timothy McBride. 2014. Knowledge of Health Insurance Terminology and Details Among the Uninsured. Medical Care Research and Review 71, 1 (2014), 85–98. Mei R. Fu, Deborah Axelrod, Amber A. Guth, Kavita Rampertaap, Nardin El-Shammaa, Karen Hiotis, Joan Scagliola, Gary Yu, and Yao Wang. 2016. mHealth self-care interventions: Managing symptoms following breast cancer treatment. mHealth 2, 7 (2016). Rebecca Schnall, Marlene Rojas, Suzanne Bakken, William Brown, Alex Carballo-Dieguez, Monique Carry, Deborah Gelaude, Jocelyn Patterson Mosley, and Jasmine Travers. 2016. A user-centered model for designing consumer mobile health (mHealth) applications (apps). Journal of Biomedical Informatics 60 (2016), 243–251. Saurabh Bhargava and George Loewenstein. 2015. Choosing a Health Insurance Plan: Complexity and Consequences. The Journal of the American Medical Association 314, 23 (2015), 2505–2506. Tara McCurdie, Svetlena Taneva, Mark Casselman, Melanie Yeung, Cassie McDaniel, Wayne Ho, and Joseph Cafazzo. 2012. mHealth Consumer Apps: The Case for User-Centered Design. Biomedical Instrumentation & Technology 46, s2 (2012), 49–56.
LISTED IN THE AHFE DIGITAL BOOKSTORE CATALOGUE
Explore the complete digital volume
Human Factors in Design, Engineering, and Computing
Read this individual research paper free through the original publisher, or explore the full digital proceedings book.
ISBN 978-1-964867-75-5
Explore this ISBN in the AHFE Bookstore ↗Listed in the July 2026 bookstore catalogue; search by ISBN to confirm current availability · Digital book purchase optional