Yang Cai, Shuheng Cao, Kevin Do, William C. Holland, Kaytee Pokrzywinski, Richard Stumpf (2025). Mobile Vision for Algal Bloom Probe. In: Training, Education, and Learning Sciences. AHFE Open Access, vol. 193, pp. 145–151. https://doi.org/10.54941/ahfe1006655
Rapidly growing mobile phone sensing and computing capacities create wonderful opportunities for environment monitoring and data analysis. Mobile vision combines digital cameras and machine vision algorithms on phone platforms for particular visual data analysis. We explore the phone "microscopy" with real-time machine vision computing and dynamic visual updating functions. We developed a semantic description of the shape and dynamics of the toxic algae Karenia Brevis, collected by phone, that both humans and machines can understand. We also explore the system architecture of the mobile vision modules, along with their performance measurements.
Today’s mobile phones are much more powerful than the computer on NASA’s Apollo 11 that landed on the Moon on July 20, 1969. The Apollo Guidance Computer (AGC) had only 36 KB of RAM and 2 KB of ROM, powered at 55 watts, and weighed 90 pounds (Hall, 1996). The AGC had the interfaces for display and keyboard (DSKY), Inertial Motion Unit (IMU), Rendezvous Radar (RR), Landing Radar (LM), Telemetry Receiver, Engine Command, and Reaction Control System. The computer’s performance was comparable to the first generation of home computers from the late 1970s, such as Apple II, TRS-80, and Commodore PET, which was sufficient for real-time navigation and control of the lunar module.
Contemporary mobile phones have much more computing power than the AGC and interfaces to sensors and communications such as imaging, Bluetooth, and WiFi. Machine vision and pattern recognition algorithms enable mobile phones to recognize handwriting, words, animals, plants, faces, gaits, vehicles, and multispectral objects in near-infrared, infrared, or ultrasound. We can call this technical development “mobile vision”, which enables mobile phone users to collect field data, process the data on the phone, and share the information among users. It has a broader impact on environmental protection, education, learning, and training, especially for students and adults who are into nature and the sciences, which empowers a
curious citizen to pursue scientific discovery, communication, and situation awareness for the community.
Here, we explore phone “microscopy” with real-time machine vision computing and dynamic visual updating functions. We developed a semantic description of the shape and trajectory of the toxic algae Karenia Brevis, collected by phone, that both humans and machines can understand. We also explore the system architecture of the mobile vision modules with performance measurements.
SEMANTIC SHAPE DESCRIPTION For thousands of years, people have invented languages to describe shapes. The ancient Egyptians developed the pictorial language Hieroglyphs and ancient Chinese created the pictorial language Oracle (Cai, 2017). These verbal and symbolic descriptions are semantic and subjective. They were not scientifically accurate until philosophers and scientists looked into the descriptions. For example, the Greek philosopher Pythagoras, born around 570 BC introduced the Pythagorean theorem, a fundamental relation in Euclidean geometry between the three sides of a right triangle (Sally and Sally, 2007). The Dutch businessman Antonie van Leeuwenhoek in the 17th century made over 500 microscopes, many with a magnification far superior to contemporary models. His discoveries include bacteria, protozoa, red blood cells, spermatozoa, and how minute insects and parasites reproduce (Cartwright, 2023; Cai, 2015). His day job was as a draper and a minor municipal officer in Delft, Netherlands. In his work inspecting cloth, he needed magnifying glasses. He used microscopes to show microorganisms that are invisible to our bare eyes.
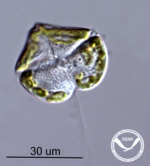
Harmful algal blooms (HABs) cause significant ecological, economic, and human health problems in marine, estuarine, and freshwater environments around the globe. There are a variety of phytoplankton that produce these blooms in both freshwater and marine environments. Protecting people and economies requires active and distributed monitoring to detect, characterize, and forecast these blooms. Thanks to high-powered microscopes, we can identify the specific types of algae that cause each HAB. Here we focus on K. brevis, the causative organism responsible for red tide events along the US Gulf Coast. Figure 1 shows the microscopic images of these species.
Figure 1: From left to right: microscopic images of K. brevis the organism responsible for persistent and widespread red tide events along the US Gulf Coast (Photo credit: M. Vandersea, NOAA).
Mobile Vision for Algal Bloom Probe 147
We can see that they have a distinct shape and flagella for motility. When human analysts observe the samples under a microscope, they intuitively connect the shapes to words: round disks, spirals, and straight lines, which are convenient to detect, track, classify, remember, and communicate with others. As routine work, they need to identify the type of species, track their movements, and count them, which is a cognitively challenging task, and only feasible by taxonomically trained experts with access to specialized high-powered microscopes.
Prevailing Machine Learning (ML) or Artificial Intelligence (AI) algorithms, such as Yolo (Yolo, 2025), apply biomorphic multilayer neural networks to process massive training data. For video or image (frame by frame) processing, the ML/AI algorithms usually require manual object annotation for the training data; for example, manually highlighting the shape of K. brevis cells in the microscopic images and feeding the annotated images to the model as training samples. The ML/AI model would run an intensive training-testing process to reach a working model. This approach has several weaknesses: first, it is a “black box” that lacks transparency to the users about the detection, classification, and tracking mechanisms. When the model fails, the developer or the user doesn’t know how to fix it. Second, the results are sensitive to the quality and breadth of available training data. When the sampling conditions change, the model has to be retrained to verify accuracy and improve classification. Third, ML/AI models normally are CPU- or GPU-intensive computing processes that might hinder operation in the field, for example, at the coast or on a boat.
On the other hand, machine vision is a significant branch of AI, advancing the rapid development of mobile robotics, augmented reality (AR), and spatial computing. For decades, machine vision algorithms have bridged semantic shape descriptions and computational models (Sonka et al., 1999).
Pre-processing We start with preprocessing each frame in a ∼30 seconds microscopic video. Each video frame is first converted from color to grayscale to reduce computational complexity and simplify subsequent processing. A normalized convolution filter 3 × 3 is applied to the grayscale image to smooth out the noise and enhance the local features. The smoothed images are then thresholded using fixed intensity values to produce a binary image that emphasizes the objects of interest. A dilation operation with a 5 × 5 kernel is performed over multiple iterations to bridge the small gaps in the binary regions. Finally, edge information is extracted via Canny edge detection, which produces a robust edge map for contour extraction. The output of the Canny edge detector is used with OpenCV’s findContours function to extract contours from the frame. To reduce false positives caused by noise, only contours with an area exceeding a small threshold (e.g., 10 pixels) are retained. This results in a set of candidate contours that delineate potential shapes within the frame.
Shape Description We use the following shape descriptions for the microscopic videos:
Equation reproduced from the original PDF.
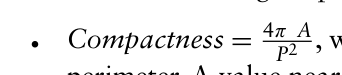
P2 , where A is the area of the shape and P is the area’s perimeter. A value near 1 indicates an ideal circle.
PN
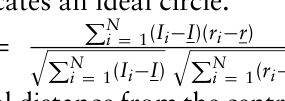
Radial Intensity Correlation =
, where Ii is the
Equation reproduced from the original PDF.Equation reproduced from the original PDF.
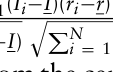
intensity of pixel i, ri is its radial distance from the centroid, I and r are the mean intensity and mean radial distance, respectively. It is the correlation between pixel intensities within the contour and their radial distances from the centroid of the contour. A high correlation indicates a radially symmetric intensity profile.
q PN
Curvature Variability(σκ) =
1 N−1
i (κ(si) −κ)2, where κ(si) is the curvature at point, s is the arc-length parameter and κ is average curvature. It indicates the standard deviation of the local curvature (estimated from differences in adjacent tangent angles) is calculated. A lower standard deviation implies a smoother boundary.
Equation reproduced from the original PDF.
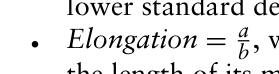
b, where a is the length of the ellipse’s major axis and b is the length of its minor axis. By fitting an ellipse to the contour, the ratio of the major to minor axes is determined. Ratios close to unity indicate a nearly circular shape.
Convexity = AContour
Ahull , where AContour is the area of the contour and Ahull is the area of its convex hull. It is measured as the ratio of the contour area to its convex hull area. A ratio near 1 suggests a highly convex shape.
The shape descriptors classify each contour into two groups: Karena Brevis or background features.
IMPLEMENTATION This project is designed to use a smartphone to record videos from a microscope with the sample from the coast, intended to be implemented into a citizen science program operated through a partnership between NOAA’s National Centers for Coastal Ocean Science (NCCOS) and the IOOS Gulf Coast Ocean Observing System(GCOOS). The results of which will be used in the NOAA-NCCOS HAB Respiratory Intensification Forecast.
The developed mobile vision software processes the video on the smartphone to determine the cell types, track the relevant cells, and count them at each frame of the video. Using a mobile phone to record a video from the microscope is practical with many contemporary mobile phones, such as Android and iPhone. However, it is often challenging to implement machine vision algorithms on mobile platforms because of multiple operating systems, multiple languages, and compatibility issues for machine vision libraries. Ideally, we might use a cloud computing server to run a single machine vision software, but it needs a broader band Internet service provider for transmitting video data and sustainable computing resources for a large group of users simultaneously. Google’s CoLab is a potential solution in
Mobile Vision for Algal Bloom Probe 149
Python code on a virtual machine from mobile phones. However, it requires a subscription for efficient computing tasks (CoLab, 2025).
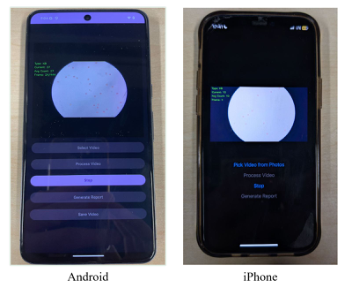
Here, we focus on implementing two mobile phone systems: Android and iPhone. We started with Java for Android phones and Swift for iPhones. In the current prototypes, the user interface is simple: The user selects the sample video from the photo folder and then presses the “Processing” button. The screen displays the frame-by-frame cell type and cell counting results in real time. After the video analysis is completed, the user can generate an analysis report and/or the resulting video with the detected HAB cells.
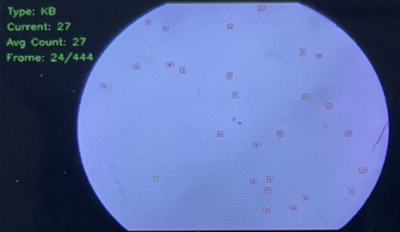
Figure 2: Detected Karenia Brevis cells are highlighted in red contours. Each frame contains detected cell types, the current Karenia Brevis cell count, and the frame sequence number.
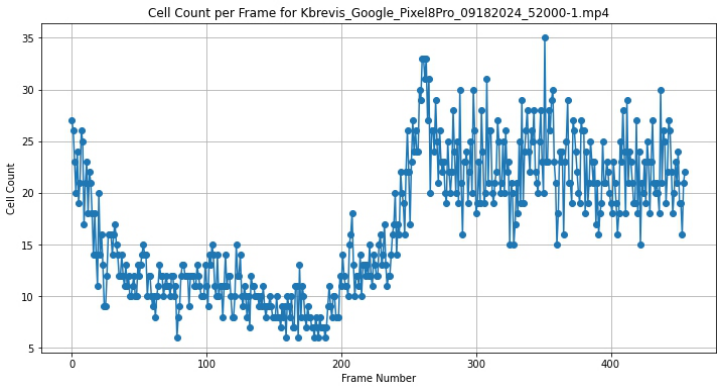
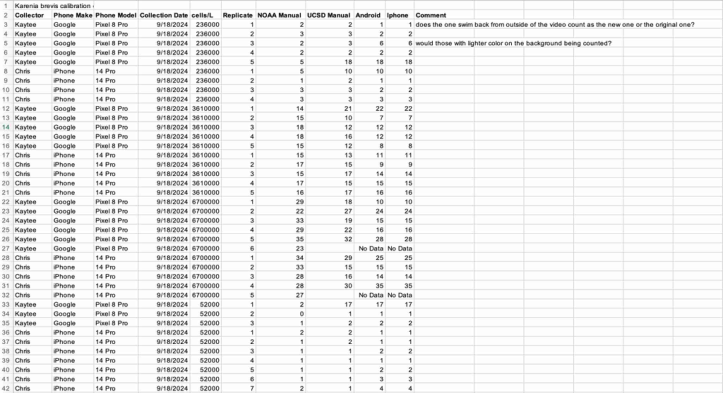
PRELIMINARY RESULTS We have tested about 100 sample videos collected from Android and iPhones. Each video is around 30 seconds at 30 frames per second in high resolution. Figure 4 is the frame-by-frame cell count data results from a sample video. Figure 5 is the summary sheet of the cell count results by mobile phones and by human analysts. We found that Android phones and iPhones have different lighting mechanisms and frame shapes. We have developed an adjustment function to adapt to the variations.
Figure 3: Screenshots of the Android and iPhone apps with two languages.Figure 4: The frame-by-frame cell count data from a sample video.Figure 5: The average cell count results from mobile phones compared to the human analysts’ cell counts.
CONCLUSION
Mobile phone sensing and computing capacities create wonderful opportunities for environmental monitoring and data analysis. Mobile vision combines digital cameras and machine vision algorithms on phone platforms for particular visual data analysis. We explore the phone “microscopy” with real-time machine vision computing and dynamic visual updating functions. We have developed a semantic description of the shape and dynamics of the toxic algae Karenia Brevis that humans and machines can understand. We also explored the system architecture of the mobile vision modules with the performance measurements. Our preliminary results show that it is possible
Mobile Vision for Algal Bloom Probe 151
to process the microscopic video data on mobile phones and to generate analytical reports.
Our experience indicates that graphical user interfaces can be optimized for efficiency. For example, the screen resulting from live video processing can be maximized in horizontal orientation, and the buttons on a command window can be shrunk. Visualizing the mobile vision results frame-by-frame is useful for validation. Furthermore, we plan to implement the GPS mapping functionality to visualize the sample collection location and the HAB alert level on the phone.
ACKNOWLEDGMENT
We thank NOAA for the award and field data collection. We also thank Talia Perez of UCSD for her support, Flavia Cavaliere of UCSD for her help with editing, Professor Mel Siegel of Carnegie Mellon University, and Scott Ledgerwood of NIST for their expertise and advice.
REFERENCES
Bradski, G. and Kaehler, A. (2008). Learning OpenCV, O’Reilly. Cai, Y. (2015). Ambient Diagnostics. CRC Press, Taylor & Francis Publication. Cai, Y. (2017). Instinctive Computing. Springer-London. Cartwright, M. (2023) Antonie van Leeuwenhoek https://www.worldhistory.org/A ntonie_van_Leeuwenhoek/. CoLab (2025). https://colab.research.google.com/. Hall, E. C. (1996). Journey to the Moon: The History of the Apollo Guidance
Computer. Reston, Virginia, USA: AIAA, p. 196, ISBN 1-56347-185-X. Sally, J. D. and Sally, P. (2007). Chapter 3: Pythagorean triples. Roots to Research: A Vertical Development of Mathematical Problems. American Mathematical Society Bookstore. p. 63. ISBN 978-0-8218-4403-8. Sonka, M. Hlavac, V. and Boyle, R. (1999). Image Processing, Analysis, and Machine
Vision, second edition, Books/Cole Publishing Company. Yolo (2025) Yolo. https://pjreddie.com/darknet/yolo/.
LISTED IN THE AHFE DIGITAL BOOKSTORE CATALOGUE
Explore the complete digital volume
Training, Education, and Learning Sciences
Read this individual research paper free through the original publisher, or explore the full digital proceedings book.
ISBN 978-1-964867-69-4
Explore this ISBN in the AHFE Bookstore ↗Listed in the July 2026 bookstore catalogue; search by ISBN to confirm current availability · Digital book purchase optional