Jun Otsuka, Wonseok Yang (2025). The Influence of the Perception of Visualized Data on Service Usability. In: Interdisciplinary Practice in Industrial Design. AHFE Open Access, vol. 183, pp. 8–18. https://doi.org/10.54941/ahfe1006422
With the spread of the Internet, all types of individuals come into contact with data on a daily basis and are required to correctly select, perceive, and utilize the data. In the residential environment, smart homes are accelerating, and the integrated management of devices and appliances in homes has become easier through apps and touch panels. However, in current smart home system management platforms, information is not presented appropriately for the purpose of using the system and devices. In addition, the presented data are complex, as they are a composite of data from different scales, making them difficult to perceive consistently. The presentation of Visualized Data for smart home management is often intended to promote energy and power savings. However, the “rebound effect,” where reduced energy costs lead to increased consumption, remains problematic. To address this, Visualized Data must be continuously perceived. Therefore, this research aims to classify the ease of perception of data and to examine methods of visualizing data to promote continuous perception. The survey revealed that concise and clear data with appropriate context or highlighted elements are easier to perceive.
The digitization of information has led to the collection and visualization of various types of information and vast amounts of data from the ecosystem, industry, and daily life (Suzuki and Suzumura, 2015). With the spread of the Internet, all types of individuals come into contact with data on a daily basis and all people are required to perceive and utilize the data correctly (Chantel et al., 2015). In the residential environment, smart homes are accelerating, and the integrated management of devices and appliances in homes has become easier through apps and touch panels (Baba, 2024). However, in current smart home system management platforms, information is not appropriately presented to align with the overall service context or the user’s purpose of use, often remaining in the form of direct numerical visualizations (Shiraishi, 2009). Additionally, the data presented are often complex, as they consist of a composite of different scales, such as time-series data, numerical data, and categorical data. This complexity leads to variations in how users interpret the data, making it difficult for them to perceive and utilize the information effectively. This implies that data are interpreted differently by different users and are difficult to perceive (Suzuki and Suzumura, 2015).
The Influence of the Perception of Visualized Data on Service Usability 9
In addition, the presentation of Visualized Data for smart home management is often intended to promote energy and power savings (Latha et al., 2014). However, while energy-saving effects are expected, the problem of the “rebound effect” has been pointed out. The rebound effect is a phenomenon in which a reduction in energy costs stimulates consumption behavior, resulting in a reduction in the energy-saving effect (Mizobuchi, 2020). Iwata et al. (2019) stated that, to suppress the rebound effect, it is necessary to design a mechanism that allows continuous viewing of Visualized Data and effective information provision. Furthermore, Aoki et al. (2013) stated that the persistence of pro- environmental behaviors, such as energy and power savings, is influenced by the perception of the behavior. Based on the above, by investigating methods of visualizing easily perceivable data in a smart home integrated management system, we can explore ways to encourage environmentally conscious behavior and help realize a sustainable society. Therefore, the purpose of this research is to classify data with respect to ease of perception and to examine methods of data visualization to promote the continuous perception of data.
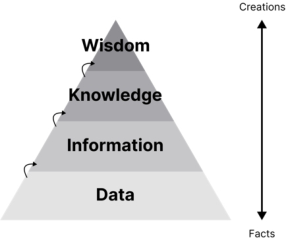
Data Semantic Model The DIKW (Data, Information, Knowledge, Wisdom) model is a framework for humans to perceive and make sense of data. This model is a pyramid diagram of the steps involved in sublimating the data into wisdom (Figure 1).
Figure 1: Hierarchy of wisdom: representation of DIKW hierarchy (Jennifer, 2007).
“Data” refers to the raw data collected. “Information” refers to the data that have been organized, analyzed, and developed into a form that can be interpreted for the user’s use. Data visualization was used to transform the data into information. “Knowledge” is the know-how and understanding gained from “Information.” “Information” is transformed into “Knowledge”when the overlap with the user’s attributes and experiences occurs. “Wisdom” is the obtained “Knowledge” that has become a universal awareness among many individuals. For users to perceive the Visualized Data in a smart home management system, it is necessary to sublimate the “Data” into “Knowledge.” Therefore, it is necessary to present “Information” that is appropriate for users. In addition, appropriate visualization is important for data perception.
10 Otsuka and Yang
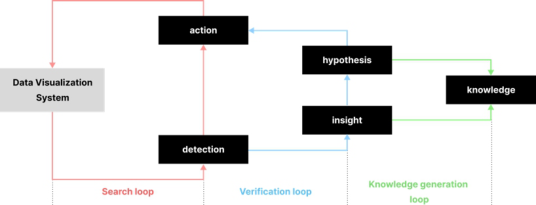
Cognitive Process of Visualized Data It was found that there are three loop stages in the perception of the Visualized Data (Christian and Heidrun, 2020). In the exploratory loop, users gain insights and discoveries from the Visualized Data through data manipulation and exploratory actions. In the verification loop, confirmation is obtained based on the suggestions gained from the exploration loop. As new insights are acquired, the existing hypotheses are either confirmed or rejected or new hypotheses are formed. In the knowledge-generation loop, the results obtained in the verification loop are used to confirm whether they could be used to solve problems in the field (Figure 2).
Figure 2: Knowledge generation model for visual analysis (Yamazaki, 2024).
For the data to be perceived, it is necessary to sublimate it to “Knowledge,” which refers to know-how and understanding from the DIKW model, and it is essential to reach the knowledge-generation loop in the knowledge- generation model of visual analysis. Therefore, it is believed that the visualization of data can promote perception by supporting the four elements of “Discovery,” “Action,” “Insight,” and “Hypothesis.”
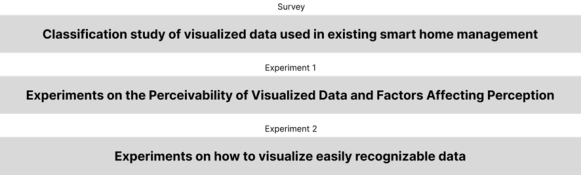
RESEARCH METHOD First, we conducted a classification survey of the Visualized Data presented in the existing smart home management systems. Next, an experiment was conducted to examine the ease of perception of these data and the factors that influenced perception. Finally, we conducted an experiment to visualize the data that were easy to perceive (Figure 3).
Figure 3: Experimental procedure.
The Influence of the Perception of Visualized Data on Service Usability 11
A Survey of Data Classification in Smart Home Management System To identify the current state of the data used in existing smart home management systems, the data presented in applications and tablets in the home environment and home appliance fields were classified. Data were extracted from 553 screens of 67 services from the Apple Store and the official website of the service.
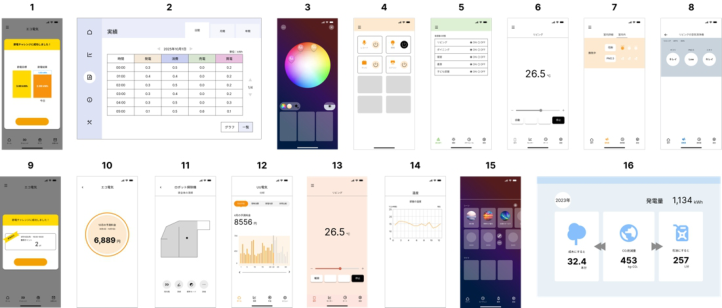
Experiments on the Ease of Perceiving Visualized Data and Factors Affecting Perception To determine the ease of perceiving the data presented in the existing smart home management systems and the factors that influence data perception, we selected 16 samples from Survey 1 and surveyed 30 individuals (Figure 4).
Figure 4: Samples used in the experiment.
1) Hypothesizing the ease of perception of Visualized Data To formulate the hypotheses on the perceived ease of perceiving Visualized Data, 16 samples were evaluated on five items related to cognitive load, and quantification triads were conducted. The five items were “amount of information,” “emphasis,” “coexistence of verbal and visual elements,” “categorization,” and “abstraction,” referring to the law of reducing the extraneous cognitive load and intrinsic cognitive load (Logan and Richard, 2021). “Informational content” was rated on a 3-point scale, referring to Miller’s rule (George, 1956). Categorization was rated on a 3-point scale whereas emphasis, coexistence of verbal and visual elements, and abstraction were rated on a 2-point scale. Items related to germane cognitive load were excluded since they were not considered evaluable.
2) Questions to measure the perceived ease of Visualized Data and its factors Sixteen samples were asked questions about ease of perception and questions about their experience and impressions of the sample, respectively.
The ease of perceiving the sample was measured by asking questions referring to the SEQ (Single Ease Question) centered on whether the respondents could reflect on their next action and then asking them to
12 Otsuka and Yang
describe what they perceived (Lewis, 2009)(Miyake, 2015). For the SEQ- referenced questions, the participants were asked to rate the degree of difficulty in taking the next action after looking at the data. The ratings were made using a 7-point Likert scale ranging from “very difficult” to “very easy.”
The sample’s experiences and impressions were measured using a 5-point Likert scale with 18 items based on the SUS, NASA-TLX, and the Law of Reducing Cognitive Load. The 18 items were: “I have seen similar data,” “I have many opportunities to use this data in my work; schoolwork; and other daily activities,” “I feel confident working with this data,” “I feel that this data is more complex than it needs to be,” “I feel that this data is organized,” “I feel that this data is necessary information,” “I have many opportunities to use this data in my daily life,” “I can confidently work with this data,” “I feel that this data is more complex than necessary,” “I feel that this data is well organized,” “This data appears abstract,” “I feel that this data lacks necessary information,” “I feel that various representations of the data feel integrated,” “I think that there are too many inconsistencies in this data,” “The visual design of this data is attractive,” “I can interpret this data quickly,” “It takes less effort to interpret this data,” and “I feel uneasy or confused about this data.”
Other questions regarding the participants’ attributes and data literacy/ information literacy were asked. Owing to the large number of questions, the survey was divided into two sessions of eight samples each to avoid subject fatigue. The sample was designed using Figma.
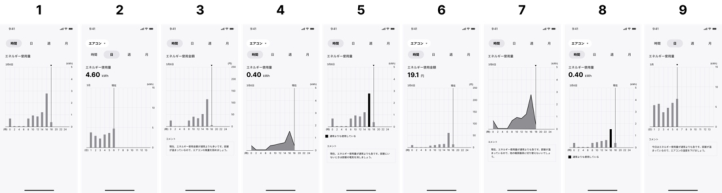
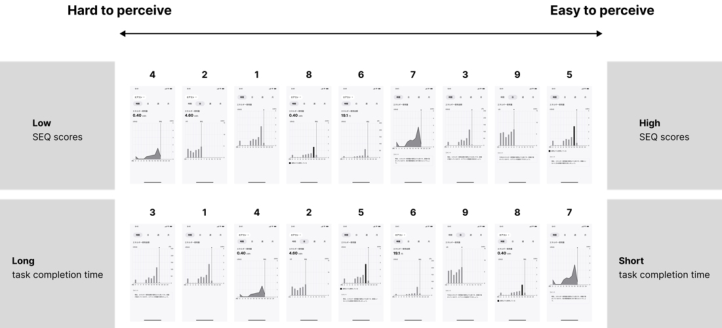
Experiments on How to Visualize Easily Perceivable Data To clarify how to visualize the data in a manner that was easy to perceive, 9 samples were shown, and 30 people were surveyed. The samples were based on the energy usage data presented in the smart home integrated management system, which showed less perceivable results than that in Experiment 2. This sample was created by multiplying the base energy consumption sample and the base sample by four factors related to “brevity and clarity” (low cognitive load) and two factors related to “no excess or deficiency of information,” which were found to affect the ease of perception in Experiment 2. The factors related to “conciseness and clarity” (low cognitive load) were “reducing the granularity of information,” “replacing the information with something familiar (amount of money),” “changing figures,” and “emphasizing” while the factors related to “no excess or shortage of information” were “adding additional information” and “adding context.” Factors related to experience were excluded because they vary from person-to-person (Figure 5). The sample was designed in Figma to ensure that it was similar to LG ThinQ.
Six questions were asked of each of the nine samples. 1) Questions related to the perceived ease of Visualized Data
The ease of perceiving the sample was measured by asking the same questions as in Experiment 2 and measuring the task completion time. The
The Influence of the Perception of Visualized Data on Service Usability 13
task completion time was defined as the time from showing the sample to the start of typing.
2) Ongoing Data Awareness Questions
Continuous perception of the sample was measured using a 5-point Likert scale method with 3 items, “I want to use this data frequently,” “This data is useful in my daily life,” and “I will never look at this data again,” referring to the SUS (System Usability Scale).
To prevent confusion due to the similarity of the samples, the survey was conducted twice: once with five samples and once with four samples.
Figure 5: Sample combination of factors affecting ease of perception.
RESULTS AND CONSIDERATION Results of a Survey of Data Classification in Smart Home Management System
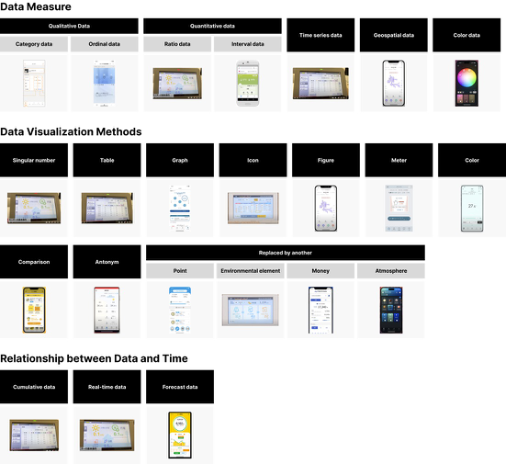
The data displayed in the UI could be classified by scale, visualization method, and relationship to time (Figure 6).
From these, we created 16 samples covering all classifications.
Experiments on the Ease of Perceiving Visualized Data and Factors Affecting Perception
1) Hypothesis of ease of perception of Visualized Data Based on the results of the quantification triad conducted to characterize the data, the number of components was determined to be in the top two components due to their cumulative contribution of approximately 50% (Table 1).
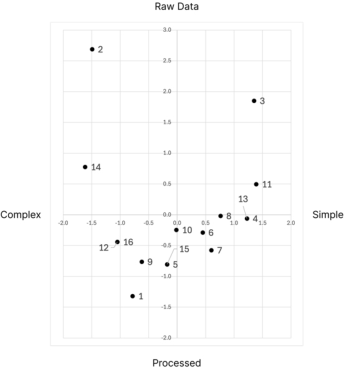
The category scores for Components 1 and 2 were mapped and found to be “raw data-processed” on the vertical axis and “complex-simple” on the
14 Otsuka and Yang
horizontal axis. Sample scores were mapped and referenced to the category score map (Figure 7).
Figure 6: Classification of data in smart home management system.Figure 7: Sample score map for ease of perception.
The second quadrant, which was “raw data and complex,” was less likely to be perceived, and the fourth quadrant, which was “processed and simple,” was more likely to be perceived; therefore, we arranged them in that order and formulated a hypothesis.
2) Results of ease of perception of Visualized Data and Factors that Influence it
The Influence of the Perception of Visualized Data on Service Usability 15
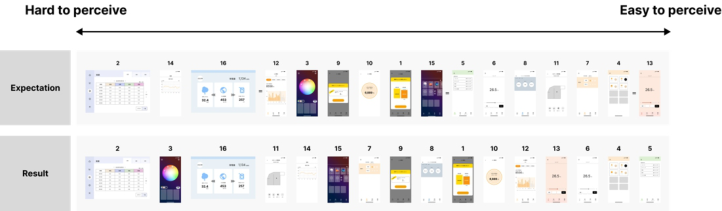
To clarify the ease of perception for each sample, we calculated the mean of the SEQ scores obtained in the experiment and arranged them in score order (Figure 8).
Figure 8: Comparison of sample perceived ease of perception predictions and results.
The higher the score, the easier it was to perceive, and the lower the score, the harder it was to perceive. A comparison of the results with the predictions showed that the rankings were different. In particular, samples 11, 3, and 7 were much more challenging to perceive than expected. This may be owing to the fact that the data were more abstract than the descriptions of the perceived contents, which made them difficult to understand. Sample 12 was considerably easier to perceive than expected. This is because the respondents were able to compare and consider the data relatively more easily than when describing the perceived content. Next, an analysis was conducted to identify the factors affecting the perception of the Visualized Data. During the analysis, questions with reversed items had reversed scores. From the correlation analysis between the questions, multiple clusters of correlations were identified; therefore, a factor analysis was deemed appropriate. The factors were employed up to the second factor with eigenvalues greater than 1.0. Factor 1 was interpreted as conciseness, clarity (low cognitive load), and experienced value whereas Factor 2 was interpreted as not having excessive or insufficient information and having experienced value (Table 2). These results suggest that experience, cognitive load, and lack of information affect the perception of the Visualized Data.
Table 2: Factor loadings per question.
Table available in the original PDF paper.
Factor 2: No Excess or Deficiency of Questions Used in Factor Analysis Factor 1: Conciseness and Clarity, Experienced
Information, Experienced
I have less burden to interpret this data. 0.962 I can interpret this data quickly. 0.959 I think this data is straightforward. 0.939 I don’t feel uneasy or confused about this data. 0.937 I feel that the different views of this data are
0.876
integrated.
I can confidently work with this data. 0.840
Continued
16 Otsuka and Yang
Table 2: Continued
Table available in the original PDF paper.
Factor 2: No Excess or Deficiency of Questions Used in Factor Analysis Factor 1: Conciseness and Clarity, Experienced
Information, Experienced I feel like this data is organized. 0.803 0.462 I have seen similar data. 0.725 0.456 I often use this data in my daily work and
0.658 0.515
academic life.
I find the visual design of this data attractive. 0.566 −0.627 I get the impression that this data is specific. 0.940 I feel this data is sufficient information for my
0.847
needs.
I find this data to be consistent. 0.639 0.671
Experimental Results on Visualization Methods for Perceivable Data
1) Relationship between perceived ease of Visualized Data results and task completion time The trends in the SEQ score results indicate that the data with added context and data with portions of the data highlighted were easier to perceive whereas data with data that changed from bar to area graphs were more difficult to perceive. Adding context to the data can clarify the interpretation of the data and the next action, which may have facilitated perception because of the cognitive guidelines provided by the context. Highlighting a portion of the data can limit the portion of the data to be read, thereby lowering the cognitive load, which is thought to have facilitated cognition. Changing the data from a bar graph to an area graph could have changed the way that the data were viewed; however, this would have made it more difficult to perceive because it would have made it impossible to interpret the data appropriately. Next, to clarify the cognitive ease of the Visualized Data, we calculated and ranked the mean SEQ scores and task completion times obtained from the survey (Figure 9). The higher the score and shorter the task completion time, the easier it was to perceive; the lower the score and longer the task completion time, the harder it was to perceive (Jeff and James, 2009). The ease of perceiving the data inferred from the SEQ scores and task completion times were rather different. Furthermore, a correlation analysis between the SEQ scores and the task completion time revealed that there was no correlation at r = −0.22. Although it is generally known that a relationship of r = 0.5 between SEQ scores and task completion time exists, the lack of similar results suggests a problem with the measurement of task completion time (Jeff and James, 2009). Specifically, we believe that the time required for perception could not be properly measured because multiple people were thinking about what to perceive while typing.
2) Relationship between the results of the ease of perceiving Visualized Data and the degree of ongoing perception.
The Influence of the Perception of Visualized Data on Service Usability 17
Figure 9: Ease of perception inferred from SEQ scores and task completion time.
Correlation analysis was conducted to determine the relationship between the ease of perceiving the Visualized Data and the degree of ongoing perception. The degree of ongoing cognition was defined as the sum of the average scores of the three questions for each sample. A strong correlation of r = 0.90 was found between the perceived ease of perceiving the Visualized Data and the ongoing perception. This suggests that the perceived ease of perception influences continued perception.
CONCLUSION
The current state of the Visualized Data in the smart home management system was identified. It was also found that adding context to the data and emphasizing the data made the Visualized Data more perceivable and promoted continued perception of the data. Based on the knowledge generation model of visual analysis, it can be considered that adding context and emphasizing the data supports the processes of “discovery,” “insight,” and “hypothesis”and facilitates reaching the “knowledge”stage. Meanwhile, the Visualized Data presented in a smart home should leave room for people to explore freely because the information sought by each user differs. In other words, it is desirable to present information that supports the perception of the data rather than providing a specific message through data visualization. The “action” process could not be thoroughly examined in this study due to the lack of incorporation of movement or manipulation. Nonetheless, future research could explore the integration of interactive elements to enhance user engagement and facilitate a more comprehensive understanding of the data. Such advancements may contribute to promoting continuous perception and effective utilization of Visualized Data.
18 Otsuka and Yang
REFERENCES
Aoki, E. (2013), “Exploratory psychological models for various environmentally conscious behaviors”, Exploring Determinants and Models of Citizen’s Environmental Beaviors, Vol. 69, No. 6, pp. 93–104. Baba, S. (2024), “A study on IoT device management for smart home environment”,
Daiichi Institute of Technology annual report, No. 36, pp. 11–16. Fiorella, L and Mayer, E. Richard. (2021), “14 - Principles for Reducing Extraneous Processing in Multimedia Learning”, Cambridge University Press, pp. 185–198. Iwata, T. (2019), “Status of utilization of household energy data and issues for future
utilization”, Journal of Life Cycle Assessment, Vol. 15, No. 3, pp. 258–263. Lewis, R. J. (2009), “The System Usability Scale: Past, Present and Future”, International Journal of Human-conference, Vol. 34, No. 7, pp. 577–590. Miller, G. A. (1956). The magical number seven, plus or minus two: Some limits on
our capacity for processing information. Psychological Review, 63(2), 81–97. Miyake, S. (2015), “Measurement and Analysis of Mental Workload: NASA-TLX Revisited”, Japan Ergonomics Society, Vol. 51, No. 6, pp. 391–398. Mizobuchi, K. (2019), “Psychological aspect of the energy saving behavior”,
Matsuyama University Review, Vol. 31, No. 3, pp. 1–21. Murugesan, L. et al. (2014), “Visualization of Electricity Consumption: Software Prototype through LiteratureSurvey”, Environmental Science, Engineering, Computer Science International Journal of Innovative Research in Science, Engineering and Technology, Vol.3, pp. 2725–2729 Ridsdale, C. et al. (2015), “Strategies and Best Practices for Data Literacy Education
Knowledge Synthesis Report”, Education, Computer Science, pp. 1–104 Rowley, J. (2007), “The wisdom hierarchy: Representations of the DIKW hierarchy”, Journal of Information Science, Vol. 33, No. 2, pp. 163–180. Sauro, J. and Lewis, R. J. (2009), “Correlations among prototypical usability metrics:
evidence for the construct of usability”, Proceedings of the SIGCHI Conference on Human Factors in Computing Systems, pp. 1609–1618. Shirayama, S. (2009), “What can we extract from the visualization?”, Systems Innovation Science The 2nd Academic Lecture, pp. 15–22. Suzuki, M. and Suzumura, Y. (2015), “Necessity and Significance of Data Visualization: What is data visualization?”, The journal of Information Science and Technology, Vol. 65, No. 11, pp. 470–475.
LISTED IN THE AHFE DIGITAL BOOKSTORE CATALOGUE
Explore the complete digital volume
Interdisciplinary Practice in Industrial Design
Read this individual research paper free through the original publisher, or explore the full digital proceedings book.
ISBN 978-1-964867-59-5
Explore this ISBN in the AHFE Bookstore ↗Listed in the July 2026 bookstore catalogue; search by ISBN to confirm current availability · Digital book purchase optional