Haru Kameda, Wonseok Yang (2026). Understanding Information-Seeking Behavior Through Visual Cues: UX/UI Design Perspectives for Social Media Interfaces. In: Interdisciplinary Practice in Industrial Design. AHFE Open Access, vol. 222, pp. 23–33. https://doi.org/10.54941/ahfe1007743
When browsing information-rich environments such as SNS, users intuitively select content and assess information value based on visual impressions. Visual cues, including icons and text on image-centric user interfaces, attract users' attention and serve as signifiers that indicate the value and nature of underlying information, supporting information selection during browsing. This research focuses on visual cues within SNS to clarify the information selection process of users navigating image-centric interfaces and to identify the visual cues that facilitate this process. Specifically, we examined the information selection process by investigating the relationship between user-information engagement types and visual cues. The results showed that users follow a two-stage information selection process: initial screening based on visual characteristics, followed by content interpretation. Three engagement types were identified: “behavioral engagement,” “passive engagement,” and “emotional engagement.” Content that relied only on image information was unstable for interpretation, as it depended entirely on individual sensibilities. We then conducted a verification experiment using prototypes with text labels and icons to compare their effects. The results indicated that visual cues function differently depending on the engagement type. In passive engagement, text labels tended to promote selection behavior by conveying meaning and context, providing a sense of information. In contrast, for active and affective engagement, the visual appeal of content rejection was more influential than text or icons. Therefore, to support information selection, optimizing visual cues according to the user's engagement type, rather than applying uniform cues to all content, can help prevent information oversight and encourage serendipitous information encounters.
With the rapid advancement of ICT, the volume of information encountered daily has increased significantly (Eppler and Mengis, 2004). In this context, users struggle to process all available information and must selectively engage with content within their limited attention resources. Social Network Sites (SNS) have shifted from communication tools to large-scale media platforms focused on images and videos (Boyd and Ellison, 2008). On image-centric Received February 19, 2026; Revised April 9, 2026; Accepted April 23, 2026; Available online July 20, 2026
24 Kameda and Yang platforms such as Instagram, users often scroll through timelines without a specific goal, and unexpected encounters with content are central to the user experience (Erdelez, 2005). In object-oriented user interfaces (OOUI), content appears in a regular grid, and users process visual information sequentially through rapid scrolling. They stop only when something captures their interest, at which point they move to the detail view. Azad et al. described this process as the “Scroll, Stop, Shop” model, identifying the moment users stop scrolling as the key engagement point (Azad et al., 2024). Previous research has highlighted the role of social proof factors, such as “like counts” and “follower counts,” in explaining this behavior (Mamalikou, 2025). These numerical metrics act as important cues that signal information reliability and support decisions to view or purchase content. However, browsing on Social Network Sites (SNS) is fast and continuous, making it difficult for users to read, compare, and evaluate each numerical metric. As a result, visual cues that are quickly and intuitively understood are likely to influence user selection behavior more than numerical information. Modern Social Network Sites (SNS) platforms use various visual cues, such as icons for multiple posts or video previews, to immediately communicate content attributes. These cues are believed to help users decide which posts merit stopping their scroll. This research focuses on visual cues in Social Network Sites (SNS), aiming to clarify how users select information during image-centric UI browsing and to identify the visual signifiers that support this process. By examining user engagement with information and analyzing the interaction between engagement types and visual cues, we investigate effective ways to present information in browsing environments.
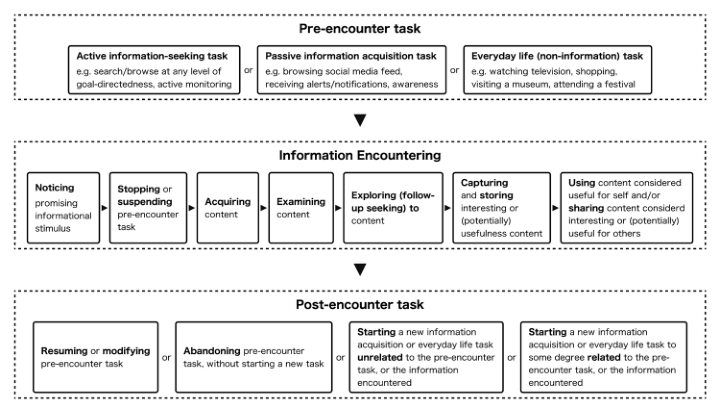
Features of Browsing Behavior in Information Seeking Recent information behavior research has expanded the concept of information seeking beyond “search with a clear purpose” to include a broader behavioral system that covers exploration with ambiguous or absent goals and accidental information encounters. Erdelez and Makri (2020) reconceptualized accidental information encounters, showing how unintentionally encountered information can shape later interpretation and action (see Figure 1).
This perspective explains browsing not as “aimless = irrational,” but as an exploratory mode in which value emerges from responding to environmental stimuli. The systematization of serendipity research shows that the likelihood of accidental encounters varies depending on the interaction of several factors: the environment (how information is presented), the individual (orientation and experience), and the situation (tasks and context) (Liu et al., 2021). In parallel, frameworks that identify curiosity as the main driver of exploration have developed, examining psychological conditions that support non-goal-directed exploration, such as sensitivity to novelty and tolerance for ambiguity (Wilson, 2024). Research on information search further shows that trial and error, detours, and question redefinition under ambiguous goals are central to exploration (Soufan et al., 2022), supporting the view that browsing is a form of exploration. However, while these studies
Understanding Information-Seeking Behavior Through Visual Cues 25 present strong concepts and frameworks, few address the process within wandering behavior, specifically which elements prompt stopping and how information is selected.
Figure 1: The refined information encountering process.
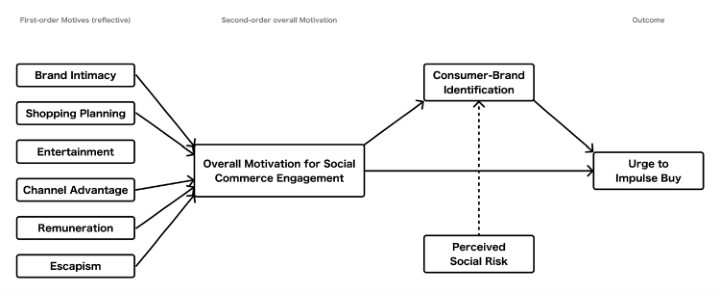
Social Network Sites (SNS) as Information-Seeking Environment and a New “Gateway” to Information Social Network Sites (SNS) are evolving from communication tools into media and exploration platforms, increasingly serving as the main gateway for daily information access. Domestic surveys show that, especially among younger people, the primary method for gathering information is shifting from search engines to Social Network Sites (SNS), making Social Network Sites (SNS) the “first place people open.” Internationally, users are also using Social Network Sites (SNS) in ways similar to search engines, including actions such as assessing reliability and making comparisons (Diep & Tran, 2025). This trend indicates that Social Network Sites (SNS) behavior should be modeled not only as entertainment consumption, but also as “exploratory behavior.” Infinite scroll is an important design feature that supports browsing. Baughan et al. (2022) found that Social Network Sites (SNS) design can influence dissociation and memory dilution, showing that the environment shapes users’ attention and experience quality. Rixen et al. (2023) described infinite scrolling as a loop, identifying reasons for continuation and interruption, and showing that browsing involves repeated selections. The “Scroll–Stop–Shop” model for Instagram further shows that exploratory scrolling (OM-SCE) does not directly cause purchase impulse (UIB); instead, purchase impulse forms only after users stop and identify with a brand (CBI) (see Figure 2). This finding suggests that stopping behavior is a key point that directs user actions.
Figure 2: The “Scroll–Stop–Shop” process.
Visual Cues as Information Scent When navigating image-centric user interfaces, users encounter many stimuli in a short period and rely more on intuitive selections than on deliberate thought. Digital nudge research has organized how presentation formats influence choices (Jesse & Jannach, 2021), and studies indicate that cues also speed up decision-making on social media (Meinert & Krämer, 2022). In this context, visual cues are not only about visibility; they can serve as “signifiers” for estimating value and trustworthiness, which may bypass users’ reflective selections. Visual cues can provide an “information scent,” helping users quickly narrow down options for stopping and selecting based on an initial sense of perceived value. Visual cues also differ between text labels, which explicitly convey meaning, and symbolic icons. While labeling may improve recognition performance (Song et al., 2024), semantic icons can enhance subjective engagement (Alebri et al., 2024). The combination of abstraction levels between icons and labels affects information comprehension; when both are abstract, interpretation becomes more difficult (Zhu et al., 2022). Signifiers are shaped not only by content but also by presentation, with factors such as size and labels potentially serving as important cues (Mahamad et al., 2022). Research on Social Network Sites (SNS)-specific labels shows that although labels may attract attention, they do not always result in behavioral changes (Gamage et al., 2022; Hübner et al., 2025). However, most existing research examines attention, comprehension, and behavior separately. Few studies address the continuous selection process of “stop → select” during browsing from the perspective of visual cues. This research, therefore, examines how visual cues influence “stop” and “select” through the formation of information scent in image-centric user interfaces on Social Network Sites (SNS) platforms. It also aims to present design guidelines for optimizing signifiers according to each type of involvement.
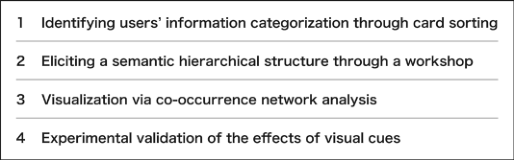
RESEARCH METHOD To clarify users’ information selection processes and the visual cues that facilitate them, this research conducted research in the following steps:
Figure 4: Research flow.
Step 1: Identifying Users’ Information Categorization Through Card Sorting To clarify how users categorize social media information, we conducted an open card sorting experiment with 15 university students. To reduce bias from individual search histories and ensure comprehensiveness, we randomly collected images from the Instagram “Explore tab” of five general users. The researcher removed duplicates and adjusted genres from the initial 150 images, selecting a final set of 100. Social proof information, such as “like counts” and “username,” was removed by cropping. To ensure evaluation focused only on visual information, all images were processed into uniform square cards. Participants grouped and categorized the cards, then assigned labels representing each group’s content. During debriefing, participants explained the reasoning behind their selections.
The participants created 265 groups in total, with the number of groups per person ranging from 7 to 33. Label names included content-based themes, such as “food,” and also reflected personal actions or interests, such as “interesting” or “something to save.” Visually ambiguous content was often interpreted later or skipped, indicating a temporal tendency. This finding shows that users follow a two-step process: instant visual screening and content interpretation. It suggests that the level of engagement with the information is a key classification criterion.
Step 2: Eliciting a Semantic Hierarchical Structure Through a Workshop To organize the semantic hierarchical structure of labels obtained in Step 1, a workshop was conducted with five university students. Participants grouped the labels generated in Step 1 using the KJ method and hierarchically organized them by level of abstraction.
The experiment revealed that participants organized information based on the degree of subjective involvement—“what kind of value or action it brings to me”—and the involvement types were consolidated into the following three categories:
1. Behavioral Engagement Directly connects to specific future actions, such as “Want to eat” or “Want to go.” 2. Passive Engagement Enjoying browsing incoming information, such as “Stylish posts.” 3. Emotional Engagement Evokes emotional responses, such as “Healing” or “cute.”
Figure 3: Semantic structuring (hierarchical organization of labels).
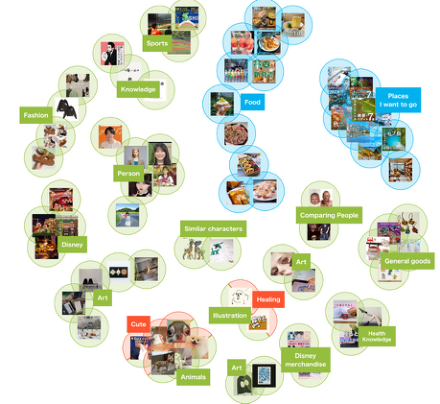
Step 3: Visualization Via Co-Occurrence Network Analysis To quantitatively clarify the relationships between grouped content, we performed co-occurrence network analysis using a lightweight text analysis tool (KH Coder). We defined combinations of cards classified by participants into the same group as co-occurrence pairs and visualized the relationships between clusters.
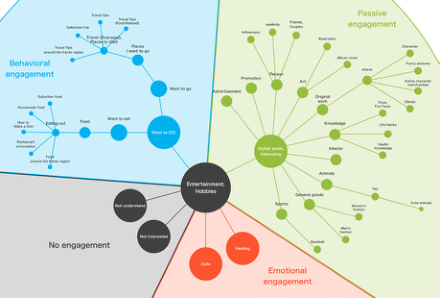
The results confirmed that the 100 static image contents formed 17 clusters, underpinned by three types within a semantic hierarchy: “Behavioral Engagement,” “Passive Engagement,” and “Emotional Engagement.” Furthermore, “Behavioral Engagement,” which includes textual information, showed high co-occurrence among participants, revealing that text functions as a powerful judgmental factor. Conversely, “Passive Engagement” and “Emotional Engagement,” which rely solely on image information, showed low consistency in co-occurrence, suggesting that interpretation is unstable and dependent on individual sensibilities.
Figure 4: Results of the co-occurrence network analysis.
Understanding Information-Seeking Behavior Through Visual Cues 29 Step 4: Experimental Validation of The Effects of Visual Cues
To verify the effectiveness of visual cues in image-centric Social Network Sites (SNS) UI, we conducted an experiment with 30 university students using an iPhone 15 Pro and a prototype modeled after Instagram’s “Explore tab.” Three comparison conditions were prepared: “Images only (existing UI)”, “Icon labels”, and “Text labels”. Content comprised nine themes corresponding to three engagement types. Images generated using AI (Google Gemini) were used to ensure uniform quality, eliminating selection bias due to image quality or composition. The experiment employed a within-subjects design with randomized presentation order, conducting a multi-faceted verification across three stages: “Cognition,” “Interpretation,” and “Action.”
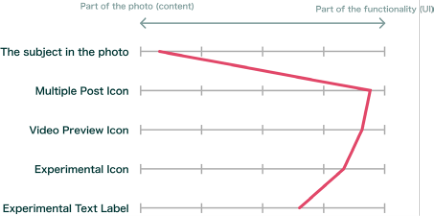
Results on Validation Experiment on the Effects of Visual Cues First, we present the results of verifying how visual cues are perceived by users. Participants were asked to rate each visual cue on a 5-point scale indicating whether it was perceived as “part of user-posted content” or “part of a platform-designed feature.”
The results of a one-way ANOVA showed that existing features like the “multiple-post icon” and “video preview icon,” as well as the experimental icons used in the test conditions, were highly recognized as platform features. Conversely, evaluations of the experimental text labels were dispersed, exhibiting the highest standard deviation of 1.54. This suggests that since adding text to images is common practice on Social Network Sites (SNS) feeds, some users may have assimilated the text labels into the content as “edits made by the poster.” Furthermore, this result showed a statistically significant difference.
Figure 5: Comparison of mean ratings across visual-cue types.
Next, we discuss the impact of visual cues on content interpretation. When investigating “what information users predict they will obtain” from posts featuring visual cues, differences emerged based on engagement type. For active engagement, icons strongly suggested practical information like “maps or recipes,” showing high interpretive agreement. This resulted from icons functioning as signifiers that defined “what can be done.” In contrast, for passive engagement, images alone struggled to convey meaning or value, leading to dispersed interpretations. However, adding text labels defined the content’s attribute as “detailed explanations/trivia,” showing a tendency
30 Kameda and Yang to suppress interpretive variation. Thus, text labels function as semantic signifiers, defining “what this is” and clarifying ambiguous information.
Finally, we describe the influence of visual cues on actual selection behavior through the following three-stage process.
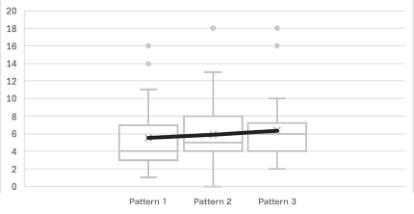
First, to verify whether UI pattern differences affect the number of content selections, we conducted a one-way ANOVA across all participants. The results revealed no statistically significant difference in UI pattern preferences, indicating that simply providing visual cues does not inherently increase overall selection counts.
Figure 6: Results of the one-way ANOVA.
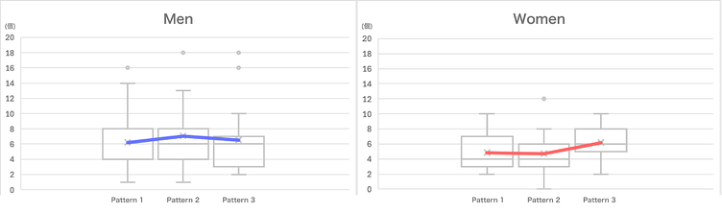
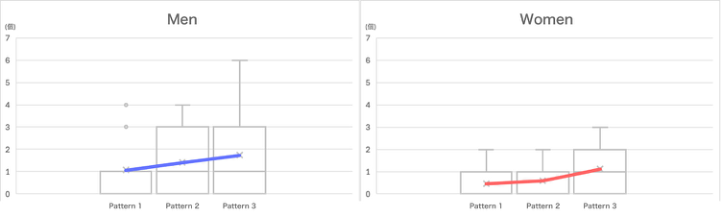
Next, considering the potential influence of users’ personal characteristics, we conducted a two-way ANOVA adding “gender” as an attribute factor. The results confirmed a difference in selection counts based on gender, but no interaction with the UI pattern was observed. Thus, no evidence was found that gender differences alter the effectiveness of the UI.
Figure 7: Results of the two-way ANOVA.
Therefore, assuming that behavioral principles differ based on user motivation, we split the data by engagement type and performed a two- way ANOVA. The results showed that, for both behavioral and emotional engagement, no significant difference was observed based on the presence or absence of visual cues. For passive engagement, while the main effect of UI pattern did not reach statistical significance, a significant difference based on gender was confirmed. Focusing on the trend in average values, the number of selections in the condition with text labels showed a numerical tendency to increase to approximately twice that of the condition without visual cues. This result strongly suggests that reinforcing the “scent” of information
Understanding Information-Seeking Behavior Through Visual Cues 31 through text labels may have an effect of supporting user decision-making, particularly for content where selecting the meaning or value of information is difficult. In other words, even content that might be overlooked when presented as an image alone tends to increase the probability of users pausing when meaning (value) is defined through text.
Figure 8: Results of the two-way ANOVA for passive engagement.
Summarizing the above results, the effectiveness of visual cues depends on the type of user engagement and the characteristics of the cues. Icons were recognized as platform features and proved effective in suggesting practical information for behavioral engagement. In contrast, text labels served to define the meaning of content, particularly suppressing interpretive uncertainty in passive engagement where value selections were difficult based on images alone. Regarding behavioral change, a numerical trend was observed where the number of selections approximately doubled when text labels were provided during passive engagement. This suggests text labels may function as a scent of information, complementing the perceived value of highly uncertain content and thereby supporting user decision-making.
CONCLUSION
Previous research has examined social proof on Social Network Sites (SNS) as a factor in decision-making, as well as the attention-grabbing effects of visual cues. However, few studies have addressed the ongoing decision process of “stop → select” during browsing from the perspective of visual cues. This research investigated the effect of visual cues on Social Network Sites (SNS) by focusing on types of user involvement. The experiment showed that the influence of visual cues varies and depends on the alignment between the type of user involvement and the visual cue. For behavioral and emotional involvement, the presence or absence of visual cues did not significantly change selection behavior, indicating that the content’s intrinsic appeal is more influential and additional cues are unnecessary. Notably, only under passive involvement did text labels tend to increase selection behavior. When content could be interpreted in several ways as images alone, text labels acted as semantic signifiers, clarifying information and reducing interpretive variability. In this context, text labels provided a strong information scent and, by lowering uncertainty, prompted users to stop scrolling and make
32 Kameda and Yang selections. These results indicate that current platform designs, which apply uniform UI treatments to all posts, should be reconsidered. Instead, signifiers should be optimized based on content characteristics. Specifically, for passive information that is easily overlooked in feeds, adding semantic text rather than formal icons may lower cognitive load in information-rich environments. Applying these findings can inform new design guidelines to improve the quality of serendipitous user–information encounters and help prevent missed opportunities.
REFERENCES
Alebri, M. Costanza, E. Panagiotidou, G. Brumby, D.P. Althani, F. Bovo, R. (2024).
Visualisations with semantic icons: Assessing engagement with distracting elements. International Journal of Human-Computer Studies, 191, 103343. Azad Moghddam, H. Carlson, J. Wyllie, J. Mahmudur Rahman, S. (2024). Scroll, Stop, Shop: Decoding impulsive buying in social commerce. Journal of Business Research, 182, 114776. Boyd, D.M. Ellison, N.B. (2008). Social Network Sites: Definition, History, and
Scholarship. Journal of Computer-Mediated Communication, 13, pp. 210–230. Baughan, A. Zhang, M.R. Rao, R. Lukoff, K. Schaadhardt, A. Butler, L.D. Hiniker, A. (2022). “I Don’t Even Remember What I Read”: How Design Influences Dissociation on Social Media. CHI Conference on Human Factors in Computing Systems. Diep, P.P.U. Tran, H.D. (2025). Using TikTok as a Search Engine: Affordances,
Perceived Credibility, and Evaluative Actions. Telematics and Informatics, Volume 102, 102324. Donath, J. (2008). Signals in social supernets. Journal of Computer-Mediated Communication, 13(1), pp. 231–251. Eppler, M.J. and Mengis, J. (2004). The Concept of Information Overload: A Review
of Literature from Organization Science, Accounting, Marketing, MIS, and Related Disciplines. The Information Society, 20, pp. 325–344. Erdelez, S. (2005). Information encountering. pp. 179–184. Erdelez, S. Makri, S. (2020). Information encountering re-encountered: A conceptual re-examination of serendipity in the context of information acquisition. Journal of Documentation, 76, pp. 731–751. Gamage, D. Sewwandi, D. Zhang, M. Bandara, A.K. (2025). Labeling Synthetic
Content: User Perceptions of Label Designs for AI-Generated Content on Social Media. CHI Conference on Human Factors in Computing Systems. Hübner, M. Thalmann, J. Henseler, J. (2025). Blending in or standing out? The disclosure dilemma of ad cues of social media native advertising. Frontiers in Psychology, 16, 1636910. Jesse, M. Jannach, D. (2021). Digital nudging with recommender systems: Survey
and future directions. Computers in Human Behavior Reports, 3, 100052. Liu, Y. Qin, C. Ma, X. and Liang, H. (2021). Serendipity in human information behavior: a systematic review. Journal of Documentation. Mahamad, S. Shuhaili, F.M. Sulaiman, S. Awang Rambli, D.R. Balogun, A.O. (2022).
Visual Signifier for Large Multi-Touch Display to Support Interaction in a Virtual Museum Interface. Applied Sciences, 12, 11191. Mamalikou, M. Gkatzionis, K. and Panagitou, M. (2025). The Influence of Social Media-like Cues on Visual Attention—An Eye-Tracking Study with Food Products. Journal of Eye Movement Research, 18, 62.
Understanding Information-Seeking Behavior Through Visual Cues 33 Meinert, J. Krämer, N.C. (2022). How the expertise heuristic accelerates decision-
making and credibility judgments in social media by means of effort reduction. PLoS ONE 17, e0264428. Metzger, M.J. Flanagin, A.J. and Medders, R.B. (2010). Social and Heuristic Approaches to Credibility Evaluation Online. Journal of Communication, 60, pp. 413–439. Rixen, J.O. Meinhardt, L.M. Glöckler, M. Ziegenbein, M. Schlothauer, A. Colley,
M. Rukzio, E. and Gugenheimer, J. (2023). The loop and Reasons to Break It: Investigating Infinite Scrolling Behavior in Social Media Applications and Reasons to Stop. Proc. ACM Hum-Comput Interact, Vol. 7, No. MHCI, Article 228. Song, X. Lin, Z. and Tan, R. (2024). Developing icons for older adults: The roles of icon design categories, text labels, and learning strategies. International Journal of Industrial Ergonomics, Volume 102 , 103613. Soufan, A. Ruthven, I. and Azzopardi, L. (2022). Searching the Literature: An Analysis
of an Exploratory Search Task. Human Information Interaction and Retrieval. Wilson, T.D. (2024). Curiosity and information-seeking behavior: a review of psycho-logical research and a comparison with the information science literature. Journal of Documentation, 80, pp. 43–59. Zhu, Y. Li, Y. Lin, Y. Chen, M. Guo, Q. Zhang, Z. (2022). Research on the Influence
of User and Graphic–Text Combined Icon Construal Level Fitting on Visual Cognition. Applied Sciences, 12, 10111.
LISTED IN THE AHFE DIGITAL BOOKSTORE CATALOGUE
Explore the complete digital volume
Interdisciplinary Practice in Industrial Design
Read this individual research paper free through the original publisher, or explore the full digital proceedings book.
ISBN 978-1-964867-98-4
Explore this ISBN in the AHFE Bookstore ↗Listed in the July 2026 bookstore catalogue; search by ISBN to confirm current availability · Digital book purchase optional