Regina W Y Wang, I Ning Liu, Jiacheng Wang (2025). Can stylized pale-toned public health and safety graphic signs become the mainstream of design?. In: Human Factors in Communication of Design. AHFE Open Access, vol. 177, pp. 24–31. https://doi.org/10.54941/ahfe1006328
As visual identification symbols, graphic signs can help viewers quickly identify and perform relevant emergency actions. This study aimed to content analyze the style and color characteristics of appropriate public health and safety graphic signs, and summarize the current design mainstream. A total of 245 samples were collected from the Getty Images’ collections covering diverse materials and graphic signs released from 1995 to 2023. The results indicate that the most common style in the public health safety graphic signs was "abstract symbology", characterized by geometric lines and the absence of textures and shadows. Additionally, the color tone with the highest proportion was "pale", a more white shade of pure color.
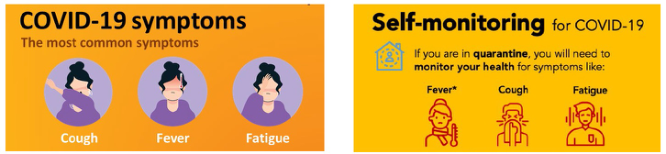
Following the COVID-19 outbreak, global experts and health agencies collaborated to share knowledge about the virus and to advise the public to take relevant preventive behaviors to prevent the spread of the epidemic (WHO, 2023). The establishment of public health and safety signs can enhance the public’s awareness of preventing diseases and protecting their health and safety (Speake & Pentaraki, 2023). Signs are a communication tool that can convey information quickly without language restrictions (Chan & Chan, 2011). The graphics and colors of a sign can help viewers recognize and understand its meaning more quickly (Chen et al., 2018). Observing the signs published on the official website of the World Health Organization (WHO, 2021), its style and colors are diverse, and it seems there is no complete or universal system (Figure 1). Therefore, the motivation of this study was to clarify the style and color design characteristics of public health and safety graphic signs, and to determine the current design mainstream.
The objectives of this study were as follows:
1. To clarify the style and color design features of public health and safety graphic signs. 2. To conduct content analysis of the styles and colors of public health and safety graphic signs, and to summarize mainstream designs.
Can Stylized Pale-Toned Public Health and Safety Graphic Signs 25
Figure 1: Different styles of graphic signs published on the WHO official website (WHO, 2021).
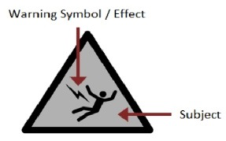
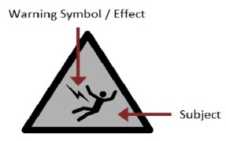
Previous studies have shown that graphic signs can effectively attract viewers’ attention and thus influence their behavior (Meernik et al., 2016). The design elements of safety graphic signs include themes and warning symbols/effects (Gutierrez & Tiong, 2015); see Figure 2. Studies have shown that relevant healthcare signs can more clearly convey the meaning of contact, droplet, and airborne transmission through visual cues (Clack et al., 2019); see Figure 3.
Figure 2: Design elements of safety graphic signs (Gutierrez & Tiong, 2015).Figure 3: Visual cues in healthcare signs (Clack et al., 2019).
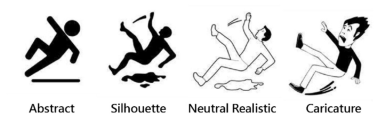
Different styles of graphic signs can affect risk perception (Marom-Tock & Goldschmidt, 2011; Ouyang et al., 2024). Previous studies have shown that safety signs that use abstract and silhouette styles can make people feel at risk (Marom-Tock & Goldschmidt, 2011); see Figure 4. Regarding the classification of graphic styles, Marom-Tock & Goldschmidt (2011) classified graphic styles into abstract, silhouette, neutral realistic, and caricature. While Ryan classified graphic styles into cartoons, line drawings, tonal drawings, and photographs (Ryan & Schwartz, 1956). In the application of related graphic styles, scholars mostly use the five style classification standards proposed by Meyer: abstract symbology, graphic symbology, graphic rendering, pictorial illustration, and natural photography (Chen et al., 2021; Meyer et al., 1980; Wang & Hsu, 2007), so this study classified the graphic sign styles based on this standard.
Figure 4: Safety graphic signs in different styles (Marom-Tock & Goldschmidt, 2011).
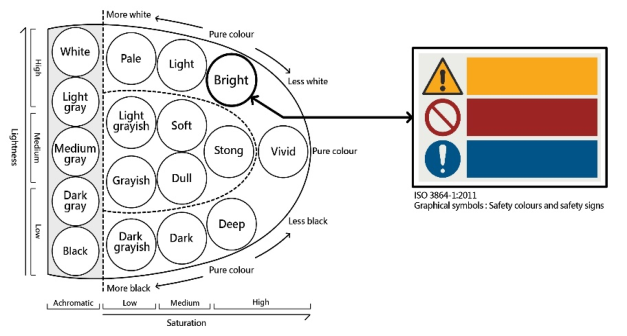
Color is related to risk communication, and plays an important role in conveying hazard messages (Edworthy, 1996; Williams & Noyes, 2007). Previous studies have shown that color tones can affect viewers’ emotions (Kim & Suk, 2015). Color tone refers to a set of various hues with the same perceived brightness and the same saturation (Kim et al., 2022). Some scholars suggest that warning signs should use bright colors to attract people’s attention (Chen et al., 2008; Hu et al., 2011). Bright, warm tones of red are suitable for use on warning signs (Imsuwansakorn, 2012; Ongkrutraksa, 2017). This study observed the safety sign colors set by ISO 3864–1 (International Organization for Standardization, 2011), which roughly fall within the bright tone range of the PCCS color system (Practical Color Co-ordinate System); see Figure 5. The PCCS color system was developed by the Japan Color Research Institute in 1964. It presents 12 tones through different degrees of brightness and saturation, including Dark grayish, Grayish, Light grayish, Pale, Dark, Dull, Soft, Light, Deep, Strong, Bright, and Vivid (Sato & Tajima, 1995; Wakata & Saito, 2013; Wang et al., 2020). The PCCS color system combines the advantages of the Munsell and Ostwald color systems, and is more commonly used in color attribute analysis (Han, 2022; Xie et al., 2024). Therefore, this study used this standard as the color classification of graphic signs.
Figure 5: PCCS color system and ISO-defined safety sign colors (organized for this study).
The effect of color on emotions depends not only on the color tone but also on the color with brightness and saturation, with high brightness and saturation inducing higher arousal (Wilms & Oberfeld, 2018). Camgöz et al.
Can Stylized Pale-Toned Public Health and Safety Graphic Signs 27
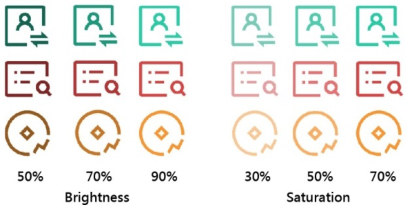
(2004) found that colored squares with the highest brightness and saturation attracted the most attention. Studies have also shown that disability signs with different brightness contrasts can affect the recognition of people with low vision (Zhang et al., 2024). Icons of different degrees of brightness and saturation will affect the viewer’s discrimination and reaction time (Chen et al., 2024), as shown in Figure 6.
Figure 6: Icons of different degrees of brightness and saturation (Chen et al., 2024).
RESEARCH METHODS This study classified public health and safety graphic signs based on content analysis. Content analysis is a method of analyzing the content of various materials, such as visual and verbal materials, to classify phenomena or events into defined categories to better analyze and interpret them (Harwood & Garry, 2003). This study collected 245 samples of public health and safety graphic signs from materials released by the Getty Images library between 1995 and 2023. The keyword search included words commonly used during the epidemic, such as Epidemic, Infectious disease, Flu, and COVID-19. Getty Images owns the iStock and Unsplash stock brands (Getty Images, 2024). It recently merged with Shutterstock to offer more than 500 million materials, including 3D objects, illustrations, vector graphics, and so on (Associated Press, 2025; CNBC, 2025; Getty Images, 2024; Shutterstock, 2024).
The 245 samples were discussed by two research participants with more than 10 years of relevant experience, and were adopted after reaching a consensus. The intercoder reliability was tested using the Holsti index (Holsti, 1969). Researcher A has experience in visual communication design work and teaching, while Researcher B has experience in design and outdoor safety rescue. The sample style analysis is classified using the five graphic styles applied by Meyer et al. (Chen et al., 2021; Meyer et al., 1980; Wang & Hsu, 2007). The sample color tone analysis was performed using the 12 tone classifications of the PCCS (Practical Color Co-ordinate System) (Sato & Tajima, 1995; Wakata & Saito, 2013; Wang et al., 2020). For brightness and saturation, we used the eyedropper tool in Adobe Photoshop to extract the color that occupies the largest area of the graphic signs, and calculated its HSB value (Hue, Saturation, Brightness) through the color picker.
RESULTS
Among the 245 samples of public health graphic signs, the study participants analyzed that 220 samples could fully agree with the style and color tone attribute classification defined in this study, and the remaining
25 samples that were different were adopted after discussion and consensus. The reliability test uses the Holsti formula, which is the coefficient reliability = 2×M/(N1 + N2), M is the total number of decisions both participants agree on, while N1 and N2 are the decisions made by participant 1 and participant 2 (Holsti, 1969; Mao, 2017; Nili et al., 2017). The reliability test result was 94.6%, which is within the acceptable range. Scholars explain that reliability <60% is insufficient, 60–79% is moderate, 80–90% is strong, and >90% is considered close to perfect (McHugh, 2012; Nelson & Rhoney, 2023).
Results of the statistical number/percentage of public health graphic sign styles (Table 1): The most common subject graphics were in the “abstract symbology” style (24.9%, N = 61), followed by the “pictorial illustration” style (21.6%, N = 53), and the third is the “graphic symbology”style (20.4%, N = 50). It was further found that most of the subject graphics did not add auxiliary symbols/effects (62.3%, N = 153) to convey the meaning.
Table 1: Style and symbol/effect statistics of public health and safety graphic signs.
Table available in the original PDF paper.
N(%) Symbols/Effects N(%) Total N(%)
Style of Subject Graphics Abstract symbology
61(24.9%) None 35(14.2%) One 21(8.6%) Two 5(2.1%)
Graphic symbology
50(20.4%) None 27(11.0%) One 21(8.6%) Two 2(0.8%)
Graphic rendering
42(17.1%) None 20(8.1%) One 19(7.8%) 245(100%) Two 3(1.2%)
Pictorial illustration
53(21.6%) None 38(15.5%) One 13(5.3%) Two 2(0.8%)
Natural photography
39(16.0%) None 33(13.5%) One 6(2.5%) Two 0(0%) Results of the statistical number/percentage of color tones of public health graphic signs (Table 2). The largest proportion is “pale tone” (12.3%, N = 30), followed by “light tone” (11.1%, N = 27). The third is “bright tones”(9.4%, N = 23). Further analysis of brightness and saturation revealed that high brightness (25.5%, N = 62) and low saturation (20.8%, N = 51) accounted for the largest proportion.
Table 2: Color tone statistics of public health and safety graphic signs.
Table available in the original PDF paper.
Color Tones N(%) Brightness N(%) Saturation N(%) Total N(%) Color Dark grayish 5(2.0%) Low 5(2.0%) Low 51(20.8%) 245 (100%) Grayish 10(4.0%) Medium-low 10(4.0%)
Continued
Can Stylized Pale-Toned Public Health and Safety Graphic Signs 29
Table 2: Continued Color Tones N(%) Brightness N(%) Saturation N(%) Total N(%)
Table available in the original PDF paper.
Light grayish 6(2.5%) Medium-high 6(2.5%) Pale 30(12.3%) High 30(12.3%) Dark 7(2.9%) Low 7(2.9%) Medium 40(16.3%) Dull 6(2.3%) Medium-low 6(2.3%) Soft 0(0.0%) Medium-high 0(0.0%) Light 27(11.1%) High 27(11.1%) Deep 4(1.6%) Low 4(1.6%) High 35(14.3%) Strong 3(1.2%) Medium-low 3(1.2%) Bright 23(9.4%) Medium-high 23(9.4%) Vivid 5(2.1%) High 5(2.1%) Achromatic Neutral 119(48.6%) none 119(48.6%) None 119(48.6%)
CONCLUSION
This study found that the mainstream designs of public health and safety graphic signs are “abstract symbology” style and “pale color tone”. It is worth noting that past studies have suggested that warning signs should use bright colors to attract attention, but the results of this study showing the use of pale tones are inconsistent with this. It is recommended that future research further explore whether different shades of pink can effectively convey risk messages in public health signs.
REFERENCES
Associated Press. (2025). Getty Images buying Shutterstock to create a $3.7 billion visual content company. https://apnews.com/article/shutterstock-getty-images- e883ef74736e016315417c758ab17093 Chan, K. L., & Chan, A. H. (2011). Understanding industrial safety signs:
Implications for occupational safety management. Industrial Management & Data Systems, 111(9), 1481–1510. Chen, C.-H., Chen, M., & Gao, T. (2008). Detection and recognition of alert traffic signs. Publication of Standford University. Chen, J., Wang, R. Q., Lin, Z., & Guo, X. (2018). Measuring the cognitive loads
of construction safety sign designs during selective and sustained attention. Safety science, 105, 9–21. Chen, L.-H., Liu, Y.-C., & Wang, C. (2021). Identification of Product Functional Images Among Older Adults. Cross-Cultural Design. Experience and Product Design Across Cultures: 13th International Conference, CCD 2021, Held as Part of the 23rd HCI International Conference, HCII 2021, Virtual Event, July 24–29, 2021, Proceedings, Part I 23. Chen, M., Li, J., & Zhu, Y. (2024). The effects of icon updating on user visual
discrimination under different working memory load. Journal of the Society for Information Display, 32(1), 9–22. Clack, L., Stühlinger, M., Meier, M.-T., Wolfensberger, A., & Sax, H. (2019). Usercentred participatory design of visual cues for isolation precautions. Antimicrobial Resistance & Infection Control, 8, 1–13. CNBC. (2025). Getty Images, Shutterstock gear up for AI challenge with $3.7 billion merger. https://www.cnbc.com/2025/01/07/shutterstock-and-getty- images-will-merge-to-become-a-3point7-billion-visual-content-company.html Edworthy, J. (1996). Warning design: A research prospective. CRC Press.
Getty Images. (2024). Getty Images - About us. https://www.gettyimages.hk/ about-us Gutierrez, A. M. J., & Tiong, J. S. M. (2015). An Evaluation of the Factors
in Comprehensibility of Industrial Safety Signs for the Color Vision Deficient Population. Proceedings 19th Triennial Congress of the IEA. Han, S. (2022). Big Data Computation for Application of Color Management in Digital Printing of Home Textiles. 2022 2nd International Conference on Social Sciences and Intelligence Management (SSIM). Harwood, T. G., & Garry, T. (2003). An overview of content analysis. The marketing
review, 3(4), 479–498. Holsti, O. R. (1969). Content analysis for the social sciences and humanities.
Reading. MA: Addison-Wesley (content analysis). Hu, X., Zhu, X., Li, H., & Li, D. (2011). Traffic sign detection based on visual attention model. 2011 19th International Conference on Geoinformatics. Imsuwansakorn, P. (2012). The symbology development for hazard communication
in Thailand. International Proceedings of Economics Development and Research, 57, 42. International Organization for Standardization. (2011). ISO 3864-1:2011. Graphical symbols — Safety colours and safety signs. Part 1: Design principles for safety signs and safety markings. International Organization for Standardization, Geneva. Kim, E., & Suk, H.-J. (2015). Hue extraction and tone match: Generating a theme color to enhance the emotional quality of an image. In ACM SIGGRAPH 2015 Posters (pp. 1–1). Kim, M., Knotts, T. L., Albers, N. D., & James, K. E. (2022). Emoji use as a catalyst
for relationship building and sustaining attention in online classes: An empirical study. Education Sciences, 12(12), 874. Mao, Y. (2017). Intercoder reliability techniques: Holsti method. In The sage encyclopedia of communication research methods (pp. 741–743). SAGE Publications, Inc. Marom-Tock, Y., & Goldschmidt, G. (2011). Design for safety: Symbol genre in safety signs. Proceedings of IASDR2011, the 4th World Conference on Design Research. McHugh, M. L. (2012). Interrater reliability: The kappa statistic. Biochemia medica,
22(3), 276–282. Meernik, C., Jarman, K., Wright, S. T., Klein, E. G., Goldstein, A. O., & Ranney, L.
(2016). Eye tracking outcomes in tobacco control regulation and communication: A systematic review. Tobacco regulatory science, 2(4), 377. Meyer, R. P., Laveson, J. I., & MO, D. P. S. L. (1980). Investigation of an Experiencejudgement Approach to Tactical Flight Training. Design Plus. Nelson, N. R., & Rhoney, D. H. (2023). Analysis of expert feedback to determine
intellectual standards for student pharmacist clinical reasoning development. American Journal of Pharmaceutical Education, 87(4), ajpe8975. Nili, A., Tate, M., & Barros, A. (2017). A critical analysis of inter-coder reliability methods in information systems research. Ongkrutraksa, W. (2017). The guide to excellence in communication management
and public relations tools for preventing disasters. International Conference on Law, Education, Humanities and Management (ICLEHM-17) May.
Can Stylized Pale-Toned Public Health and Safety Graphic Signs 31
Ouyang, Y., Huang, G., & He, S. (2024). Design of safety warnings and risk perception inducement: A comparative study between safety signs and safety comics in construction workplaces. Engineering, Construction and Architectural Management. Ryan, T. A., & Schwartz, C. B. (1956). Speed of perception as a function of mode of
representation. The American journal of psychology, 69(1), 60–69. Sato, Y., & Tajima, J. (1995). Color scheme supporting method in a color design system. Human Vision, Visual Processing, and Digital Display VI. Shutterstock. (2024). Shutterstock official website. https://www.shutterstock.com/
zh-Hant/ Speake, J., & Pentaraki, M. (2023). COVID-19, city centre streetscapes, and public health signage. Cities & Health, 7(4), 585–601. Wakata, T., & Saito, M. (2013). The impression of hue in practical color co-ordinate
system (PCCS). Wang, R. W., & Hsu, C. H. (2007). The method of graphic abstraction in visual metaphor. Visible Language, 41(3). Wang, R. W., Ke, T.-M., Chuang, S.-W., & Liu, I.-N. (2020). Sex differences
in high-level appreciation of automobile design-evoked gamma broadband synchronization. Scientific Reports, 10(1), 9797. WHO. (2021). COVID-19: Symptoms. https://www.who.int/westernpacific/ emergencies/covid-19/information/asymptomatic-covid-19 WHO. (2023). World Health Organization—About WHO. https://www.who.int/zh/about Williams, D. J., & Noyes, J. M. (2007). How does our perception of risk influence decision-making? Implications for the design of risk information. Theoretical issues in ergonomics science, 8(1), 1–35. Wilms, L., & Oberfeld, D. (2018). Color and emotion: Effects of hue, saturation,
and brightness. Psychological research, 82(5), 896–914. Xie, X.-H., Xu, Y., Guo, S., Zhu, H., & Yan, H. (2024). Evaluation and Decision of a Seat Color Design Scheme for a High-Speed Train Based on the Practical Color Coordinate System and Hybrid Kansei Engineering. Systems, 12(8), 316. Zhang, E., Zhao, W., Mei, Z., Yang, Z., Chen, F., Xia, Y., & Wang, Y. (2024).
Experimental Study on the Universal Design of Signage Size and Brightness Contrast for Low Vision Individuals.
LISTED IN THE AHFE DIGITAL BOOKSTORE CATALOGUE
Explore the complete digital volume
Human Factors in Communication of Design
Read this individual research paper free through the original publisher, or explore the full digital proceedings book.
ISBN 978-1-964867-53-3
Explore this ISBN in the AHFE Bookstore ↗Listed in the July 2026 bookstore catalogue; search by ISBN to confirm current availability · Digital book purchase optional