Yixuan Wu, Tiange Zhou (2025). Let the Earth Warm Up at Most 1.5°C—An Information Visualization Exhibition Design. In: Human Factors in Communication of Design. AHFE Open Access, vol. 177. https://doi.org/10.54941/ahfe1006336
This project focuses on the issue of global climate change and implements an information visualization exhibition themed “Let the Earth Warm Up at Most 1.5℃ ”. By integrating information visualization, spatial display, and scientific communication, it intuitively presents global warming trends driven by greenhouse gas emissions and their multifaceted ecological impacts. Based on the HadCRUT global surface air temperature dataset (1860– 2020)(Met Office Hadley Centre and Climatic Research Unit, 2023), the exhibition visualizes global temperature changes since the Industrial Revolution through multidimensional graphics. It highlights several critical ecological tipping points, such as the melting of the Greenland ice sheet, degradation of the Amazon rainforest, decline of Arctic sea ice, and extinction of coral reefs. Through interactive installations, multimedia experiences, and information panels, the exhibition simulates temperature rise scenarios and their ripple effects on biodiversity. Emphasizing “tangibility,” the design incorporates visual, auditory, and tactile dimensions—such as thermochromic materials and temperature rise simulation devices—to create an immersive and emotionally impactful experience. The exhibition further extends its influence through sustainable product design, including eco-friendly tickets, packaging, and cultural products, enhancing audience participation and emotional engagement. The concept of “public participation” is embodied in sustainability education modules and interactive feedback mechanisms, such as the “Future Commitment Card” and the “I Reduce Carbon for the Planet” message wall, guiding audiences from awareness to action. Following a design logic of “scientific facts → visual interpretation → public participation”, this project explores the role of design in environmental communication and climate action, fostering public understanding and emotional resonance, and emphasizing the potential and responsibility of design as a medium for social sustainability.
The escalating severity of global warming has prompted the scientific community to establish a critical objective: restricting the rise in global average temperature to 1.5°C or lower. Since the onset of the industrial revolution, anthropogenic greenhouse gas emissions have elevated global temperatures significantly. Without effective mitigation strategies, projections indicate a potential increase of 4°C to 5°C by the end of the 21st century, precipitating catastrophic consequences such as biodiversity loss, mass species extinction, and irreversible ecosystem collapse. These dire prospects underscore the necessity of stringent temperature control.The selection of the 1.5°C threshold is grounded in its scientific significance as a climatic tipping point. Exceeding this limit is associated with exponentially severe
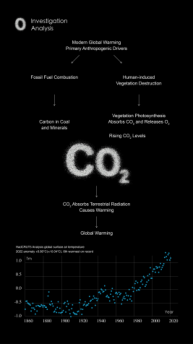
Figure 1: Map of anthropogenic causal pathways of global warming and temperature trends (Source: HadCRUT5 Global Surface Air Temperature Dataset, Met Office Hadley Centre and Climatic Research Unit, 2023; CO₂ causality schema based on IPCC Special Report on Global Warming of 1.5°C. (2018)
Global Warming Visualization Design
2. PROBLEM IDENTIFICATION
The following major problems were identified during the implementation of this project:
Insufficient public awareness: The public’s understanding of the 1.5°C global warming goal remains superficial, often reduced to a numerical target without tangible meaning. This abstraction hinders a sense of urgency or crisis.
Lack of visual communication for complex science: Key topics (e.g., greenhouse effect, biodiversity collapse) lack intuitive visualizations. Text-heavy reports and static data fail to convey real-world impacts, leaving audiences disconnected.
Low engagement in traditional science outreach: Traditional popularization of science lacks immersion and interaction: Static exhibitions and passive learning methods lack interactivity, limiting emotional resonance and motivation for action. Didactic approaches rarely drive behavioral reflection.
Figure 2: Do you feel global warming? -Visual Evocation Design Chart for Public Perception of Climate Change (aims to guide viewers from cognitive numbers to somatic reflection, emphasizing the role of emotional resonance in climate communication) Lack of guidance from cognition to action: Even with climate change awareness, the public often lacks clear pathways or motivation to translate knowledge into action. Without emotional engagement and participatory elements, climate communication remains superficial, failing to drive meaningful behavioral change. To address these challenges, this project employs an integrated approach combining scientifically-grounded information visualization with immersive display technologies. The design strategy seeks to simultaneously enhance cognitive understanding of climate change impacts and elicit affective engagement, thereby fostering motivation for pro-environmental action. By merging data-driven narratives with multi-sensory experiences, the solution aims to overcome the emotional and participatory limitations inherent in conventional science communication methods.
Figure available in the original PDF paper.
3. Design Thinking
3.1 Design Purpose
The main goal of this project is to present the scientific facts of global warming and the ecological crisis to the public through information visualization and immersive experience, so as to enhance their awareness of climate change and promote the widespread practice of low-carbon behaviors. In short, it is hoped that the audience can “see” and “feel” climate change, and then “act” to respond to climate change. 3.2 Core Concept This project employs data-driven visualization and immersive multi-sensory environments to bridge the gap between climate science literacy and actionable behavioral change, following a “ scientific data → visual interpretation → emotional resonance → action transformation ” framework. Research underscores that factual knowledge alone rarely motivates pro-environmental behavior, necessitating emotional engagement to activate agency. By translating abstract datasets — such as temperature rise or biodiversity loss — into visceral narratives (e.g., color gradients mapping warming trends, auditory cues simulating ecosystem collapse), the design elicits tangible emotional responses (e.g., urgency, apprehension) proven to drive behavioral intent. Unlike traditional science communication, which relies on passive text and static charts, immersive visualization enhances cognitive accessibility by distilling complexity into intuitive metaphors while multi-sensory integration (visual, auditory, haptic) heightens affective salience. For instance, interactive installations enable audiences to “touch” climate impacts, fostering a sense of immediacy that reframes abstract threats as tangible realities. This approach aligns with behavioral science’s “Knowing-Emotions-Actions” model, where immersive experiences stimulate cognition, emotions amplify motivation, and participatory guidance catalyzes action. Central to this strategy is public participation, which transforms audiences from passive recipients to active co-creators. Interactive elements like carbon footprint calculators or Future Commitment Cards operationalize active learning principles, deepening knowledge retention through hands-on engagement. Simultaneously, participatory design fosters ownership and collective accountability, as seen in social innovation’s “co-design” paradigm. When audiences contribute to solutions (e.g., drafting climate pledges), they internalize environmental responsibility, while peer-generated commitments create reinforcing social dynamics. This dual focus—theoretical rigor in communication mechanics and human-centered participatory logic—addresses the limitations of traditional science outreach by merging evidence-based design with experiential agency, ensuring climate awareness transcends abstraction to inspire sustained, community-driven action.
Global Warming Visualization Design
4. DESIGN OPTIONS
4.1 Concept The “Let the Earth Warm Up to 1.5℃” exhibition employs audience-centered design and multi-sensory immersion to guide visitors through a transformative journey from climate awareness to actionable behavior. Anchored in the authoritative HadCRUT global temperature dataset (tracking trends since 1860), the project grounds its narrative in empirical data, translating abstract warming patterns into intuitive visual metaphors—such as gradient color bars and dynamic curves—while correlating temperature anomalies with tangible ecological crises (e.g., polar ice melt, coral bleaching). This dual approach not only enhances cognitive accessibility but contextualizes data within real-world impacts, fostering emotional recognition of climate consequences. By embedding raw scientific data into interactive visualizations, the design answers a critical communication challenge: bridging the gap between statistical abstraction and visceral understanding. Central to the experience are participatory modules like the Future Commitment Card and Carbon Footprint Simulator, which reframe climate action as personal responsibility. The former invites visitors to document environmental pledges, transforming passive awareness into active ownership, while the latter quantifies individual emissions through relatable metrics (e.g., annual driving or electricity use). These tools operationalize behavioral science principles, where self-relevance and emotional investment drive sustained action. Tactile elements— such as heat-sensitive materials and temperature simulation devices—further amplify engagement by rendering climate impacts physically tangible. Leveraging psychological theories like experiential availability, these multi-sensory interactions heighten perceived risk urgency, making abstract warming trends feel immediate and actionable. Spatially, the exhibition employs a zoned progressive narrative, guiding visitors through past, present, and future climate timelines. Historical data visualization establishes foundational knowledge, while immersive projections of ecological disruptions (e.g., bleached reefs) evoke urgency. Future scenarios (1.5°C–5°C warming) culminate in advocacy zones where visitors translate empathy into pledges, completing the “perception → cognition → action” cycle. This structured flow avoids cognitive overload while ensuring emotional and informational coherence, positioning climate action as both a collective imperative and individual opportunity. The content of the exhibition is divided into four main zones, guiding the audience to experience the past, present and future time dimensions in turn, and then enter the action advocacy link to gradually build up a complete cognitive chain: Historical Data Zone: Leveraging the HadCRUT global temperature dataset, this zone visualizes 150 years of warming trends through dynamic temporal graphs and industrial-era emissions timelines. The design establishes an empirical foundation for human-induced climate change, enabling visitors to trace anthropogenic influence from the Industrial Revolution to present-day anomalies.
1. Current Crisis Zone: Multi-sensory projections and geospatial overlays depict real-time ecological disruptions, including coral bleaching thresholds and Arctic ice melt rates. By contextualizing temperature spikes with species extinction metrics and displaced communities, the zone operationalizes availability heuristics—making abstract data emotionally salient through relatable biophysical and societal impacts. 2.Future Prediction Zone: Immersive scenario modeling contrasts projected outcomes under 1.5°C, 3°C, and 5°C warming trajectories. Augmented reality simulations render future landscapes (e.g., submerged coastal cities, decertified farmlands), while haptic feedback devices simulate extreme heat stress. This tactile foresight methodology prompts critical inquiry: “Which future demands present action?”
3.Advocacy Zone: This final stage employs participatory co-design tools — including the Future Pledge Card and Carbon Footprint Dashboard—to operationalize climate commitments. Building on prior cognitive-emotional priming, the zone transitions visitors from passive observers to active stakeholders: written pledges formalize intent through behavioral commitment devices, while emission dashboards quantify individual/collective impacts via real-time data visualization. By embedding personal agency within systemic climate narratives, the design completes the “awareness → empathy → action” experiential pathway, transforming abstract concern into tangible behavioral accountability.
Figure 3: Design of the main visual scenario of the exhibition “Warming the Earth by up to 1.5°C” (visual immersion in climate change is enhanced by marine ecological elements and dynamic curvilinear installations) 4.2 Spatial Architecture Design The exhibition employs an open spatial layout (Vasconcelos & Cruz, 2022) with defined visitor pathways guiding sequential engagement across thematic zones— from greenhouse gas analyses to ecosystem impacts and mitigation strategies. This four-zone chronological framework (past-present-future-action) establishes a cohesive cognitive journey, balancing visual coherence with tailored atmospheric
Figure available in the original PDF paper.
Global Warming Visualization Design
shifts: historical sections emphasize empirical rigor, crisis zones evoke urgency through stark projections, future scenarios deploy cautionary simulations, and action areas foster empowerment via participatory tools. Spatial logic prioritizes unobstructed circulation, minimizing congestion while ensuring systematic exposure to critical data nodes. Thematic atmospheres synchronize with content progression, amplifying emotional resonance and reinforcing the imperative for climate agency. 4.3 Data Visualization Design The core data visualization content of the exhibition is based on HadCRUT4/5 global surface temperature data (1860 to 2020), and a series of temperature change curves and biodiversity loss projection charts have been produced in conjunction with key ecological events. Specifics include:
Global temperature change curves and their relationship with major ecological crises: a line graph showing the upward trend of the global average annual temperature over time, with major ecological events (such as large-scale coral bleaching or glacier melting in a particular year) labeled in the corresponding year of the curve, so that viewers can see how the climb of the temperature curve is accompanied by the frequent occurrence of ecological crises.
Figure 4: Global temperature change curves and ecological crisis events (data source: HadCRUT5 Global Surface Temperature Dataset, Met Office Hadley Centre and Climatic Research Unit, 2023; ecological events based on IPCC Special Report on Global Warming of 1.5°C (2018)) • Extrapolation of critical tipping points: Scenario simulations and graphical projections are used to show the different impacts that the Earth may experience when global warming reaches 1.5°C, 3°C, and 5°C, respectively. For example, coral reefs will bleach heavily under the 1.5°C scenario, the Amazon rainforest will degrade dramatically under the 3°C scenario, and permafrost will thaw
Figure available in the original PDF paper.
massively under the 5 ° C scenario, etc., and the relationship between the magnitude of warming and the degree of impacts is visually presented in a split- screen comparison.
Figure 5: Global temperature change curves and ecological crisis events (data source: HadCRUT5 Global Surface Temperature Dataset, Met Office Hadley Centre and Climatic Research Unit, 2023; ecological events based on IPCC Special Report on Global Warming of 1.5°C (2018)) • Typical Ecosystem Degradation Processes: Focusing on ecosystems that are highly sensitive to climate change, such as coral reefs, Arctic sea ice, and Amazon rainforests, their degradation processes against the backdrop of rising temperatures are demonstrated through infographics and animations. Viewers can see the evolution of coral reefs from lush to bleached, the trajectory of Arctic sea ice as it shrinks in size year by year, and the gradual degradation of rainforests due to drought and fire. These visualizations flesh out the macro climate change issue into vivid ecological stories, giving viewers a first-hand sense of the ecological costs of climate change.
Figure available in the original PDF paper.
Global Warming Visualization Design
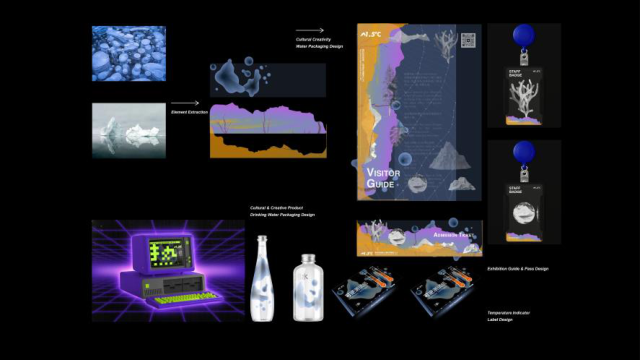
Figure 6: Schematic illustration of the impacts of global warming on ecosystem tipping points (data based on IPCC special report and Nature journal model projections with uncertainties) In designing these visualizations, we adhere to the principles of scientific rigor and artistic expression. All data are from authoritative studies to ensure that the information is accurate and credible; at the same time, easy-to-understand graphics and color schemes, as well as necessary textual explanations, are used to ensure that viewers can read and understand the charts and graphs regardless of their backgrounds. We also used interactive visualization techniques, such as touch screens for viewers to query specific years of data and select different emission scenarios for comparison, to enhance participation. Through these rich visualization tools, abstract climate data are given an intuitive form, and the complex evolution of ecological models is transformed into concise visual stories, greatly enhancing the educational effect of the exhibition. 4.4 Peripheral Design In order to enhance the sense of audience participation and communication effect, this project also designed a variety of exhibition peripheral products, including but not limited to: • Hot Melt Adhesive Record Cover (ISO, 2016): The record cover artwork made of special materials is a metaphor for greenhouse gases blocking the earth like a layer of transparent but hot adhesive. The frozen bubbles in the cover symbolize the trapped heat and show the vulnerability of the ecosystem under the stress of high temperatures.
Figure available in the original PDF paper.
The design combines scientific concepts with art, and when viewers take it away as a souvenir, the message of climate change enters public life.
Eco-friendly water cups and temperature measuring paper cultural and creative products: Climate awareness is integrated into daily products, such as color- changing temperature measuring paper attached to reusable eco-friendly water cups. When the cup is filled with hot water, a pattern or warning message related to the warming of the Earth appears on the paper, reminding users to save energy and reduce carbon emissions. Through these daily-use products, the concept of low-carbon life is conveyed, and environmental protection reminders are continuously generated in the audience's daily use.
Electronic tickets: The exhibition tickets are designed as electronic tickets or reusable NFC access cards, replacing paper tickets to reduce carbon emissions. At the same time, the e-ticket is preloaded with digital content and interactive links related to the exhibition, so that visitors can scan the code after visiting the exhibition to obtain extended information or participate in online community discussions. This design echoes the environmental theme of the exhibition and extends its reach.
These peripheral designs, as an extension of the exhibition, not only enrich the visitors' experience, but also bring climate communication from the exhibition hall into daily life. During the development of the peripheral products, we have always focused on the two main principles of environmental protection and participation: using biodegradable or recyclable materials as much as possible in the selection of materials, and emphasizing the interaction between the user and the concept of environmental protection in the design of functions. By allowing visitors to use, wear or display these peripherals, they naturally become “ secondary communicators ” of climate communication, passing the message of the exhibition to more people, thus magnifying the social impact of the project.
Figure 7: Schematic application of thermosensitive materials for low-carbon advocacy in cultural and creative products (material properties refer to ISO 14021 environmental labeling standard)
5. CONCLUSION
At its core, this project is about reconnecting humanity to our planet’s story. By transforming cold climate data into vivid, sensory experiences, we’ve sought not just to inform, but to awaken—to remind viewers that behind every temperature curve and tipping point lie fragile ecosystems, vulnerable communities, and the futures of our children. The exhibition’s true success lies not in its technical innovations, but in how it repositions climate action as a profoundly human endeavor: a shared journey where understanding takes root in the mind, empathy blooms in the heart, and responsibility stirs in the hands. When a child touches a heat-sensitive map and gasps at vanishing glaciers, when a parent pauses at a carbon footprint dashboard and rethinks their commute, or
Global Warming Visualization Design
when a student signs a pledge card with trembling resolve—these are moments where abstract science becomes personal truth. Design, here, acts as a bridge between our intellect and our humanity, proving that data alone cannot move us, but human stories—of loss, hope, and resilience—can. This work reaffirms a simple yet radical idea: climate action begins not in labs or policy halls, but in the quiet spark of connection between people and planet. By inviting visitors to feel the heat of a warming Earth and own their role in its future, we’ve seen strangers become allies, indifference transform into urgency, and helplessness give way to collective courage. As we face an uncertain climate future, let this project stand as a testament to the power of design that honors both science and soul. For in the end, saving our world demands more than graphs and goals—it requires us to rediscover our place within Earth’s delicate web, not as conquerors, but as caretakers. The greatest innovation here is not technological, but human: a reminder that when we design with empathy, we dont just communicate crises—we nurture the compassion and creativity needed to heal them. What we have built is not an exhibition, but an invitation: to see, to care, and to join hands in rewriting Earth’s next chapter—together.
REFERENCES
IPCC. (2023). Climate Change 2023: Synthesis Report. Geneva, Switzerland: Intergovernmental Panel on Climate Change. Met Office Hadley Centre and Climatic Research Unit. (2023). HadCRUT5 Global Surface
Temperature Data Set. Exeter, UK: Met Office. Carvalho, V.C. (2022). Decoration and Nostalgia – Historical Study on Visual Matrices and Forms of Diffusion of Fêtes Galantes in the 20th Century. Human Dynamics and Design for the Development of Contemporary Societies, 25, 1–9. Vasconcelos, A.T., & Cruz, J. (2022). Design Strategies for Socio-Environmentally
Adverse Territories. Human Dynamics and Design for the Development of Contemporary Societies, 25, 221–237. Gladkova, T., et al. (2023). CHAAIS: Climate-Focused Human-Machine Teaming and Assurance in AI Systems. Artificial Intelligence, Social Computing and Wearable Technologies, 113, 1–13. United Nations. (2015). Transforming our World: The 2030 Agenda for Sustainable
Development. New York, NY: United Nations. Fogg, B.J. (2003). Persuasive Technology: Using Computers to Change What We Think and Do. San Francisco, CA: Morgan Kaufmann. ISO. (2016). ISO 14021:2016 Environmental Labels and Declarations — Self-Declared
Environmental Claims. Geneva, Switzerland: International Organization for Standardization.
LISTED IN THE AHFE DIGITAL BOOKSTORE CATALOGUE
Explore the complete digital volume
Human Factors in Communication of Design
Read this individual research paper free through the original publisher, or explore the full digital proceedings book.
ISBN 978-1-964867-53-3
Explore this ISBN in the AHFE Bookstore ↗Listed in the July 2026 bookstore catalogue; search by ISBN to confirm current availability · Digital book purchase optional