Ahmed Farooq, Mehmet Mertkan, Toni Pakkanen, Roope Raisamo (2025). Evaluating the Impact of Head-Up-Display Position for Navigation Systems on Driver Safety and Usability. In: Intelligent Human Systems Integration (IHSI 2025): Integrating People and Intelligent Systems. AHFE Open Access, vol. 160, pp. 464–474. https://doi.org/10.54941/ahfe1005851
Head-Up Displays (HUDs) in passenger vehicles are increasingly recognized as a promising technology for enhancing driver immersion and improving road safety by projecting essential information directly into the driver’s line of sight. Despite the apparent advantages, HUD systems have also been associated with challenges, particularly concerning cognitive overload and the possible impact on drivers' focus and overall safety. This study seeks to address these concerns by evaluating HUD navigation systems in comparison with traditional Head-Down Display (HDD) systems. To systematically investigate the effects of HUDs on driver behaviour, a controlled driving simulator study was developed and tested by 22 participants. Each participant engaged in driving tasks using both HUD and HDD interfaces, allowing for a direct comparison of driving behaviour on key behavioural metrics. Authors evaluated variances in the participants' attention to road conditions, their cognitive load, and interaction patterns with the navigation systems. In addition to these objective measures, subjective feedback was collected from participants to capture their personal impressions and preferences regarding the usability and effectiveness of each display type in the simulated Laboratory driving environment. The findings from this research highlight several notable advantages of HUD systems. A significant majority of participants expressed a preference for HUDs, primarily due to the reduced need for frequent focal shifts between the display and the road, which allowed them to maintain better situational awareness of their surroundings. Quantitative performance metrics, such as the duration of road focus and the accuracy of environmental perception, were consistently higher when participants utilized HUDs compared to HDDs. The research offers specific recommendations for future design refinements aimed at achieving an optimal balance between information presentation and driver safety, paving the way for more effective and safer HUD integration in future vehicle models.
Head-up displays (HUDs) have gained significant attention for their potential to enhance vehicle safety by projecting critical driving information directly into the driver’s line of sight. Numerous studies support the claim that HUDs can reduce distractions by eliminating the need to look away from the road. However, some research suggests that HUDs may introduce new distractions,
Evaluating the Impact of Head-Up-Display Position for Navigation Systems 465
particularly when too much visual information is displayed, which could adversely affect driving performance (Niakan et al., 2015). The question of whether HUDs improve overall safety or inadvertently create distractions remains contested, with mixed results across various studies.
The central debate revolves around the balance between providing essential information and overloading drivers with unnecessary details. While HUDs offer real-time updates on navigation, speed, and road conditions, which improve situational awareness and reduce reaction times (Kiefer, 1991), there is concern that visual clutter could overwhelm drivers, leading to cognitive overload (Zhu et al., 2021). This raises a critical research question: does the integration of HUDs in vehicle navigation systems truly enhance safety, or does it lead to new forms of distraction and risk?
Previous research has primarily focused on the safety implications of HUDs as standalone systems, but limited attention has been given to their role in integrated navigation systems compared to traditional head-down displays (HDDs). The absence of studies specifically examining HUDs in the context of navigation systems leaves a gap in our understanding of how these technologies influence driver behaviour. Given the widespread use of in-car navigation and the increasing reliance on advanced driver assistance systems (ADAS), this research is crucial for assessing the real-world impact of HUDs on driving performance.
Moreover, advances in HUD technology have expanded their functionality beyond basic navigation and speed display. Modern HUDs now offer augmented reality (AR) features and entertainment options, raising concerns about the potential for cognitive overload. Recent studies (Oleg et al., 2023; Farooq et al., 2020; Farooq et al., 2019) suggest that while HUDs can improve driver focus, the integration of AR elements may complicate the driving task by introducing excessive visual information (Bram-Larbi et al., 2020; Li et al., 2022). This highlights the need for further research into optimizing HUD interfaces to maintain safety without overwhelming the driver.
The goal of this research is to assess the effectiveness of HUDs in vehicle navigation systems compared to traditional HDDs. Specifically, this study will evaluate how each system affects driver attention, reaction times, and overall safety. By conducting controlled experiments with participants using both HUDs and HDDs, the study will provide insights into whether HUDs enhance or detract from driving performance in real-world scenarios (Cao et al., 2024). Additionally, potential updates and optimizations for HUD systems will be discussed to ensure that future implementations strike the right balance between utility and safety.
Compared to HDDs, HUDs offer the advantage of reducing the frequency and duration of distractions by projecting information directly in front of the driver. This minimizes the need to look down at central consoles and allows for more fluid interaction with navigation and vehicle status information. However, this research aims to delve deeper into the effects of HUDs on driver attention and safety, offering practical recommendations for improving HUD technology in future vehicles.
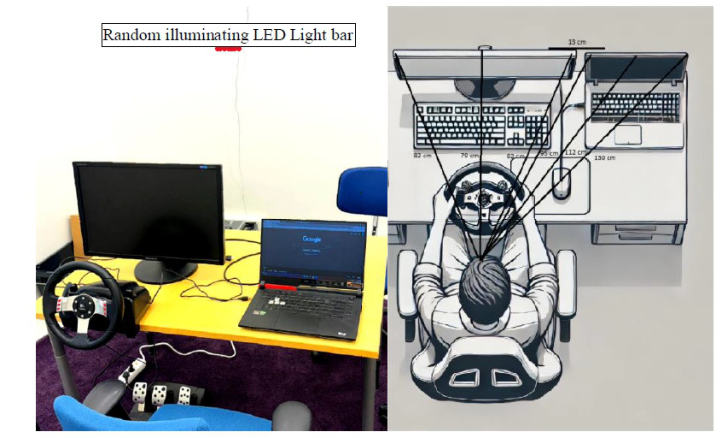
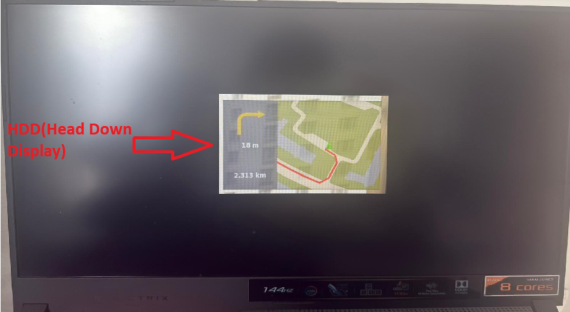
EXPERIMENTAL SETUP City car driving simulator designed for realistic experience of urban driving was used in this project (City car driving - car driving simulator, PC game 2016). System developed by forward development available on multiple platforms including pc and gaming consoles. The primary goals of the game teach players how to drive. It is also used educational purposes because of realistic driving physics, detailed urban environments, driving scenarios and challenges. Pre-program navigation was installed inside the game with for each turn. Driving scenarios and challenges also used on the same level for each participant. To simulate close impression of the real car, two screens were used in this project one of them represented a HUD and other one represented the HDD. The main screen was a 27-inch Dell monitor with 1920x1080 resolution and secondary screen was a 16-inch laptop display with the same Full HD resolution. Both screens had their refresh rates capped at 144. The HUD navigation display was approximately 5 cm wide and was positioned in the upper right corner, (Fig. 2) approximately 60 cm from the middle of the screen. The drivers simulated the HUD system by looking directly to the screen. For HDD the authors utilized a 16-inch laptop display which displayed only the navigation system in the middle of the screen. The navigation system measured approximately 7 cm long and 5.5 cm wide (Fig. 2) on the screen. The laptop display was kept closed while the HUD system was used. During the experiment a visual distraction outside both displays was created to random blink by illuminating a sequence of 20 red LEDs. The light bar was attached to the wall 130 cm above the ground within peripheral view but not directly visible to the driver, when turned off. During the test, it was turned on and off 5 times and whether it distracted the drivers was tested both by observation and with the head tracking system.
Figure 1: Illustrating test system and top view of angles.
Evaluating the Impact of Head-Up-Display Position for Navigation Systems 467
Figure 2: Illustrating HDD and HUD system interface.
Participants In total 22 participants took part in the study. The group consisted of 13 Male and 9 women with an average age of 28.3. All the participants had their official driving licence in Finland or another European country. All participants met the official vision requirements for a valid driver in Finland, with two participants having correct vision through prescription glasses. In terms of HUD experience 17 participants had never used HUD previously, whereas two participants had extended experienced, another two recorded have some experience and one participant reported only using the technology once before.
Procedure The experimental setup was developed using a vertically adjustable seat with fixed position of displays and HUDs. A G27 steering wheel and pedals were used to replicate the driving control along with a driving simulator “City Driver”. Before starting the actual experiment, participants were given a
5 mins in normal traffic to get used to the steering system, pedals, HUD and HDD system. After this process, the actual experiment was started.
In the test the participants were instructed to drive their vehicle and feel as relaxed as they would in normal circumstances with full control of the test car. One of the goals was to guarantee that they understand the displayed information given to them and complete every other driving operation without any mistake. This included the ability to follow the traffic regulations, observe lane control and avoid an eventual accident. As for the specific procedures, participants were to drive and follow measures that are taken on the roads and pay a lot of attention to the navigation instruction provided to them on the map. A second map with the same length and density but a different destination was given to users after the first destination on the map was successfully reached. This new task was introduced on another screen in the experimental condition as one of the modifications to the participants’ goals. This was done to ensure participants did not habituate to the location of the navigation map on the display.
This part of the experiment aimed at determining whether the participants keep their performable baseline while following a different route. As this task was more complex and required greater head movements, the aim was to compare the performance over a more challenging environment. Additionally, during the simulation, some onscreen event were staged with the purpose of measuring the participants’ response time (through breaking) as well as their alertness levels (time to start breaking). For example, people would suddenly jump in front of the test vehicle with minimum warning. Furthermore, other vehicles in the simulation would sometimes move erratically and/or stop suddenly in the middle of the intersection or a lane which created traffic congestion and a possibility of causing additional traffic accidents. These were designed in such a manner that levels of attentiveness and response instabilities among the participants were to be tested under conditions of emergencies. Each participant was experienced three such cases during their drive for both HUD and HDD conditions. The results of each drive were analysed for variances and are discussed in the following section.
RESULTS AND DISCUSSION
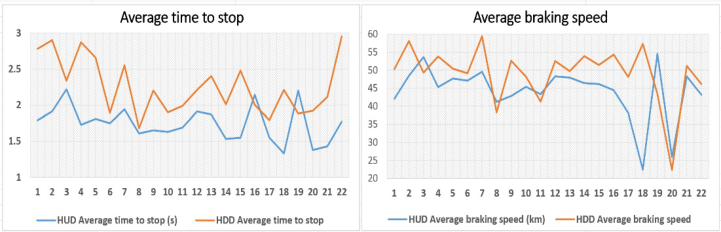
Overall, both conditions (HUD, HDD) were reported to be usable and informative by all participants. All the participants completed every task, reaching the designated target as instructed. Completion of these tasks was recorded with high rates of accuracy both in tasks for head up 98.1% and head down: 96% (Fig. 3).
As illustrated in Fig. 3, the average stopping time varied significantly between participants and the two conditions HUD and HDD. This noticeable variability in the stopping times was due to the speed at which each participant applied the brake. With the HUD system illustrating more consistent performance comparing to HDD system. HUD average stopping time was x 1.75 while HDD was x 2.26. There was a slight difference between two values. HDD value shows potential inconsistencies in driver
Evaluating the Impact of Head-Up-Display Position for Navigation Systems 469
response while looking central navigation system while driving. This result was obtained by calculating HUD vs HDD average braking speeds(km) and average time to stop value(s) which provided by simulator. Deceleration is a critical safety parameter that appears to be more stable for the HUD system than HDD navigation system. The HUD system consistently results in higher deceleration values which represent more effective communication of braking and response time. A paired samples t-test was conducted to determine the difference between HUD and HDD deceleration values. The results indicates that there is significant difference between HUD and HDD deceleration. The average HUD deceleration was 7.04 (M = 7.04; SD = 0.99), and the average HDD deceleration was 6.13 (M = 6.13; SD = 1.09) [t(21) = 3.303, p = 0.003].
Figure 3: Average time to stop (left), and average breaking speed between HUD and HDD system.
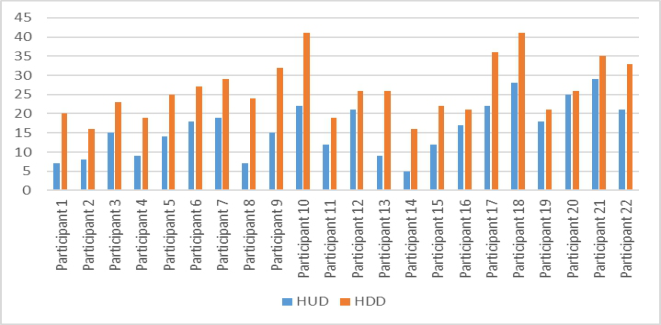
Head Tracking To measure the participant’s attention on the road, head tracking was used in the simulator setup. The apparatus measured drivers’ attention and how many times they turned their head away from the road. A distractor was also initiated during the driving session, this was to see if the participants recognized external distractions (i.e., a red LED strip affixed to the front wall just outside the direct eyeline of the participants). The Figure below (Fig. 4) shows how many times they turn their head away from the road.
For example, Participant 1 rotated their head 20 times while using the HDD but only rotated 7 times in the case of using the HUD. Such distribution pattern is observed with all participants, but on average head turns are higher of the HDD condition. Most of all, Participant 10 showed the highest percentage, tilting the away head 41 times for HDD and 22 using HUD. The bar chart below represents total number of turns during the simulation sessions.
The findings (Fig. 4) of the data analysis uncovered multiple essential insights. Statistical analysis reveals that the average score for HUD is 16.05, and the standard deviation is 6.96, indicating that participants’ responses vary somewhat. The scores have a range from a low of 5 to a high of 29. In contrast, HDD scores have a mean of 26.27 and a slightly greater standard deviation of 7.36, with scores ranging from 16 to 41. This implies that the
participants normally scored higher on HDD than on HUD, but with equal variance. The correlation analysis demonstrated a strong positive correlation between scores of HUD and HDD, with a correlation coefficient around 0.773. High (HUD) scores were linked to high visual and cognitive load while lower rate shows lower visual load.
Figure 4: Head tracking illustrates how many times each participants turn their head out of road while driving.
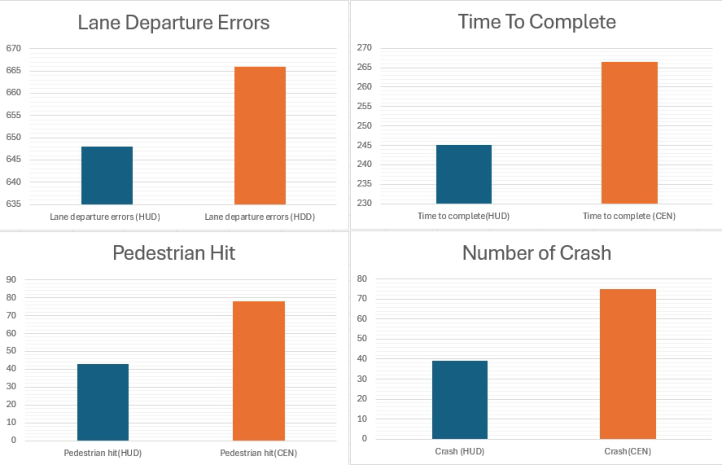
Initial Safety The data typically captures the efficiency of these systems in the areas of task completion time and driving performance, effectiveness in avoiding crashes/pedestrian hits, and lane departure accuracy. For example, the time to finish the task differed between HUD and HDD, yet some of the participants spend more or less time performing tasks with the help of the applied display systems. Also, the number of crashes, pedestrian exchanges, and the number of lane departure errors, inform us of the possible dangers linked with each of the above-mentioned display style. It is essential for the comparison of the performance and safety in usage of the HUDs in comparison to the HDDs during driving. Most of the results showed HUD system is more secure than HDD. Although this difference was not statistically significant except from pedestrian hit scores [t(21) = −3.271, p = 0.004].
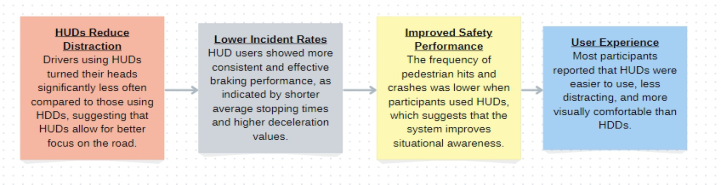
Questionnaires In addition to the above analyses of driving performance, to better explain the participants’ preferences, we gave the participants a document consisting of 4 questions at the end of each session. Eighteen of the participants had a general preference for HUDs as opposed to the two who preferred HDDs. Among the participants, 16 responded that HUDs were more easily used compared to HMI and five responded that both systems were equally easy to use. Regarding the distraction levels, 17 participants sighted that, HUDs were less distracting than HDDs and 2 participants stated they preferred HDDs
Evaluating the Impact of Head-Up-Display Position for Navigation Systems 471
over HUDs. Finally, in the visual comfort factor, 19 of the subjects reported that they preferred the Awareness Level of HUDs, to reduce head and eyes swinging motions. These findings imply that HUDs have less interference with the user and make the automobile interior more visually comfortable compared to HDDs. As a result of the research conducted and the results obtained above, we see that the HUD system gives better results compared to the HDD.
Figure 5: Bar chart demonstrates lane departure errors. Time to complete, pedestrian hit and number of crashes parameters between HUD and HDD.Figure 6: Bar chart demonstrates lane departure errors. Time to complete, pedestrian hit and number of crashes parameters between HUD and HDD.
The experimental data and subjective feedback from 22 participants indicate that braking and deceleration are among the most important measurements of safety because drivers can never predict when drivers are less attentive or in complex driving conditions. Issues of the braking technique of the vehicle, the status of the road and the ability to react to an event also come into play. In this research, it is pointed out that in-car ADAS systems for advance warnings may also affect the drivers depending on their
driving experience. Although precise reaction times were not calculated in this study, the deceleration rates were examined, and the deceleration average was with HUDs 7.04 m/s2 lower than with HDDs 6.13 m/s2. For the total sample, there was statistically significant difference between the mean speed, and the distance travelled while the car was accelerating and decelerating, self-reported HUD use and the reaction time and force of brake (p = 0.003).
Further, data and analysis is needed to gauge if conditions with fewer pedestrian impacts and crashes would yield similar result. However, results of this study show that participants made fewer head movement and break earlier using HUDs than HDDs. These results support earlier work by Gish & Staplin, (1995) and Young & Stanton, (2007) and Mendoza, (2020). Additionally, this would mean that the integration of other advanced systems such as AR-HUDs and attention-monitoring cameras can potentially boost safety even further. Since generally, participants preferred HUDs because of fewer distractions and more utility, the setup demonstrates that HUD is paramount to enhancing safety and usefulness of vehicle navigation technology as automobile manufacturers transition between levels of autonomy (SAE Level 2 and Level 3). Results illustrate that HUD systems should no longer be offered as an additional piece of equipment in vehicles, at least not as a navigation feature, but rather as a standard safety system, similar to traction control, lane keep assist or advance collision warning. Moreover, as manufacturers transition to brighter and higher resolution HUDs which are more adaptable in nature, road safety can be increase further. Display technology and multimodal electronic interfaces (Farooq et al., 2014) for in-vehicle heads-up displays with adjustable brightness, customised placement and information content can all contribute toward safer road conditions (Zhu, & Zhang, 2020). Future HUD systems must offer personalization this allow users to select greater customisation and provide drivers the ability to select relevant information to be displayed on the windscreen.
CONCLUSION
This study utilized a driving simulator to obtain participants’ quantitative performance data and participants’ qualitative self-reports of their experience of using HUD and HDD systems. Authors evaluated driving data from 22 participants who undertook complex driving tasks with both types of navigation systems. Braking time, deceleration values as well as Head movements were also used as measures to determine the effect of HUDs on driving performance.
The results clearly show that fewer head movements are needed using HUDs, which indicates less distraction and better braking performance as compared to the HDD implementation within this setup. Moreover, the results confirmed participants’ stronger preference for the HUD system motivated by quotes such as “it was easy to control and did not hinder my actions”. Overall HUD yielder few errors and faster task completion times.
This study was conducted in a controlled environment, where experimental data was collected using a driving simulator. Additional
Evaluating the Impact of Head-Up-Display Position for Navigation Systems 473
research is necessary to be conducted to validate these results. Moreover, within applied setting additional variables could potentially impact driver performance, which need to be tested further. Within the scope of this study, real-world environment phenomena such as rain, traffic jams and unpredictable road conditions, were not studied and can be factors effecting the overall results. Hence, future investigations need to consider real-test situations to confirm the results of this study gauging how effectively HUDs operate under more complicated conditions.
The present study also has the limitation of having a small and a homogenous sample of respondents. It is important to note that the participant pools in the present studies were relatively homogeneous, mostly consisting of young university male drivers with limited driving experience using HUD. Therefore, our future work will include a more diverse sample size, ensuring the inclusion of older and more experience drivers, or drivers with little to no prior HUD experience. This approach would give a much broader perspective of how different conditions affect various demographics of drivers and their diving performance.
ACKNOWLEDGMENT
This research is part of the MIXER project. The project develops methods for machine understanding of different driving situations, particularly monitoring driver states (e.g., gaze direction, alertness). This facilitates optimising presented information according to the situation and urgency. Authors focus in this research was to develop multimodal interaction where information is visible on multiple screens, as audio, or as haptic feedback. The MIXER project is funded by Business Finland and research is conducted primarily at Tampere University alongside project partners.
REFERENCES
Bram-Larbi, K. F., Charissis, V., Khan, S., Lagoo, R., Harrison, D. K., & Drikakis, D. (2020). Collision avoidance head-up display: Design considerations for emergency services’ vehicles. In 2020 IEEE International Conference on Consumer Electronics (ICCE) (pp. 1–7). IEEE. Cao, Y., Li, L., Yuan, J., & Jeon, M. (2024). Head-up Displays Improve Drivers’
Performance and Subjective Perceptions with the In-Vehicle Gesture Interaction System. International Journal of Human–Computer Interaction, 1–15. City car driving - car driving simulator, PC game (2016) City Car Driving - Car Driving Simulator, PC Game. Available at: https://citycardriving.com/ (Accessed: 10 September 2024). Farooq, A., Evreinov, G., Raisamo, R. (2020). Providing Comprehensive Navigational Cues Through the Driving Seat to Reduce Visual Distraction in Current Generation of Semi-autonomous Vehicles. In: Ahram, T., Karwowski, W., Vergnano, A., Leali, F., Taiar, R. (eds) Intelligent Human Systems Integration 2020. IHSI 2020. Advances in Intelligent Systems and Computing, vol. 1131. Springer, Cham. https://doi.org/10.1007/978-3-030-39512-4_135 Farooq, A., Evreinov, G., Raisamo, R., Hippula, A. (2019). Developing Intelligent
Multimodal IVI Systems to Reduce Driver Distraction. In: Karwowski, W., Ahram, T. (eds) Intelligent Human Systems Integration 2019. IHSI 2019. Advances in Intelligent Systems and Computing, vol. 903. Springer, Cham. https://doi.org/10.1007/978-3-030-11051-2_14
Farooq, F., Evreinov, G., Raisamo, R., Mäkinen, E., Nukarinen, T., Majeed, A. A. (2014) Developing novel multimodal interaction techniques for touchscreen in-vehicle infotainment systems, 2014 International Conference on Open Source Systems & Technologies, Lahore, Pakistan, 2014, pp. 32–42, doi: 10.1109/ICOSST.2014.7029317. Gish, K. W. and Staplin, L. (1995) (PDF) human factors aspects of using head up displays in automobiles: A review of the literature. Kiefer, R. J. (1991) Effect of a Head-Up Versus Head-Down Digital Speedometer
on Visual Sampling Behavior and Speed Control Performance During Daytime Automobile Driving, https://www.jstor.org/stable/44632015. Available at: https: //www.jstor.org/stable/44632015. Li, S., Wang, Z., & Liu, J. (2022). Head-up displays and cognitive load: Revisiting driver distraction with new technology. Transportation Research Part F: Traffic Psychology and Behaviour, 85, 123–135. Mendoza, J. (2020). Head-up displays vs. head-down displays for vehicle navigation
with implemented driving distractions. In IIE Annual Conference. Proceedings (pp. 1074–1079). Institute of Industrial and Systems Engineers (IISE). Niakan, F., Vahdani, B. and Mohammadi, M. (2015) ‘A multi-objective optimization model for Hub Network Design under uncertainty: An inexact rough- interval fuzzy approach’, Engineering Optimization, 47(12), pp. 1670–1688. doi: 10.1080/0305215x.2014.992891. Spakov, O., Venesvirta, H., Lylykangas, J., Farooq, A., Raisamo, R., Surakka, V. (2023). Multimodal Gaze-Based Interaction in Cars: Are Mid- Air Gestures with Haptic Feedback Safer Than Buttons?. In: Marcus, A., Rosenzweig, E., Soares, M. M. (eds) Design, User Experience, and Usability. HCII 2023. Lecture Notes in Computer Science, vol. 14032. Springer, Cham. https://doi.org/10.1007/978-3-031-35702-2_24 Zhu, A., & Zhang, C. (2020). The Value and Application of Car Head-Up Display
in Interactive Design. In Proceedings of the 2nd International Conference on Artificial Intelligence and Advanced Manufacture (pp. 478–483). Zhu, Y. et al. (2021) A experimental study of the cognitive load of in-vehicle multiscreen connected Hud, SpringerLink.
LISTED IN THE AHFE DIGITAL BOOKSTORE CATALOGUE
Explore the complete digital volume
Intelligent Human Systems Integration (IHSI 2025): Integrating People and Intelligent Systems
Read this individual research paper free through the original publisher, or explore the full digital proceedings book.
ISBN 978-1-964867-36-6
Explore this ISBN in the AHFE Bookstore ↗Listed in the July 2026 bookstore catalogue; search by ISBN to confirm current availability · Digital book purchase optional