Sharon Hsiao, Harsha Kasi, Daniel Hruschka, Robert Bischoff, Matthew Peeples (2024). CatMapper: user interface support for large complex categories and semantic data exploration. In: Human Factors in Design, Engineering, and Computing. AHFE Open Access, vol. 159, pp. 251–256. https://doi.org/10.54941/ahfe1005589
Scientists and policymakers are increasingly leveraging complex, multi-scale data from diverse, worldwide sources to understand the causes and consequences of economic development, social stratification, climate change, cultural diversity, and violent conflict. This work frequently requires integrating data across diverse datasets by complex, dynamic categories (e.g., ethnicities, languages, religions, subdistricts). However, different datasets encode corresponding categories in disparate formats and at different resolutions (e.g., Guatemala Indigenous vs. Maya vs. K’iche’). These diverse encodings must be translated across datasets before bringing them together for analysis. At global scales across thousands of categories, the combinatorial complexity creates thorny challenges for manual reconciliation and for transparent documentation and sharing of researcher decisions. There is a need to investigate direct and uncomplicated ways to support search and explore the semantics for complex and diverse datasets.We design and deploy such a tool, CatMapper, to support semantic discovery through exploration and manipulation for large, complex and diverse datasets. CatMapper enables exploring contextual information about specific categories, translating new sets of categories from existing datasets and published studies, identify and integrating novel combinations of datasets for researchers’ custom needs, including automatically generated syntax to merge datasets of interest, and publishing and sharing merging templates for public re-use and open science. CatMapper does not store observational data. Rather, it is a dynamic, interactive dictionary of keys to help users integrate observational data from diverse external datasets in disparate formats, thereby complementing and leveraging a fast-growing ecology of datasets storing observational data. We have conducted heuristic evaluation on CatMapper usability. Results shed lights on enriching semantic data discovery.
Scientists and policymakers are increasingly leveraging complex, multi- scale data from diverse, worldwide sources to understand the causes and consequences of economic development, social stratification, climate change, cultural diversity, and violent conflict. This work frequently requires integrating data across diverse datasets by complex, dynamic categories (e.g., ethnicities, languages, religions, subdistricts). However, different datasets encode corresponding categories in disparate formats and at different resolutions (e.g., Guatemala Indigenous vs. Maya vs. K’iche’). These diverse encodings must be translated across datasets before bringing them together for analysis. At global scales across thousands of categories, the combinatorial complexity creates thorny challenges for manual reconciliation and for transparent documentation and sharing of researcher decisions. There is a need to investigate direct and uncomplicated ways to support search and explore the semantics for complex and diverse datasets.
We design and deploy such a tool, CatMapper, to support semantic discovery through exploration and manipulation for large, complex and diverse datasets. CatMapper enables exploring contextual information about specific categories, translating new sets of categories from existing datasets and published studies, identify and integrating novel combinations of datasets for researchers’ custom needs, including automatically generated syntax to merge datasets of interest, and publishing and sharing merging templates for public re-use and open science. CatMapper does not store observational data. Rather, it is a dynamic, interactive dictionary of keys to help users integrate observational data from diverse external datasets in disparate formats, thereby complementing and leveraging a fast-growing ecology of datasets storing observational data.
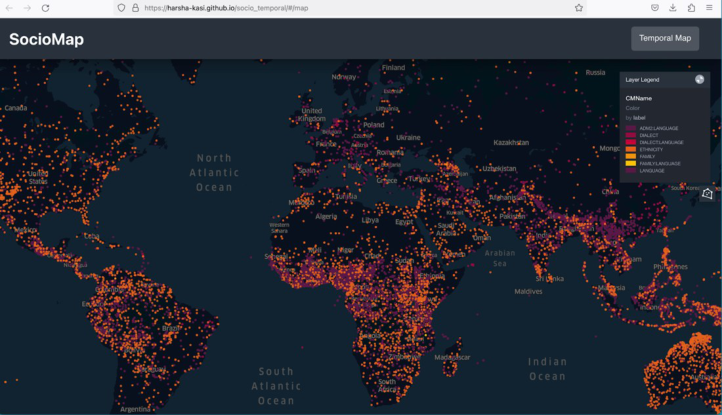
In Figure 1, we present SocioMap, an instance of CatMapper that visualizes the distribution of all the available datasets in the system. Table 1 illustrates the dataset coverage in the SocioMap.
Figure 1: SocioMap. an instance of CatMapper that organizes the thousands of sociopolitical categories.Table 1. The dataset coverage summary of SocioMap.
Table available in the original PDF paper.
Focus Datasets Areas Ethnicities Languages Religions Attitudes, values, and beliefs 774 27,475 13,441 2,720 1,651 Genetics 3 0 461 1 0 Geospatial boundaries 3 194,045 1,362 1 0 Health and human biology 1,077 5,112 3,065 649 598 Social and demographic 1,721 28,057 13,633 1,828 1,657
CatMapper: User Interfaces Support for Large Complex Categories 253
System Design CatMapper aims to improve the efficiency, accuracy and transparency of the key steps in the reconciliation and merging process by (1) automating tasks when possible, but eliciting (and documenting) user input when ambiguities arise (Holzinger, 2016), (2) maintaining a well-documented and expandable repository of categories and translations so users can build from prior work rather than duplicating effort, and (3) documenting user decisions in a common machine readable form for easy inspection and re-use by future users. CatMapper does this with four sets of tools aimed at (1) exploring contextual information about a specific category, (2) translating new classification schemes to existing ones in CatMapper, (3) integrating data from multiple external datasets by categories, and (4) documenting and sharing researcher decisions when integrating data for their specific study (Hruschka et al., 2022).
CatMapper currently focuses on the domains of categories commonly used in diverse social sciences that pose challenges for data synthesis because they have a large number of categories frequently nested at multiple scales and encoded by thousands of datasets in idiosyncratic ways. The sociopolitical categories are defined by ethnicity (Alesina et al., 2013; Hillesund, 2017; Kirby et al., 2016), religion (Matthews, 2012), language (Kirby et al., 2016; Liu & Pizzi, 2018), and administrative subdistricts (Ruggles et al., 2011; Schürer et al., 2018; Zhukov et al., 2017; Kugler et al., 2015; Pezzulo et al., 2017; Carrao et al., 2016; Samberg et al., 2016; Sundström & Wängnerud, 2018; Falk et al., 2018; von Grebmer et al., 2017; Smits & Permanyer, 2019) —are crucial for a wide range of comparative analyses (Østby et al., 2011; Zhang et al., 2017; Suiter& Taylor, 2016; Azzarri et al., 2016).
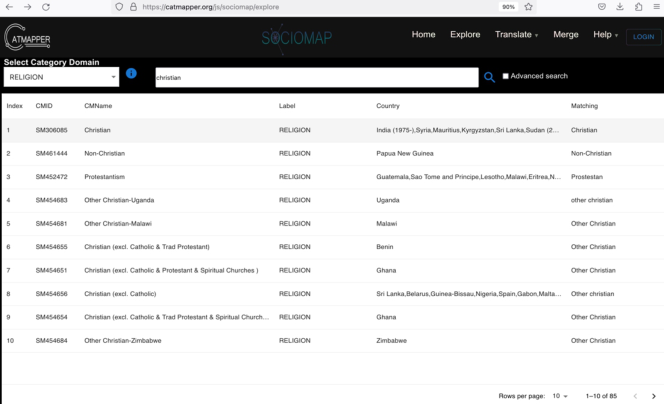
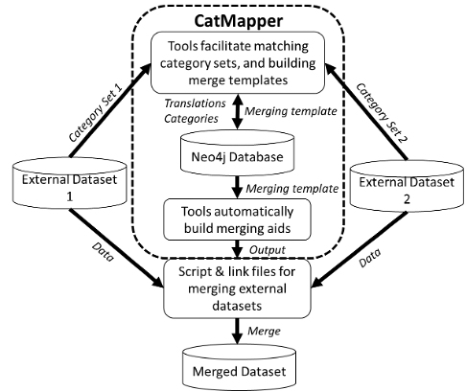
The system interface is shown in the Figure 2; The system architecture is illustrated in the Figure 3.
Figure 2: Front-end explore function in the SocioMap.Figure 3: Back-end architecture of the system.
USER STUDY & RESULTS A heuristic study was designed and administered to evaluate the Explore function in the SocioMap. There were 29 participants in the study. They were a combination of junior and senior students in the class of web usability offered from the Department of Computer Science Engineering at the authors’ institute. The study was designed and tasked as one of the lab assignments allowing students to practice exercising heuristic evaluation principles. Jakob Nielsen’s (Nielsen, 1994) 10 interaction design heuristics were introduced a week prior to the study. The participants followed the standard expert review procedure with a small group 3–5 people, evaluate individually, aggregate discovered issues, apply severity ratings, and summarize the results.
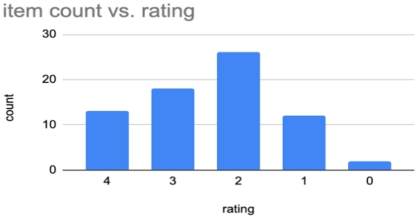
There were 71 items listed across 10 heuristics by 7 groups of 29 students. Based on the severity ratings outcome, 56.3% of the items were minor or cosmetic user interface issues; 18.3% of categorized as catastrophic issues; 25.3% items were rated as major issues.
Figure 4: Preliminary heuristic evaluation on SocioMap explore function outcome.
CatMapper: User Interfaces Support for Large Complex Categories 255
CONCLUSION
Our preliminary study demonstrated that the deployed tool, CatMapper, specifically the SocioMap user interface, supported semantic discovery and data exploring. Several heuristic issues were surfaced out during the evaluation, which motivated us and provided guidelines for the next iteration of the system development.
REFERENCES
Alesina A, Giuliano P, Nunn N: On the origins of gender roles: Women and the plough. The Quarterly Journal of Economics 2013, 128(2): 469–530. Azzarri C, Bacou M, Cox CM, Guo Z, Koo J: Subnational socio-economic dataset
availability. Nature Climate Change 2016, 6(2): 115–116. Carrao H, Naumann G, Barbosa P: Mapping global patterns of drought risk: An empirical framework based on sub-national estimates of hazard, exposure and vulnerability. Global Environmental Change 2016, 39: 108–124. Falk A, Becker A, Dohmen T, Enke B, Huffman D, Sunde U: Global evidence
on economic preferences. The Quarterly Journal of Economics 2018, 133(4): 1645–1692. Hillesund S: Choosing Whom to Target: Horizontal Inequality and the Risk of Civil and Communal Violence. Journal of Conflict Resolution 2017:0022002717734286. Holzinger A: Interactive machine learning for health informatics: when do we need the human-in-the-loop? Brain Informatics 2016, 3(2): 119–131. Hruschka D, Bischoff R, Peeples M, Hsiao I-H, Sarwat M: CatMapper: A user-
friendly tool for integrating data across complex categories. SocArxiv 2022, n6rty. Kirby KR, Gray RD, Greenhill SJ, Jordan FM, Gomes-Ng S, Bibiko H-J, Blasi DE, Botero CA, Bowern C, Ember CR: D-PLACE: A global database of cultural, linguistic and environmental diversity. PloS one 2016, 11(7): e0158391. Kugler TA, Van Riper DC, Manson SM, Haynes II DA, Donato J, Stinebaugh K:
Terra Populus: Workflows for integrating and harmonizing geospatial population and environmental data. Journal of Map & Geography Libraries 2015, 11(2): 180–206. Liu AH, Pizzi E: The language of economic growth: A new measure of linguistic heterogeneity. British Journal of Political Science 2018, 48(4): 953–980. Matthews LJ: The recognition signal hypothesis for the adaptive evolution of
religion. Human Nature 2012, 23(2): 218–249. Nielsen, J. (1994, April). Enhancing the explanatory power of usability heuristics. In Proceedings of the SIGCHI conference on Human Factors in Computing Systems (pp. 152–158). Østby G, Urdal H, Tadjoeddin MZ, Murshed SM, Strand H: Population pressure,
horizontal inequality and political violence: A disaggregated study of Indonesian provinces, 1990–2003. The Journal of Development Studies 2011, 47(3): 377–398. Pezzulo C, Hornby GM, Sorichetta A, Gaughan AE, Linard C, Bird TJ, Kerr D, Lloyd CT, Tatem AJ: Sub-national mapping of population pyramids and dependency ratios in Africa and Asia. Scientific data 2017, 4:170089. Ruggles S, Roberts E, Sarkar S, Sobek M: The North Atlantic population project:
Progress and prospects. Historical methods 2011, 44(1): 1–6.
Samberg LH, Gerber JS, Ramankutty N, Herrero M, West PC: Subnational distribution of average farm size and smallholder contributions to global food production. Environmental Research Letters 2016, 11(12):124010. Schürer K, Garrett EM, Jaadla H, Reid A: Household and family structure in England
and Wales (1851–1911): continuities and change. Continuity and Change 2018, 33(3): 365–411. Smits J, Permanyer I: The Subnational Human Development Database. Scientific data 2019, 6:190038. Suiter MC, Taylor KG: Resources for economic educators from the Federal Reserve
Bank of St. Louis. The Journal of Economic Education 2016, 47(1): 71–75. Sundström A, Wängnerud L: Women’s Empowerment at the Local Level. In: Measuring Women’s Political Empowerment across the Globe. edn.: Springer; 2018: 117–137. von Grebmer K, Bernstein J, Hossain N, Brown T, Prasai N, Yohannes Y, Patterson F,
Sonntag A, Zimmerman S-M, Towey O: 2017 global hunger index: The inequalities of hunger: Intl Food Policy Res Inst; 2017. Zhang X, Ou X, Yang X, Qi T, Nam K-M, Zhang D, Zhang X: Socioeconomic burden of air pollution in China: Province-level analysis based on energy economic model. Energy Economics 2017, 68: 478–489. Zhukov YM, Davenport C, Kostyuk N: Introducing xSub: A New Portal for Cross-
National Data on Sub-National Violence. 2017.
LISTED IN THE AHFE DIGITAL BOOKSTORE CATALOGUE
Explore the complete digital volume
Human Factors in Design, Engineering, and Computing
Read this individual research paper free through the original publisher, or explore the full digital proceedings book.
ISBN 978-1-964867-35-9
Explore this ISBN in the AHFE Bookstore ↗Listed in the July 2026 bookstore catalogue; search by ISBN to confirm current availability · Digital book purchase optional