Joohyun Lee, Yusaku Okada (2024). Development of a Near-Miss Event Analysis Support System for Different Types of Human Error Using AI Technology. In: Human Factors in Design, Engineering, and Computing. AHFE Open Access, vol. 159, pp. 2257–2268. https://doi.org/10.54941/ahfe1005794
Preventive measures against various human errors are being taken based on information on near-miss events. However, the process from collecting near-miss events to analyzing them and planning countermeasures is labor-intensive. Focusing only on high-risk near-miss events can reduce labor, but many of the collected near-miss events will not be used. To solve these problems, we believe that a "near-miss event analysis support system" consisting of the following tools will be useful.(1st Tool) A tool to support the analysis of near-miss events, especially factor analysis (automatically extracts factors and identifies human error type. Analysts can add or modify.)(2nd Tool) A tool to support risk assessment of near-miss events (calculates the possibility of human error occurring in the target work on a 5-point scale. Analysts input the 5-point scale based on the expected extent of damage when it occurs. These two values are multiplied, and the risk is evaluated on a 5-point scale [1. Take physical measures immediately, 2. Implement on-site response plan immediately, 3. Horizontally deploy to the site and issue a warning, 4. Share information at the site manager level, 5. No response necessary])(3rd Tool) A tool to present countermeasures for near-miss events that are judged to be high risk (automatically presents appropriate human error countermeasure policies and three specific candidate measures based on human error type. Analysts select countermeasures based on the presented countermeasure policies)(4th Tool) Near-miss event occurrence trend analysis tool (Automatically performs statistical analysis of the causes of near-miss events that occurred during a period set by the analyst. Also performs categorization analysis based on the work site, work time period, and SRK level of the work.)(5th Tool) Near-miss event management tool (Connects the near-miss event input tool with the above four tools, stores all data such as evaluation results in the cloud, and supports horizontal deployment within the company. Based on the evaluation results, the urgency is evaluated in four stages (Level 0: no contact required, Level 1: information sharing, Level 2: detailed warning to the site, Level 3: immediate on-site inspection and improvement), and if it is Level 2 or above, a function is added to automatically contact related departments from the system.)We implemented these five tools based on AI technology and built a near-miss event analysis support system. This system is currently being test-operated by safety personnel from several companies, and although we are still in the process of collecting operational issues, it has been confirmed that it has the expected effects.
In safety management activities, it is becoming increasingly important not only to focus on activities that prevent the recurrence of accidents but also to implement proactive measures to prevent potential future issues. However, the following management-related challenges are hindering the activation of such preventive activities, and prompt solutions are urgently needed.
(1) The core of preventive activities against human error lies in the utilization of knowledge related to human factors. However, this body of knowledge is vast, and a diversity of on-site experience is also required. (2) There is minimal recruitment of staff specializing in safety management and human error response, with dedicated teams mainly composed of on-site managers. These team members often transfer to other roles within three to five years, highlighting the need for a system that efficiently transfers and preserves the various forms of knowledge related to safety activities. (3) While near-miss events, which are incidents that fall short of actual trouble, are actively collected, their analysis and evaluation are often limited to individual cases. As the number of collected events increases, near-miss events with low perceived risk tend to go unaddressed. This can decrease the motivation of workers to report such incidents, potentially leading to a decline in near-miss reporting activities altogether. Therefore, a system that conducts trend analysis based on statistical information from near-miss events and applies the findings to improve regular operations is needed. However, due to the human resource challenges mentioned in section (2), this system would need to be highly automated and labour efficient. (4) There is a significant, often latent, demand for advice from experts on concerns and questions related to safety activities. However, the number of available experts is limited, and the costs associated with consulting them can be prohibitive, making it impractical to seek expert guidance for on-site issues directly. As a result, there is a growing desire for the implementation of AI-based systems to provide on-site problem consultation. Currently, many on-site managers are forced to make reluctant choices, such as, “This approach is not ideal, but we don’t know of any better alternatives, so we have no choice but to proceed with this one.” This can inadvertently increase the burden on the site and create environments more prone to human error, resulting in counterproductive outcomes. The demand for a system that allows on-site managers to seek advice easily and readily is therefore high. (5) There is a strong interest in new technologies within each business sector, and their adoption tends to be swift. However, awareness of new safety technologies, particularly those involving AI-driven digital transformation (DX), remains low. To promote the implementation of AI in safety activities, it is becoming increasingly necessary to clearly organize and present the potential benefits and advantages of AI-based safety support, alongside traditional safety measures.
Development of a Near-Miss Event Analysis Support System for Different Types 2259
These issues have been addressed in various studies, including those on near-miss information analysis and evaluation, the revitalization of preventive activities, next-generation safety activities like Safety-II, safety education, and competency. These studies have yielded a range of significant results. In this research, we aim to organize these findings and introduce AI technology from multiple perspectives to diversify the analysis of near- miss events, particularly by supporting trend analysis. Additionally, we seek to develop a system capable of providing guidelines and advice for error prevention measures. This report is the first in the series and focuses on the trial operation phase.
PROPOSAL The near-miss event analysis and evaluation support system proposed in this study is composed of the following components:
(i) Extraction of human error factors from near-miss events. (ii) Estimation of latent risks in the target tasks based on the likelihood of human errors. (iii) Classification of the characteristics of target human error behaviors: Determination of human error types. (iv) Presentation of countermeasure guidelines and specific examples based on human error types. (v) Setting of the analysis period: Aggregation of human error factors in incidents occurring within the period. (vi) Multifaceted analysis of near-miss event trends (application of multivariate statistical analysis). (vii) Presentation of on-site improvement proposals based on the trends of near-miss events.
Based on accident cause analysis methods such as RCA (Root Cause Analysis), research on PSF (Performance Shaping Factors), and risk assessment methods such as HAZOP (Hazard and Operability Studies), the system aims to semi-automate various procedure-based tasks. For judgment and evaluation, a machine learning system will be built using the knowledge of experts in human factors and safety management as training data. For countermeasure guidelines and specific countermeasure examples, the aim is to realize them using generative AI that has trained LLM (Large Language Model) using past safety measure-related research and publicly available accident countermeasure databases. These can be organized into the following five tools: (1st Tool) A tool to support the analysis of near-miss events, especially factor analysis.
(2nd Tool) A tool to support risk assessment of near-miss events. (3rd Tool) A tool to present countermeasures for near-miss events that are judged to be high risk.
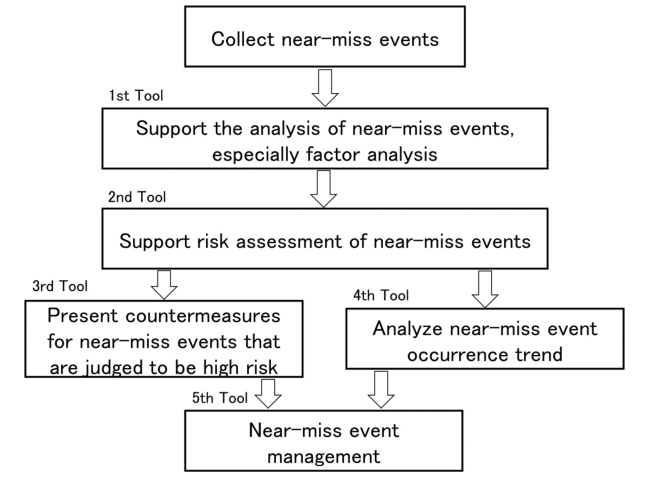
Fig. 1 is an overview of this research, which is broadly divided into five tools.
(1st Tool) A tool to support the analysis of near-miss events, especially factor analysis.
The tool automatically extracts factors from collected near-miss events and identifies the type of human error. Analysts can add or revise information about the target work under normal circumstances.
(2nd Tool) A tool to support risk assessment of near-miss events.
The tool calculates the possibility of human error occurring in the target work on a 5-point scale. Analysts input the 5-point scale based on the expected extent of damage when it occurs. These two values are multiplied and the risk is evaluated on a 5-point scale.
Figure 1: Procedures of the method.
(3rd Tool) A tool to present countermeasures for near-miss events that are judged to be high risk.
The tool analyses near-miss events judged to be “high level” by the 2nd Tool, and automatically presents appropriate human error countermeasure policies and three specific candidate measures based on the human error type. Analysts select countermeasures based on the presented countermeasure policies. For convenience, in this study, we will assign the letters A through T to each information processing step as Tab.1. Also, Tab.2 shows the explanation of human error mode.
Development of a Near-Miss Event Analysis Support System for Different Types 2261
Table 1. Correspondence table between alphabet and information processing stages.
Table available in the original PDF paper.
A Preview K Selection and sequential execution of repertoire B Mapping to the Code of Conduct L Finish feature collation C Action-1 M Finish status verification D Observations N Situational Awareness E Feature Matching O Mapping the situation to the task F Judgement P Correspondence With regulations G Action-2 Q Meaning H Criteria R Prediction/Evaluation I Feature Matching S Decision Making J Work Status Verification T Working Memory
The system automatically performs statistical analysis of the causes of near- miss events that occurred during a period set by the analyst, targeting near- miss events that were determined to be other than “high level” by the 2nd Tool. It also performs categorization analysis based on the work site, work time period, and SRK level of the work.
Table 2. Explanation of human error mode.
Table available in the original PDF paper.
Feature of Human Error
Human Error Mode
Feature of Human Error Human Error Mode Lack of foresight Unregulated procedures Actions arising from the lack of prectictive ability, despite the fact that poor outcomes of a certain action are sufficiently foreseeable.
Actions (including non-execution) that arise from a lack of attention to matters that should be consideredin advance whencarrying out procedures. Overlooking weak stimuli
Misconceptions at work
Misconceptions, confusion forgetfulness, etc. that occur while working (including missing steps).
Failure to notice relatively weak stimuli in the senses of sight, hearing, touch etc, or thestimulibeing virtually nonexistent, resulting in failure to evendetect or observe an object or thing.
Uns afe behavior that persists despite potential danger.
Signal bias The short-sighted behavior of mistaking a signal for a clueto correct or redo the work
Habitual unsafe behavior
Frequency bias
Visuality bias Actions that arise due to ignoring thing that are not directly visibleor are difficult to consider.
The act (or failure to act) of identifying with familiarity when matching features of a task in a way that is different from what is required.
Criterion incompetence
Analogy bias Actions that arise due to relying on similarities.
Anaction (or a lack of action) that occurs because the judgment criteria necessary for matching the characteristics of the task have not been establis hed (by the worker).
Symptom bias
Impulive unsafe behavior
Animpulsive act in whichimmediate benefits are prioritized over potential dangers.
The behavior that occurs when we are influenced by similar signs that indic ate a change in the situation and make an incorrect prediction.
(Continued)
2262 Lee and Okada
Table 2. Continued
Table available in the original PDF paper.
Feature of Human Error
Human Error Mode
Feature of Human Error Human Error Mode Memory confusion
Actions that arise related to encoding, retention, and recall.
Work repertoire deficiency
Insufficient performance due to a limitedrepertoire of behaviors (areas of expertise) required for a task.
Finish feature failure
Responsibility bias
Actions resulting from the influence of a sense of responsibility on judgement.
Insufficient performance due to failure to recognize subtle differences in the morphological characteristics, resistance, and movement of the completed task.
Similarity bias
The tendency to be drawn to similar tasks or procedures.
Accidental disturbance
Omission Failureto act due to forgetting what should be done. Inadequacy of pre-task conditions
Actions that occur due to accidental factors, contrary to the worker’s intention.
Actions (including non-execution) that arise due to mis understanding or failure to prepare the conditions for starting work.
(5th Tool) Near-miss event management tool.
The system connects the near-miss event input tool with the four tools, 1st Tool to 4th Tool, and stores all data, including evaluation results, in the cloud to support horizontal deployment within the company. Based on the evaluation results, the urgency is assessed on a four-level scale (Level 0: no contact required, Level 1: information sharing, Level 2: detailed warnings to the site, Level 3: immediate on-site inspection and improvement), and if it is Level 2 or above, a function is added to automatically contact related departments from the system. At this time, the 5th Tool has not yet been implemented, and it is expected that the 4 tools up to Tool 4 will be linked using AI technology after the implementation is completed.
DEVELOPMENT TOOLS
1st Tool Mecab performs morphological analysis on the text of the near-miss event, and compares the obtained morphemes with reference words to present candidate factors. The reference word list is a list of words related to background factors (85 in total) classified and organized based on the m-SHELL model (Tab. 3).
2nd Tool First, based on the data that sets the degree of influence for background factors, a human error occurrence possibility evaluation value (called as the HEP evaluation value) is calculated using a calculation method that multiplies the influence degree of factors by the state, and the possibility of human error occurrence is judged on a five-point scale. Human error risk level is determined by multiplying the HEP level by the magnitude of damage expected as a result of human error (entered by the analyst). The five levels of
Development of a Near-Miss Event Analysis Support System for Different Types 2263
risk are divided into 1: immediate physical measures should be taken, 2: on- site response plans should be implemented immediately, 3: lateral deployment to the field and warnings should be issued, 4: information should be shared at the field manager level, and 5: no response necessary.1 and 2 are classified as “high level” where immediate response is desirable, 3 and 4 are “medium level” where base improvement through on-site education and guidance is desirable, and 5 is “low level” where no special measures are required.
Table 3. An example of reference words list.
Table available in the original PDF paper.
Sub Categories Background Factors Reference Words Main Categories Based on m-SHELL
Mental Stress Repetitive Task same / repeat / many times Skill Unfamiliar Task familiar / frequency / habit / change / renew / emergency / for the first time / first / unfamiliar Software Information Too Much Information information / too much / much Order / Plan Not following Procedure procedure / follow / order Hardware Machines Insufficient Display of Machine Environment Work Characteristics
Parallel Execution of Multiple Tasks
multiple / while / other / another / duplicate / parallel / same time Time High Time Pressure hurry / rush / time / deadline / busy / speed / barely / panic / float / impatience Work Environment
Confined Space confined / head / overhead / narrow Liveware-1 Relation between groups
Requiring Coordination with Other Groups or Companies
confirmation / double check / check
company / other companies / other departments / department / group / affiliated companies / request / handover / coordination Communication No Confirmation from Anyone other than The Person Involved Unclear Division of Roles role / part / ambiguous / vague / unclear / unsure Management Team Management Problems
Insufficient Education education / training Education Management
3rd Tool In creating the 3rd Tool, we combined text generalization using a general text mining method with text classification using BERT. Based on the results of classifying the words in the sentences by part of speech using text mining, the sentences were generalized by removing industry-specific jargon and proper nouns. Industry-specific jargon and proper nouns were removed. However, words related to human error, such as “accident,” “obstacle,” “injury,” “fear,” “preconception,” “just in case,” “impatience,” “fear,” “cause,” “disaster,” and “inertia,” were not removed. Next, we used BERT to
2264 Lee and Okada
perform text classification in three stages: Stage 1: SRK classification (Skill Based, Rule Based, Knowledge Based), Stage 2: Branch selection, and Stage 3: Relevant item determination (Tab.4).
Table 4. Explanation of each stage of text classification.
Table available in the original PDF paper.
Classifying human behavior as skill-based or rule-based
Stage 1: SRK classification Stage 2: Branch selection Branching of skill-based actions to Route ABC/Route DEFGH Branching of rule-based actions to Route IJKLM/Route NOP Stage 3: Relevant item determination
Determining which of A, B, or C corresponds to the behavior of Route ABC . Determining which of D, E, F, G or H corresponds to the behavior of Route DEFGH. Determining which of I, J, K, L or M corresponds to the behavior of Route IJKLM. Determining which of N, O, or P corresponds to the behavior of Route NOP.
The first and second stages were implemented using the sentence classification class BertForSequenceClassification provided by Transformers, and the third stage was implemented using the multi-label classification model BertForSequenceClassificationMultiLabel implemented in PyTorch. Machine learning was performed using the training data that had been used for SRK classification, branch selection, and item judgment by expert judges.
4th Tool The frequency of occurrence of the background factors of human error presented in the 1st Tool is tallied for a specified period, and statistics are compiled regarding the factors that appear frequently, the percentage of occurrence, and changes in the frequency of occurrence of each factor. Currently, statistical analysis is performed using Excel, and the process has not yet been automated. In the future, automation using AI technology is planned.
VERIFICATION Here is an example of a company that is proactively working on preventive activities. The data collected in this study is from a representative Japanese company, where near-miss event reports are conducted as part of safety activities. Although a sufficient number of near-miss event reports have been collected, they have not been used for subsequent factor analysis, risk assessment, or countermeasure proposals. As a result of not utilizing near- miss events, effective countermeasures cannot be taken even if a similar incident occurs. The results of the analysis using the 1st Tool, 2nd Tool, 3rd Tool and 4th Tool are shown below.
Development of a Near-Miss Event Analysis Support System for Different Types 2265
We analysed near-miss events from fiscal year 2022 and tested whether sentence classification works on 43 inferred data through machine learning using 404 expert judges’ data as learning data. The results are shown in a scatter plot with the true labels by the expert judges on the horizontal axis and the labels predicted by machine learning on the vertical axis. The size of the circles is changed according to the number of points that show the same value. The dotted lines in the graph are auxiliary lines that indicate that the true labels and predicted labels match.
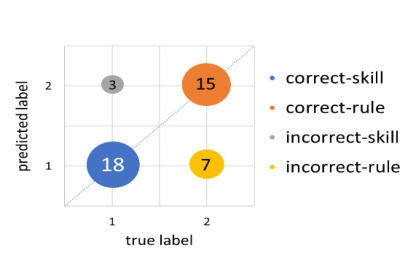
(1) Stage 1: SRK classification The accuracy of the model after fine-tuning was calculated to be 40.78%. We loaded 43 prediction data items into this model and predicted the SRK classification. The result is in the figure below. Here, the results are labelled 1 if the classification is skill-based, and 2 if the classification is rule-based. A result is shown as Fig. 2.
Figure 2: SRK classification prediction results.
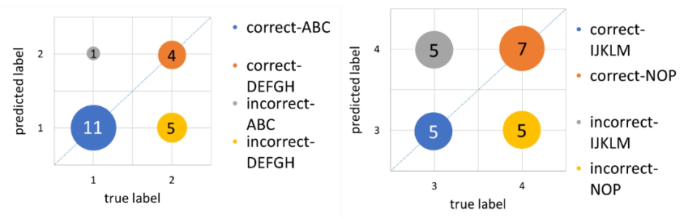
(2) Stage 2: Branch selection When skill-based behaviours were branched to route ABC/route DEFGH, and rule-based behaviours to route IJKLM/route NOP, the accuracy rates were 47.59% and 18.11%, respectively. When 21 and 22 pieces of prediction data were loaded into each model and used to make predictions, the results shown as Fig. 3 were obtained. Here, label 1 is displayed for branching to route ABC, label 2 for branching to route DEFGH, label 3 for branching to route IJKLM, and label 4 for branching to route NOP.
Figure 3: Inferred results of branch selection.
2266 Lee and Okada
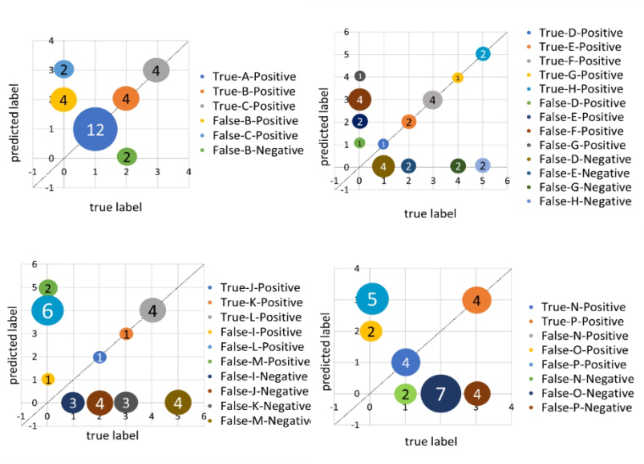
(3) Stage 3: Relevant item determination The accuracy of the model was 53.57%, 13.33%, 0.00%, and 5.56% when determining the items that correspond to the actions of route ABC, route DEFGH, route IJKLM, and route NOP, respectively. The results were as shown as Fig4 when each model was made to make predictions by loading 12, 9, 10, and 12 pieces of prediction data.
Figure 4: Inferred results of relevant item determination.
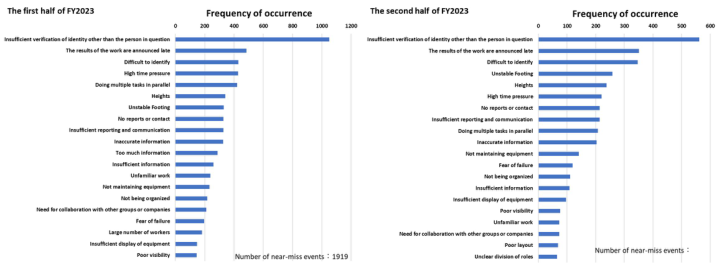
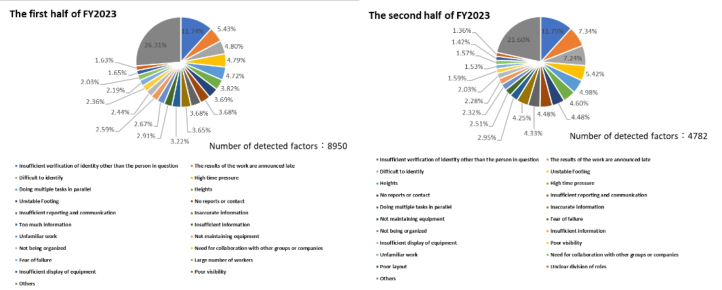
The results of a statistical analysis of near-miss events are shown as Fig. 5 and Fig. 6. Near-miss events from the first and second half of fiscal year 2023 were analysed, and the 20 most frequently occurring factors, their frequency of occurrence, and the percentage of each factor relative to the total number of detected factors were visualized.
Comparing the graphs for the first half of fiscal year 2023 with those for the second half of fiscal year 2023, the top three most frequently occurring factors were “insufficient verification by people other than the person in question,” “delayed notification of work results,” and “difficulty in identification.” In addition, although the rankings have changed, it can be seen that “unstable scaffolding,” “high altitude,” “high time pressure,” “no reports or communication,” “insufficient reports or communication,” “multiple tasks in parallel,” “inaccurate information,” “not maintaining equipment,” “fear of failure,” “not being organized,” “insufficient display of equipment,” “poor visibility,” “unfamiliar work,” and “need for collaboration with other groups or companies” are included in the top 20 most frequently occurring factors in both periods. This shows the difficulty of reducing near misses caused by these factors in a short period of time.
Development of a Near-Miss Event Analysis Support System for Different Types 2267
Taking solutions to eliminate each factor based on these results can lead to a reduction in the number of near miss events.
Figure 5: Comparing frequency of occurrence of near-miss events.Figure 6: Comparing the percentage of each factor.
CONCLUSION
In this study, we implemented a near-miss event analysis support system based on AI technology. This system is currently being tested by a company’s safety officer, and operational issues are being collected. In particular, the 3rd Tool will improve the accuracy of the model by increasing the number of learning data in model creation, and by making the model automatically transition from the 1st to the 3rd stage, the results for all stages can be output by inputting the sentence to be judged only once, which will make it easier for analysts to use. The 4th Tool is limited to statistical analysis using Excel, but in the future, we hope to utilize AI technology to connect it to the 1st and 2nd Tools to advance automation, and to implement the 5th Tool, which will lead to the construction of a system that is more useful for analysts.
2268 Lee and Okada
REFERENCES
A Komatsubara. (2003). Human Error (in Japanese), Maruzen Shuppan Baber, Chris and Jenkins, Daniel P. (2013). Human factors methods: a practical guide for engineering and design, Ashgate. Chandler F. T., Chang Y. H. J., Mosleh A., Marble J. L., Boring R. L., and Gertman
D. I. Human reliability analysis methods. (2006) selection guidance for NASA, NASA/OSMA Technical Report. Denis R. (2022). Transformers for natural language processing: build, train, and fine-tune deep neural network architectures for NLP with Python, PyTorch, TensorFlow, Bert, and GPT-3, Packt Publishing 2nd ed. Dhillon, B. S. (1986). Human Reliability: with Human Factors, Pergamon Press, New
York. Hollnagel E. (1998). Cognitive Reliability and Error Analysis Method (CREAM), Elsevier. K Saito. (2024). Deep learning from scratch-5 - Generative Model- (in Japanese),
O’Reilly Japan. Kirwan, B. et al. (1997) The validation of three human reliability quantification techniques, Salmon, Paul M. (2011) Human factors methods and accident analysis: practical
guidance and case study applications, Ashgate. Stanton, N. A. et al. (2005). Human Factors Methods: A Practical Guide for Engineering and Design, Ashgate Publishing, Aldershot, UK Stanton, Neville and Salmon, Paul M. and Rafferty, Laura A. and Walker, Guy H.
and T Kudo. (2013). MeCab: Yet Another Part-of-Speech and Morphological Analyzer.
https://taku910.github.io/mecab/ T Ohmi, K Kaneda, M Morinaga, A Emami. (2021). Introduction to Natural Language Processing with BERT. - Hands-on programming with Transformers- (in Japanese), Ohmsha. T Yukimachi. (2004). Human Factors to Prevent Human Error (in Japanese),
Technosystem. Technical Basis and Implementation Guidelines for a Technique for Human Event Analysis (ATHEANA), Report No. NUREG-1624, U. S. Nuclear Regulatory Commission, Washington, DC, May 2000. Therp, Heart, and Jhedi: Part III-practical aspects of the usage of the techniques,
Applied Ergonomics, Vol. 28, No. 1, pp. 27–39, 19. Y Okada. (2005). “Introduction to Human Factors - Aim for harmony between man and machine” (in Japanese), Keio University Press.
LISTED IN THE AHFE DIGITAL BOOKSTORE CATALOGUE
Explore the complete digital volume
Human Factors in Design, Engineering, and Computing
Read this individual research paper free through the original publisher, or explore the full digital proceedings book.
ISBN 978-1-964867-35-9
Explore this ISBN in the AHFE Bookstore ↗Listed in the July 2026 bookstore catalogue; search by ISBN to confirm current availability · Digital book purchase optional