Junnosuke Kusumoto, Kyoko Shibata, Hironobu Satoh (2024). Timbre estimation of compound tones from an auditory cortex by deep learning using fMRI: Sound pressure levels detection of specific frequency. In: Human Factors in Design, Engineering, and Computing. AHFE Open Access, vol. 159, pp. 1381–1389. https://doi.org/10.54941/ahfe1005705
Brain decoding have been widely treated in the neuroscience. However, compared to research in the visual cortex, progress in the field of auditory cortex has not been made. Therefore, the purpose of this study is to establish a technique to estimate sounds heard by human using deep learning from brain images captured by fMRI. The sounds we hear in usual have a unique timbre. Timbre is determined by the combination of sound pressure levels at the overtone, which is the natural multiple of the fundamental frequency, in a compound tone. Before, this research group decoded the pitch of pure tones, which are waves of a single frequency. As a result, the discrimination of two tones in increasing degrees and the detection of a specific pitch in triad were realized. Next phase of this research is to decode a sound pressure level at a specific frequency. By combining these methods, we believe it is possible to decode timbre by detecting a sound pressure level of specific overtone. In a previous report, we examined whether the brain activity of listening to pure tones at two different sound pressure levels at specific frequency can be discriminated by deep learning binary classification. The result was a discrimination rate of 70.84% with relative levels of 0 [dB] and -20 [dB] when 90 [dB] was used as a reference. This result indicates that the difference in brain activation intensity by sound pressure level could be handled as classification problem by deep learning. Therefore, the purpose of this paper is to detect the sound pressure level of pure tones using deep learning for application to timbre decoding. Specifically, we attempt to detect specific sound pressure level among the three tones of 0 [dB], -10 [dB], and -20 [dB] when 90 [dB] based on an absolute level of 90[dB]
In recent years, brain decoding technology has been widely used in the field of brain science. Brain decoding is a technique for estimating brain stimulation by analysing brain activity acquired by fMRI (functional Magnetic Resonance Imaging) and other methods. Research has progressed in the field of the visual cortex, where decoding has been used to read imagined images from brain activations in the visual cortex (Majima and Nishimoto, 2023) and the mechanisms of human colour perception have
been elucidated (Mullen, 2019). However, research in the auditory cortex has been slow due to fMRI operating noise. Although decoding of auditory perceptions of music (Bellier, 2023) and pre- and post-context in pitch (Englitz et al., 2023), decoding of compound tones that we hear in daily life has not been done. If decoding technology in auditory field is developed and decoding of compound tones is achieved, in the future, it could be applied to auditory rehabilitation support. Therefore, this research group has been developing a system that analyses brain activation images captured by fMRI and uses deep learning to estimate the sounds heard by the experimental volunteers. At the present stage, the purpose is to decode timbre that one element of sound described below.
The auditory sensations caused by sound can be divided into three elements: pitch, loudness and timbre (Fletcher, 1934). Pitch depends on the frequency of the sound wave, while loudness depends on the sound pressure level, which is the change in air pressure caused by the amplitude of the sound wave. Furthermore, timbre is determined by the combination of the sound pressure levels at the overtone frequencies in the compound tones, that is the frequency spectrum. The above suggests that if pitch and sound pressure level can be decoded respectively, it will be possible to the decoding of timbre can be achieved by combining them.
Before now, the research group has carried out pitch decoding of pure tones as a first step in their research. Shigemoto et al., focused on tonotopy (Langer, 2007) and used two tones, C7 and C#7 (124.5 Hz difference), for discrimination by CNN (Convolution Neural Network). A maximum discrimination rate of 75.00% and an average discrimination rate of 64.17% were obtained, showing the usefulness of the method for discriminating fine differences in pitch (Shigemoto et al., 2019). Shinke et al. also found that the pitch of a specific note in three chords can be estimated using 3DCNN (Shinke et al., 2020).
The next stage is to decode the sound pressure levels at specific frequency. First, in a previous report (Kusumoto et al., 2023), in order to verify whether the difference in intensity of brain activation depending on sound pressure levels can be treated as a classification task by deep learning, we investigated whether the brain activation images when listening to pure tones of two different sound pressure levels at a specific frequency can be discriminated by binary classification in deep learning. A discrimination rate of 70.84% was obtained at relative levels 0 [dB] and –20 [dB] based on an absolute level of 90[dB]. It is expected that this will enable the intensity differences in brain activation by sound pressure levels to be treated as a classification task by deep learning. Timbre decoding detects the sound pressure level at a particular overtone in a compound tone. For this reason, This report will applies the sound pressure level discrimination system developed in a previous report and construct sound pressure level detection system. Therefore, the purpose of this paper is to develop a system to detect sound pressure levels for timbre decoding, and to investigate whether specific sound pressure levels can be detected from fMRI brain activation images by using deep learning.
Timbre Estimation of Compound Tones From an Auditory Cortex 1383
METHOD
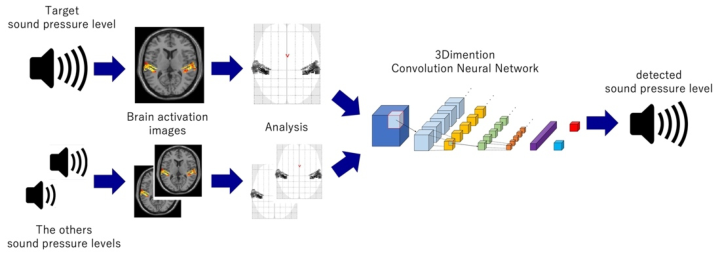
An overview of the sound pressure decoding system proposed in this research is shown in Figure 1. Brain activation by auditory stimulation was imaged using fMRI and these were annotated before detection using 3DCNN. The method of brain image acquisition, analysis and deep learning used for detection are the same as those previously reported (Kusumoto et al., 2023), and are therefore omitteddescription.
Figure 1: Overview of sound pressure level decoding system.
EXPERIMENT Auditory Stimulus
According to Suzuki et al. the loudness level becomes the same value as the sound pressure level around 1,000 [Hz] (Suzuki, 2004), so that changes in sound pressure level are considered to change in the same auditory sense. Therefore, the pitch used is C6 (1,046 [Hz]) with a frequency around 1,000 [Hz]. The sound pressure levels to be detected are three relative levels 0 [dB], −10 [dB] and −20 [dB] based on an absolute level of 90[dB], which is within the range of absolute sound pressure levels that can be presented by OptoACTIVE (Opto acoustics), a reproduction device for auditory stimuli. Based on the above, pure tones with a pitch of 1,046 [Hz] and relative sound pressure levels of 0 [dB], −10 [dB] and −20 [dB] based on absolute level of 90 [dB] are presented as auditory stimuli in this experiment.
Experimental Methods This experiment was conducted with one adult male volunteer who had no hearing abnormality, after obtaining approval from the Ethics Committee of Kochi University of Technology, and after explaining the content to the volunteer and obtaining his consent.
There are two types of experimental designs in fMRI experiments: block design and event-related design. This experiment is based on the experimental model of Shigemoto et al. (2019), using an event-related design that allows more data to be obtained in a shorter time, although brain activation is
weakened by the shorter presentation time of the auditory stimuli compared to the block design. Auditory stimuli were presented for 3 seconds at random for a total of 600 times, 200 times each of three pure tones of 0 [dB], −10 [dB], and −20 [dB]. The resting time between auditory stimuli was randomly set between 3 and 21 seconds in 3-second increments to suppress weakening of brain activation due to habituation. Three 20-minute sessions of 120 auditory stimuli per session were conducted. A 3-tesla fMRI system (MAGNETOM Prisma3T: SIEMENS) was used for imaging. Sound sources created with Nuendo 10.3 (Steinberg) were presented as auditory stimuli using OptoACTIVE, a thin headphone with active noise control to reduce fMRI operating noise. The output of OptoACTIVE is tuned to achieve an absolute sound pressure level of 90 [dB] at maximum output during presentation. fMRI functional imaging parameters are shown in Table 1.
Table 1. Functional image capturing parameters.
Table available in the original PDF paper.
Echo time (TE) [ms] 48 Reptation time (TR) [ms] 3000 Field of view (FOV) [mm] 192×192 Filip angle [
] 90 Matrix size [mm] 2.0×2.0×3.0 Slice thickness [mm] 3.0 Slice gap [mm] 0.75 Slice 36 Slice acquisition order Assending
The scan data obtained from fMRI imaging is preprocessed using the method described in Chapter 2. The data taken during the presentation of 120 scans of auditory stimuli per tone are randomly divided into 96 scans of training data and 24 scans of test data to be input to 3DCNN. Eight sets of 4-scans combinations are created from the training data for each session as one contrast, and the t statistic is obtained for each contrast. Four sets of 4 scans are created by changing the combination of scans, and finally 8 sets × 4 types × 3 sessions = 96 contrasts are created. From the same training data as that used for the 4-scans contrasts, 96 contrasts are created, one contrast per scan. The training data is 192 contrasts in total, created from 4scan and 1scan data, respectively. Since one contrast is created per scan of evaluation data, 8 scans × 1 type × 3 sessions = 24 contrasts are created. Based on the created data, the shape is converted to one that fits within the H16 × W50 × D8 voxels to be input to 3DCNN. Using this data, the sound pressure level of the target tone is classified as “Positive” and the other two tones are classified as “Negative”, and whether the brain activation is Positive or Negative is estimated based on a binary classification. The binary classifications are then used to estimate whether the activation is “Positive” or “Negative”. The output teacher value for Positive is set to “0” and the output teacher value for Negative is set to “1”, and the class of sound pressure level for which the probability of being each teacher value is more than 50% in the evaluation data is output as the result. The training conditions for 3DCNN are shown in
Timbre Estimation of Compound Tones From an Auditory Cortex 1385
Table 2. After optimising the training of 3DCNN using Adam, suppressing overfitting, saving the training weights and confirming that the error is less than 0.1, the trained model is used for detection.
Table available in the original PDF paper.
Learning Data Ratio In creating the input data for deep learning, the total number of training data for each class is one tone for “Positive” and two tones for “Negative”. In other words, when all data are used, the ratio of the number of Positive:Negative training data is 1:2. We believe that the training data ratio affects the detection accuracy, and in this report, we train Positive:Negative with the training data ratio of 1:1, 1.25, 1:1.5, and 1:2, respectively, to verify the detection accuracy and find a more appropriate training data ratio.
Table 2. The learning conditions for 3DCNN.
Table available in the original PDF paper.
Layer Set Value Input Layer 16×50×8×1
Condition Number of 3DCNN layers 6 Convolution Stride 1 Pooling Filter size 2×2×2 Stride 2 Learning rate 0.01 Drop out 0.22/0.5 Error rate 0.1 Termination condition error rate Convolution Filter size 3×3×3∼6×6×6 Channels 8
Evaluation Method In this research, detection rate and F-score are used as evaluation methods for the learning model.
Detection Rate The detection rate is the average of the accuracy for the Positive and Negative test data using Equation (1) and is used as a measure of learning model accuracy.
In the binary classification of brain activity, if the accuracy is above 50%, the classification is successful (Carlson et al., 2020). And if the accuracy is above 60%, the classification accuracy is reliable enough (Robinson et al., 2023).
F-Score The F-score is the value obtained by taking the harmonic mean of the precision and recall in the learning model (Sasaki, 2007). We quantify the
balance of the learning model from 0 to 1. The closer the F-score is to 1, the more balanced and appropriate the learning model. In this report, it is used to compare the balancing accuracy within each trial.
RESULT
Learning was successfully completed with an error rate of less than 0.1. Positive accuracy, Negative accuracy, detection rate, and F-score with Positive:Negative = 1:1, 1:1.25, 1:1.5, and 1:2 at 0 [dB], –10 [dB], and –20 [dB] are shown in Table 3. For each sound pressure level, the highest detection rate and F-score is shown in red.
Table 3 shows that the detection rate and F-score are highest at Positive:Negative = 1:1.25 for all sound pressure levels, with the detection rate and F-score at –10 [dB] being lower than those at 0 [dB] and –20 [dB].
Table 3. Results for each sound pressure level at each ratio.
CONSIDERATION Trends in Different Study Data Ratios
In the detection of 0 [dB], the detection rate exceeded 50% with a learning model of Positive:Negative = 1:1.25, indicating that detection is successful. In the detection of –20 [dB], the detection rate exceeded 60% for the learning model with Positive:Negative = 1:1.25, which can be said to be a sufficiently reliable detection accuracy. Comparing the F-score, we can say that the Positive:Negative = 1:1.25 learning model is the most balanced model among the four training data ratios considered at each sound pressure level.
Table 3 shows that for 0 [dB] and –20 [dB], the detection rate tends to decrease as the ratio increases for Negative ratios 1.25 and higher. From this, we can assume that the higher the ratio of Positive, the higher the Positive correct response rate and, accordingly, the higher the detection rate. The lower detection rate in the Positive:Negative = 1:1 learning model than in the
Timbre Estimation of Compound Tones From an Auditory Cortex 1387
Positive:Negative = 1:1.25 training model is thought to be due to the lowest total number of data used for training. Based on these trends, improvement of –10 [dB] accuracy is discussed in the next section.
Improved Accuracy in –10[dB] Detection Based on the trend described in the previous section, we consider that a higher ratio of Positive than Negative might improve the detection rate at –10 [dB], although the total number of training data would be reduced. Since the brain activation of –10 [dB] is between 0 [dB] and –20 [dB], by classifying –10 [dB] into Positive and 0 [dB] and –20 [dB] into Negative, the difference in brain activation between Positive and Negative is small, and the variation of data within Negative. The difference in brain activation between Positive and Negative is small, and the variation of data within Negative is large, so there is a possibility that the features are not captured during training. Therefore, we suppose that the detection rate could be improved by adding a layer of 3DCNN.
Change Positive:Negative ratio The Positive:Negative ratio was changed to 1:0.5 and 1:0.75 to detect –10 [dB].
Table 4 shows Positive accuracy, Negative accuracy, detection rate, and F-score for Positive:Negative =1:0.5 and Positive:Negative =1:0.75.
Table 4. Result at –10[dB] after changing the ratio.
Table 4 shows that as the ratio of Positive increased, the Positive accuracy increased. However, it can be seen that the Negative accuracy decreased accordingly. Compared to Table 3, the detection rate of 51.04% at Positive:Negative = 1:1.25 was not greatly exceeded, but the F-score improved at Positive:Negative = 1:0.5. The reason why the detection rate did not improve significantly despite the increase in F-score is thought to be that the total number of training data was reduced, although the ratio of Positive approached an appropriate level.
Adding layers of 3DCNN In the ratio of each training data, detection was carried out using a model that one convolutional layer and one pooling layer were added. The maximum detection rate of 57.29% was achieved when Positive:Negative = 1:1, which was the most accurate.
Table 5 shows Positive accuracy, Negative accuracy, detection rate, and F-score for the trial with the best accuracy after the addition of the layer, the trial at Positive:Negative = 1:1 before the layer was added (excerpted
and reproduced from Table 3), and the trial at Positive:Negative = 1:1.25 before the layer which produced the maximum detection rate in Chapter 4. was added (excerpted and reproduced from Table 3). The detection rate and F-score after the addition of the layer are shown in red.
Table 5 shows that the detection rate at Positive:Negative = 1:1 improved from 44.79% to 57.29%, exceeding 50%, indicating that detection is feasible. It also shows that the maximum detection rate improved from 51.04% to 57.29%. In both comparisons, the F-score is improved, and we believe we were able to improve the detection rate while improving the balance of the learning model.
Based on the above, the addition of a layer of 3DCNN can improve the detection rate while improving the balance of the learning model for -10 [dB], and it is expected to improve the balance of the learning model and detection rate for detecting other sound pressure levels.
Table 5. Comparison of detection rate and F-score for the trial with maximum accuracy after layer addition, the trial before layer addition with the same training data ratio, and the trial with maximum accuracy before layer addition.
Table available in the original PDF paper.
F-score
Positive accuracy [%]
Negative accuracy [%]
Detection rate [%]
66.67 47.92 57.29 0.610
Maximum detection rate of after adding layers (1:1)
58.33 31.25 44.79 0.524
Before adding layers (Same ratio as the maximum detection rate after layer addition)
75.00 27.08 51.04 0.605
Maximum detection rate of before adding layers (1:1.25)
CONCLUSION
In this report, we conducted an experiment to detect sound pressure level from fMRI images using deep learning. We classified the sound pressure levels as “Positive” (targeted) or “Negative” (other). We used binary classification to detect tone at specific sound pressure level while changing the ratio of the number of data in each class. As a result, it was expected that 0 [dB] and –20 [dB] can be detected in the Positive:Negative = 1:1.25 learning model. Since sufficient detection accuracy was not obtained at –10 [dB], the training data ratio was changed and a layer of 3DCNN was added, respectively. We could not confirm the improvement of detection accuracy when the training data ratio was changed. The detection rate was greatly improved by adding a layer of 3DCNN, and there was a prospect that detection is possible even at –10 [dB].
In the future, we will study the learning model with sound pressure level difference that are finer than the level difference we focused on this research.
Timbre Estimation of Compound Tones From an Auditory Cortex 1389
The deep learning model will then be combined to estimate the compound tones.
REFERENCES
Adam, (June 25, 2024), Keras: https://keras.io/api/optimizers/adam/ Amanda K. Robinson, Genevieve L. Quek, and Thomas A. Carlson (2023) “Visual Representations: Insights from Neural Decoding.” B. Englitz, S. Akram, M. Elhilali, S. Shamma (2023) “Decoding contextual influences
on auditory perception from primary auditory cortex.” Dave R. M. Langer, Walter H. Backes, and Pim van Dijk (2007) “Representation of lateralization and tonotopy in primary versus secondary human audiotory cortex”, Neuro Image34, pp. 264–273. H. Fletcher (1934), “Loudness, pitch, and the timbre of musical tones and their
relation to the intensity, the frequency, and the overtone structure”, The Journal of the Acoustical Society of America, Vol. 6, No. 2, pp. 59–69. JIS Z 8106:2000, (2000). Jun Shinke, Kyoko Shibata, and Hironobu Satoh (2020) “Sound Identification System from Auditory Cortex by Using fMRI and Deep Learning: Study on Experimental Design for Capturing Brain Images.” Junnosuke Kusumoto, Kyoko Shibata, and Kiminobu Sato (2023) “Estimation
of sound pressure level from auditory cortex by deep learning using fMRI” SOBIM2023, pp. 144–147 Kathy T Mullen (2019) “The response to colour in the human visual cortex: the fMRI approach”Current Opinion in Behavioral Sciences, Vol. 30, 141–148. Ludovic Bellier (2023) “Music can be reconstructed from human auditory cortex
activity using nonlinear decoding models.” Naoko Koide-Majima, Shinji Nishimoto, Kei Majima (2023) “Mental image reconstruction from human brain activity: Neural decoding of mental imagery via deep neural network-based Bayesian estimation.” Narumi Shigemoto, Hironobu Stoh, Kyoko Shibata, and Yoshio Inoue, (2019)
“Study of Deep Learning for Sound Scale Decoding Technology from Human Brain Auditory Cortex”, 2019 IEEE 1st Global Conference on Life Sciences and Technologies (LifeTech), pp. 212–213. Opto acoustics, (June 25, 2024), OptoACTIVEII: https://www.optoacoustics.com/ medical/optoactive-ii Steinberg, (June 25, 2024), Nuendo: https://www.steinberg.net/ja/nuendo/ Thomas A. Carlson, Tijl Grootswagers, Amanda K. Robinson (2020) “An introduction to time-resolved decoding analysis for M/EEG.” Yoichi Suzuki and Hisashi Takeshima (2004) “Measurement and International
Standardization of Human Isoloudness Curves,” Journal of Electromagnetic Science, Vol. 124, No. 11, pp. 715–718. Yutaka Sasaki (2007) “The truth of the F-measure.”
LISTED IN THE AHFE DIGITAL BOOKSTORE CATALOGUE
Explore the complete digital volume
Human Factors in Design, Engineering, and Computing
Read this individual research paper free through the original publisher, or explore the full digital proceedings book.
ISBN 978-1-964867-35-9
Explore this ISBN in the AHFE Bookstore ↗Listed in the July 2026 bookstore catalogue; search by ISBN to confirm current availability · Digital book purchase optional