Suhas Mangalesh Chavan, Kazunori Kaede, Keiichi Watanuki (2026). Lightweight Driver Drowsiness Detection Model Using MediaPipe Blendshapes and a Dual-Attention Hierarchical BiLSTM. In: Affective and Pleasurable Design. AHFE Open Access, vol. 204, pp. 73–84. https://doi.org/10.54941/ahfe1007333
Driver drowsiness contributes to approximately 10%–20% of global road accidents. Camera-based fatigue detection systems usually require a tradeoff: simple models using geometric thresholds often miss subtle early signs of sleepiness, whereas deep-learning models with higher accuracy rely on computationally heavy raw-pixel processing. This paper presents a lightweight and computationally efficient alternative for real-time edge devices. Instead of processing raw video frames, the proposed system utilizes the Google MediaPipe Face Landmarker to extract a streamlined vector of facial blendshape coefficients. These kinematics were processed using a dual-attention hierarchical bidirectional long short-term memory network. To capture both quick blink events and gradual fatigue over time, the model analyzes 3,600-frame (2 min) video segments using a sliding window approach that evaluates localized 50-frame (1.6 s) microchunks with a 25-frame stride. During training, rather than forcing fatigue into a strict binary classification, this architecture models drowsiness as a continuous progression using soft target probabilities. This allows the network to evaluate the gradual temporal patterns of early-onset fatigue, such as changes in blink behavior over time. This approach allowed the system to be successfully generalized across different individuals in the dataset. Evaluated on the unfiltered UTA-RLDD dataset using an early detection threshold of 0.35, the model achieved a window-level accuracy of 86.90%, a video-level accuracy of 88.89%, and a critical safety window-level sensitivity of 91.14%. Finally, this paper proposes a hardware architecture for a closed-loop haptic mitigation seat and establishes a foundation for future simulator-based validation studies.
Background and Motivation Driver drowsiness poses a persistent threat to road safety. When driving on long, monotonous stretches of highways, drivers often experience a decrease in vigilance, that is, a gradual decline in alertness that severely impairs reaction times and vehicle control. Automated driver state monitoring systems are
highly valuable for continuously evaluating the driver’s state and initiating timely interventions before an accident occurs (Ayas et al., 2024).
There is a divide in the tracking of driver fatigue. Physiological sensors that measure brain waves (electroencephalogram) or heart rates (electrocardiogram) provide excellent accuracy. However, these sensors are impractical for daily driving because of driver discomfort and setup complexity. Nonintrusive camera systems offer a better alternative; however, they present certain challenges.
Simpler camera systems rely on static geometric metrics, such as the eye aspect ratio (EAR) or percentage of eye closure. These systems attempt to define a hard, mathematical threshold for when an eye is considered “closed.” The fundamental problem with this approach is intersubject variability.
More advanced systems usually combine convolutional neural networks (CNNs) with recurrent layers to achieve high accuracy. However, scanning raw image pixels frame by frame requires significant processing power, which restricts deployment of these models in standard low-cost vehicle microprocessors.
Research Objectives This paper proposes a novel lightweight detection architecture to bridge the gap between rigid geometric thresholding and computationally demanding CNN-based deep learning. Rather than merely extracting facial landmarks to calculate pre-engineered geometric features, the proposed model uses Google MediaPipe (Lugaresi et al., 2019) to extract a streamlined vector of 3D facial blendshape coefficients to serve as a continuous kinematic signal. By feeding these lightweight data into a specialized time-series network, the model achieves high accuracy by focusing strictly on the temporal dynamics of the face.
RELATED WORK
Physiology of Drowsiness and Microsleeps To develop an effective detection system, the model must match the manner in which fatigue occurs in the human body. Fatigue triggers “microsleeps”— brief, uncontrollable episodes where the driver temporarily loses consciousness. Studies have shown that a significant proportion of these critical microsleep events last between 1 and 3 s (Hertig-Godeschalk et al., 2020; Skorucak et al., 2020). As these rapid, transient lapses are the earliest indicators of severe sleepiness, tracking them provides a much more sensitive evaluation of driver fatigue than waiting for a prolonged sleep onset (Anniss et al., 2021).
This biological reality exposes a major flaw in systems that rely on flat long- term averages. To solve this problem, a reliable system requires a carefully sized temporal window, an approach demonstrated by Ghoddoosian et al. (2019). The window must be long enough to recognize a consistent blinking pattern, but short enough to catch the rapid, sudden lapses in attention that cause accidents.
Lightweight Driver Drowsiness Detection Model 75 Ocular Dynamics Over Static Metric
Studies have shown that the physical motion of a blink provides valuable fatigue indicators beyond static eye closure. Caffier et al. (2003) demonstrated that fatigue is associated with characteristic modifications of the blink waveform, while McIntire et al. (2014) showed blinks become more frequent and longer in duration.
Application of Facial Blendshapes in State Detection Recently, researchers have begun moving away from heavy CNN-based video processing and opting instead for lightweight 3D facial landmarks to enable these systems to work smoothly on everyday devices. For example, Adhikari et al. (2025) and Badri et al. (2025) successfully used Google’s MediaPipe framework to monitor driver fatigue. Taking this a step further, Suzuki and Tanaka (2025) proved that smartphones can handle this processing in real- time using Apple’s ARKit to extract blendshapes for drowsiness estimation. This combination of blendshapes and recurrent networks works well in adjacent fields, such as using long short-term memory (LSTM) to estimate human emotions (Attrah, 2025).
However, although these tracking tools are cutting-edge, most researchers use them somewhat traditionally. Instead of allowing a neural network to analyze raw movement, landmarks are usually extracted to calculate geometric metrics, such as checking the EAR or timing a basic blink (Adhikari et al., 2025; Badri et al., 2025). Even when using advanced blendshapes, studies, such as Suzuki and Tanaka (2025), averaged the temporal data into static metrics (such as mean and variance) so that they could fit into standard classifiers, such as K-nearest neighbors.
Unlike static approaches, our model processes targeted blendshape coefficients as continuous time-series signals to identify the muscle kinematics of fatigue.
METHODOLOGY
Feature Extraction and Selection To achieve real-time performance and minimize the computing load, rather than relying on computationally heavy end-to-end CNNs to analyze every pixel, our system uses the Google MediaPipe Face Landmarker, a highly optimized, lightweight on-device vision pipeline, to infer a dense 478-point 3D geometry (Kartynnik et al., 2019) of the driver’s face from a standard RGB camera feed. From this, MediaPipe outputs scalar blendshape coefficients that represent the intensity of specific facial muscle activation.
Rather than utilizing all available blendshapes, we specifically selected a streamlined seven-dimensional vector of ocular and brow features to isolate involuntary reflexes. We excluded mouth and jaw features because of their high susceptibility to voluntary masking and social conditioning. To ensure signal stability, the corresponding left- and right-blendshapes were averaged (Avg). The selection of these features is based on established behavioral markers of vigilance decrement: (1) Avg eyeBlink is the primary indicator
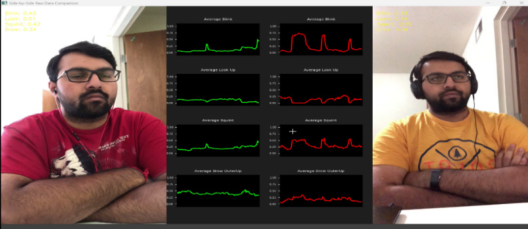
of microsleeps and closure duration; (2) Avg eyeLookDown and eyeLookUp track gaze drooping and eyelid heaviness; (3) Avg eyeSquint indicates that the driver is “fighting” sleep or struggling to focus; (4) Avg browDown and browOuterUp capture compensatory actions, such as raising the eyebrows to force the eyes open; and (5) Avg eyeWide detects the sudden jerking-awake reflex that frequently follows a microsleep (Figure 1).
Data Preprocessing and Subject-Specific Normalization To prevent the neural network from confusing natural physiological variances (e.g., naturally narrow eyes or slow resting blink rates) with actual fatigue, a subject-specific calibration strategy inspired by the initial fixed- time baseline concept of Akin and Kalkan (2024) combined with the Z-score standardization proposed by Ghoddoosian et al. (2019) was implemented.
Figure 1: Demonstration of extracted blendshape coefficients (e.g., Avg Blink, Avg LookUp) utilized as continuous, time-series signals (Left: State 0, Right: State 10).
During preprocessing, the raw blendshape data were extracted from MediaPipe into .npz arrays. A personal baseline was established for each participant. The system assumes that the first two minutes of the subject’s “alert” state video represents their natural, awake baseline. The first 20 frames of this video were skipped to mitigate the initial MediaPipe detection noise. From this two-minute baseline window, the personal mean ( alert µ ) and standard deviation (σ alert) were calculated for each of the seven features. All subsequent continuous data streams for that specific subject across their alert, low vigilance, and drowsy states were then normalized against this personal baseline using the following equation:
X µ X
− = raw alert norm
σ alert
Temporal Windowing Strategy As drowsiness must be evaluated as a progressive degradation rather than an isolated event, we defined the input data using both global and local contexts.
First, continuous video data were segmented into overlapping global windows of 3,600 frames utilizing a sliding stride of 900 frames. Given
Lightweight Driver Drowsiness Detection Model 77 that the camera frame rates across the dataset vary (generally operating at or below 30 FPS), a 3,600-frame window represents approximately two minutes of elapsed time. This duration was deliberately selected to ensure the statistical validity of feature extraction. Assuming a standard human blink rate of 15–20 blinks per minute, a two-minute window reliably captured over 30 individual blink events. This threshold aligns directly with the baseline temporal analysis established by the dataset’s authors, Ghoddoosian et al. (2019), who demonstrated that evaluating sequences of 30 consecutive blinks provides an optimal contextual baseline for accurately classifying varying states of drowsiness.
Second, this global window was subdivided into smaller, overlapping local microchunks of 50 frames (approximately 1.6 s), utilizing a 25-frame stride. This 1.6 s window is sized to encapsulate a typical 1–3 second microsleep, providing high-resolution temporal focus without diluting the data.
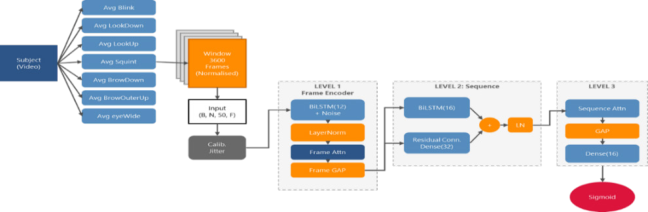
Dual-Attention Hierarchical BiLSTM Architecture These chunks were processed using a hierarchical BiLSTM network. This architecture is inspired by natural language processing (NLP) models, such as the hierarchical multiscale recurrent neural networks developed by Chung et al. (2017). In NLP, a model learns that characters form words and words form sentences. Similarly, our architecture is structured to map how individual frames form blinks (local dynamics) and how a sequence of blinks forms a pattern of fatigue (global dynamics).
As illustrated in Figure 2, the network operates on two distinct levels: The first BiLSTM layer analyzes the 50 individual frames and serves as a temporal feature extractor. This layer is intended to capture the immediate kinematics of ocular events (providing a representational capacity to distinguish a normal, rapid blink from a sluggish, tired blink). The second BiLSTM layer aggregates the encoded chunks across a broader two-minute window. This layer is intended to evaluate the sequence of events, providing the contextual baseline required to determine whether a heavy blink is an isolated anomaly or part of a deteriorating pattern of fatigue. We implemented a residual connection (He et al., 2016) via a dense projection layer to facilitate healthy gradient flow through the deep network.
Figure 2: Proposed hierarchical BiLSTM architecture demonstrating the 50-frame chunking strategy, sequence encoding, and dual-level additive attention mechanism.
To optimize the focus of the model, an additive attention mechanism (Bahdanau et al., 2014) was applied in a self-attention configuration at both levels. At the frame level, it provides the network with the mathematical capacity to dynamically weigh the most critical kinematic moments within a microchunk of 1.6 s, rather than treating all 50 frames with equal importance. At the sequence level, as the vast majority of a two-minute drive consists of normal behavior, the attention layer enables the network to suppress baseline alert data and prioritize specific microchunks containing vigilance decrements.
Data Partitioning and Labeling Strategy The model was trained and validated using the UTA-RLDD dataset (Ghoddoosian et al., 2019). This dataset was selected because it captured genuine (nonacted) drowsiness from 60 participants in uncontrolled, real-life indoor environments. The dataset was explicitly provided in five predivided folds, each containing 12 subjects. To ensure a rigorous evaluation, one of these predefined folds (20% of the total data) served as the final unseen test set. We used the remaining four folds for internal training and validation, employing stratified group k-fold cross-validation (k = 5). This resulted in an overall data distribution of 64% for training, 16% for validation, and 20% for testing. Crucially, grouping by subject ID ensured that all the video states of a single participant were kept together in either the training or validation set, thereby strictly preventing data leakage.
The dataset provided three discrete labels: alert (0), low vigilance (5), and drowsy (10). To capture the continuous nature of fatigue, we mapped these states to continuous soft probability targets: Alert was mapped to 0.0, low vigilance to 0.6 (modeled as a transitional state leaning toward drowsiness), and drowsy to 1.0.
By utilizing binary cross-entropy (BCE) loss with these soft targets, the network was trained to output a continuous probability representing the degree of drowsiness, rather than forcing hard classification during training. This approach leveraged the probabilistic nature of the final sigmoid activation function of the network. However, as operational safety requires a strict binary trigger, this continuous probability was evaluated using a designated decision boundary (threshold of 0.35) during the inference. This hybrid design allowed the model to learn the gradual progression of fatigue while actively grouping transitional and drowsy states to prioritize the early detection of unsafe driving.
Training Protocol To maximize the robustness of the model against real-world deployment challenges, we introduced a custom calibration jitter layer during training. This layer applies random gain and bias shifts to the input tensors along with a Gaussian noise layer. This domain randomization strategy serves a dual purpose: it simulates physical camera calibration errors and lighting inconsistencies while artificially expanding intersubject variability.
Lightweight Driver Drowsiness Detection Model 79 Consequently, the network is forced to learn the universal kinematics of fatigue (relative feature dynamics) rather than overfitting the absolute facial geometry of the training subjects. Internal data normalization was further stabilized by layer normalization within network blocks.
RESULTS
Cross-Validation Performance To evaluate the capacity of the network to detect fatigue without overfitting, the performance was initially assessed using five-fold stratified group cross- validation on the internal training and validation partitions (144 videos). Although the model was trained using continuous soft-label probabilities via BCE, operational safety requires a binary trigger: the driver is either safe (alert) or unsafe (low vigilance/drowsy). To convert the continuous probability outputs into a binary classification during cross-validation, a generalized global decision threshold of 0.35 was applied. As the primary objective of this study was the early detection of fatigue, this threshold was selected between the alert (0.0) and low vigilance (0.6) soft targets. By establishing the boundary at 0.35, the system effectively groups both the “low vigilance” and “drowsy” conditions into a single “unsafe” category, strictly separating them from the “safe” alert state.
Under this cross-validation framework, the model achieved a mean window-level accuracy of 86.47% (± 2.57%) and a mean receiver operating characteristic-area under the curve (ROC-AUC) of 92.66% (± 2.27%). As individual windows can occasionally contain anomalous blinks, a soft voting mechanism was applied across all the windows in a given video to determine the final state. Video-level voting increased the mean accuracy to 89.56% (± 4.10%). Furthermore, the system demonstrated a window-level mean sensitivity (recall) of 86.47% (± 4.09%), a high mean precision of 92.70% (± 1.46%), and an F1-score of 89.42% (± 2.02%).
Test Set Evaluation Following the cross-validation, the system was evaluated using a completely unseen 20% hold-out test set (36 videos). The predictions from five independently trained cross-validation models were aggregated using a soft voting mechanism (averaging the output probabilities). The operational binary threshold of 0.35, chosen during the cross-validation phase, was applied to these ensemble probabilities.
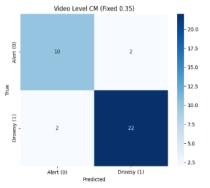
Consequently, in the hold-out test set, the ensemble model successfully classified 32 of the 36 videos, yielding a video-level accuracy of 88.89% and a window-level accuracy of 86.90%. The ROC-AUC remained exceptionally strong at 90.51%. Crucially, the ensemble model achieved a window-level sensitivity (recall) of 91.14%, successfully detecting fatigue in the vast majority of unsafe driving scenarios while maintaining a balanced precision of 89.12% and a final F1-score of 90.12% (Figure 3, Table 1).
Figure 3: Confusion matrices for the test performance of the final ensemble model. 1. Video-level. 2. Window-level.Table 1: Summary of the performance of the ensemble model on unseen test data.
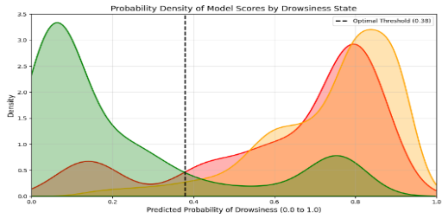
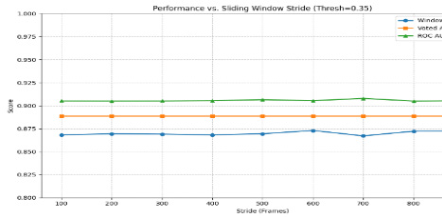
State Discrimination and Stride Sensitivity To evaluate and visualize the true state discrimination capabilities of the model on the unseen data, a probability density analysis was conducted strictly on the test set ensemble scores. This analysis revealed an evident separation between classes, with the alert state heavily concentrated near 0.0–0.2 and the low vigilance and drowsy states concentrated near 0.6–1.0. A distinct intersection point occurred at 0.38, validating the efficacy of the preselected threshold of 0.35 in safely capturing the early onset of drowsiness (Figure 4). A stride sensitivity analysis was conducted on the evaluation set to verify that the model performance was not simply an artifact of a specific temporal alignment. The sliding window stride was systematically varied from 100 (3.3 s) to 900 frames (30 s). As shown in Figure 5, the analysis demonstrated that the ensemble model’s performance metrics (accuracy and ROC-AUC) remained highly stable and robust to changes in sampling stride. This stability confirms that the aggregated decision of the model is independent of where the window begins.
Table 2: Comparison of the proposed model against existing temporal models.
Table available in the original PDF paper.
Proposed Method
Study de Souza et al. (2025) (120 Frames)
Xu et al. (MDPI, 2025) (3 Class) (30 Second)
Model Type Hybrid CNN + BiLSTM
Ensemble (RF, MLP, XGBoost)
Hierarchical BiLSTM Attention
Feature Strategy 3 Ratios (EAR, LAR, ChinNose)
20 Engineered Features (Gaze, Head Pose, etc.)
Raw Blendshape Features (Continued)
Table 2: Continued.
Table available in the original PDF paper.
Proposed Method
Study de Souza et al. (2025) (120 Frames)
Xu et al. (MDPI, 2025) (3 Class) (30 Second)
77.59% 78.85% 86.90%
Accuracy (Window) Not Reported 86.52% 88.89% Accuracy (Video)
77.00% 75.43% 91.14%
Sensitivity (Recall)
Figure 4: Probability density distribution of the ensemble model predictions.Figure 5: Stride sensitivity analysis showing robustness of the model.
Comparative Benchmarking The performance of the proposed hierarchical BiLSTM attention model was benchmarked against comparable participant-independent temporal models evaluated using the UTA-RLDD dataset.
A hybrid CNN+BiLSTM model proposed by de Souza et al. (2025), utilizing three manually calculated facial ratios (EAR, lip aspect ratio (LAR), and chin–nose distance), achieved a window-level accuracy of 77.59% and a sensitivity (recall) of 77.00%. Similarly, an ensemble model (random forest, multilayer perceptron, XGBoost) for a harder three-class classification problem developed by Xu et al. (2025) utilizing 20 engineered features achieved a window-level accuracy of 78.85% (95.59% in binary classification), a video- level accuracy of 86.52%, and a sensitivity (recall) of 75.43%. However,
it is important to note key differences in the evaluation data. To address potential label noise, Xu et al. (2025) applied an observation protocol to manually exclude ambiguous samples in which visual cues conflicted with the participants’ original labels. The model was evaluated using leave-one- participant cross-validation on a filtered subset of the dataset.
In contrast, the proposed hierarchical BiLSTM framework was evaluated for the entirety of the unfiltered, unseen test set. Despite processing these highly ambiguous samples, the proposed model maintained its robust performance, achieving a window-level accuracy of 86.90%, a video-level accuracy of 88.89%, and a critical sensitivity (recall) of 91.14% (Table 2).
DISCUSSION AND CONCLUSION This study demonstrates that early signs of driver fatigue can be accurately detected by leveraging the scalar blendshapes of the Google MediaPipe Face Landmarker. As MediaPipe is specifically optimized for mobile and edge devices, this model ensures that the proposed detection pipeline is lightweight and capable of true real-time execution on standard in-vehicle hardware.
The model successfully captured the gradual progression of fatigue by training against soft target probabilities. To ensure that the system prioritizes early warnings, we enforced a strict binary safety boundary during inference using a global threshold of 0.35, effectively grouping the transitional and drowsy states together. Importantly, this threshold is not rigid; in real-world deployments for mitigation or warning, it can be calibrated for specific individuals to balance safety and comfort. When evaluated on unseen test data, the ensemble model proved to be exceptionally robust, achieving a window- level accuracy of 86.90%, an ROC-AUC of 90.51%, a safety sensitivity (recall) of 91.14%, and a video-level accuracy of 88.89%. Ultimately, this model offers a highly reliable and computationally efficient solution, making it ideal for integration into real-world systems.
LIMITATIONS AND FUTURE WORK Study Limitations
Although the proposed model performed well, there are practical limitations to consider. First, the model was trained on the UTA-RLDD dataset, which uses standard webcams for controlled indoor lighting. Real-world deployment will require infrared cameras to handle dynamic lighting and nighttime driving.
Second, the current system uses a fixed safety threshold of 0.35 to decide when a driver is tired. However, blinking patterns differ for everyone. Therefore, a single fixed threshold is not ideal for all drivers.
Finally, this study only addressed the detection phase of driver monitoring. As highlighted in the scoping review by Ayas et al. (2024), a major gap in the current research is that, despite advancements in detection algorithms, the physical strategies used to mitigate fatigue remain heavily underexplored. Therefore, although the proposed software detection model is highly accurate, it has not yet been connected to a physical warning/mitigation system to prove that it can be successfully used in drowsiness mitigation systems.
Lightweight Driver Drowsiness Detection Model 83 Future Scope
To address these limitations, the next phase of this study will focus on the transition from a software-only detection model to a completely closed- loop mitigation system. The primary goal is to determine whether this deep- learning model could be practically used to actively reduce drowsiness.
To achieve this, the detection model will be connected to a custom-retrofitted haptic seat cover with embedded vibration motors. Controlled by an Arduino microcontroller, the vibrating motors placed in the lower back and thigh areas provide an immediate physical alert when the model detects an unsafe state. We plan to evaluate this closed-loop system in a driving simulator and analyze the drowsiness probability output of the model in response to the triggered haptic cues. This study aims to scientifically validate whether model-driven haptic feedback can successfully mitigate driver fatigue.
REFERENCES
Adhikari, M., Joshi, P., Shrestha, S., and Shaik, S. (2025). Vision-based driver drowsiness and distraction detection through behavioral indicators of fatigue, Proceedings of the 2025 IEEE SoutheastCon, pp. 261–266. https://doi. org/10.1109/SoutheastCon56624.2025.10971515 Akin, A. and Kalkan, H. (2024). Detecting driver fatigue with eye blink behavior,
arXiv preprint arXiv:2407.02222. https://doi.org/10.48550/arXiv.2407.02222 Anniss, A. M., Young, A., and O’Driscoll, D. M. (2021). Microsleep assessment enhances interpretation of the Maintenance of Wakefulness Test, Journal of Clinical Sleep Medicine, Volume 17, No. 8, pp. 1571–1578. https://doi. org/10.5664/jcsm.9250 Attrah, S. (2025). Emotion estimation from video footage with LSTM, arXiv preprint
arXiv:2501.13432. https://doi.org/10.48550/arXiv.2501.13432 Ayas, S., Donmez, B., and Tang, X. (2024). Drowsiness mitigation through driver state monitoring systems: A scoping review, Human Factors, Volume 66, No. 9, pp. 2218–2243. https://doi.org/10.1177/00187208231208523 Badri, F., Ruhmana Sari, S. U., and Bin Hamzah, S. A. (2025). Analysis of driver
drowsiness detection system based on landmarks and MediaPipe, Inform: Jurnal Ilmiah Bidang Teknologi Informasi dan Komunikasi, Volume 10, No. 1, pp. 21–28. https://doi.org/10.25139/inform.v10i1.9325 Bahdanau, D., Cho, K., and Bengio, Y. (2014). Neural machine translation by jointly learning to align and translate, arXiv preprint arXiv:1409.0473. https://doi. org/10.48550/arXiv.1409.0473 Caffier, P. P., Erdmann, U., and Ullsperger, P. (2003). Experimental evaluation of
eye-blink parameters as a drowsiness measure, European Journal of Applied Physiology, Volume 89, pp. 319–325. https://doi.org/10.1007/s00421-003- 0807-5 Chung, J., Ahn, S., and Bengio, Y. (2017). Hierarchical multiscale recurrent neural networks, arXiv preprint arXiv:1609.01704. https://doi.org/10.48550/ arXiv.1609.01704 de Souza, L. T. L., Paixão, T. M., and Tello, R. J. M. G. (2025). Driver drowsiness
detection: Comparative analysis of BiLSTM and CNN+BiLSTM architectures, Anais da 10ª Escola Regional de Informática do Espírito Santo (ERI-ES) (pp. 61–69). Sociedade Brasileira de Computação (SBC). https://doi.org/10.5753/ eries.2025.16019
Ghoddoosian, R., Galib, M., and Athitsos, V. (2019). A realistic dataset and baseline temporal model for early drowsiness detection, Proceedings of the IEEE/CVF Conference on Computer Vision and Pattern Recognition (CVPR) Workshops. https://doi.org/10.48550/arXiv.1904.07312 He, K., Zhang, X., Ren, S., and Sun, J. (2016). Deep residual learning for image
recognition, Proceedings of the IEEE Conference on Computer Vision and Pattern Recognition (pp. 770–778). https://doi.org/10.48550/arXiv.1512.03385 Hertig-Godeschalk, A., Skorucak, J., Malafeev, A., Achermann, P., Mathis, J., and Schreier, D. R. (2020). Microsleep episodes in the borderland between wakefulness and sleep, Sleep, Volume 43, No. 1, zsz163. https://doi.org/10.1093/sleep/zsz163 Kartynnik, Y., Ablavatski, A., Grishchenko, I., and Grundmann, M. (2019). Real-time
facial surface geometry from monocular video on mobile GPUs, arXiv preprint arXiv:1907.06724. https://doi.org/10.48550/arXiv.1907.06724 Lugaresi, C., Tang, J., Nash, H., McClanahan, C., Uboweja, E., Hays, M., Zhang, F., Chang, C.-L., Yong, M. G., Lee, J., Chang, W.-T., Hua, W., Georg, M., and Grundmann, M. (2019). MediaPipe: A framework for building perception pipelines, arXiv preprint arXiv:1906.08172. https://doi.org/10.48550/arXiv.1906.08172 McIntire, L. K., McKinley, R. A., Goodyear, C., and McIntire, J. P. (2014). Detection
of vigilance performance using eye blinks, Applied Ergonomics, Volume 45, No. 2, pp. 354–362. https://doi.org/10.1016/j.apergo.2013.04.020 Skorucak, J., Hertig-Godeschalk, A., Achermann, P., Mathis, J., and Schreier, D. R.
(2020). Automatically detected microsleep episodes in the fitness-to-drive assessment, Frontiers in Neuroscience, Volume 14, 8. https://doi.org/10.3389/ fnins.2020.00008 Suzuki, S. and Tanaka, H. (2025). Five-level drowsiness estimation using BlendShape features captured by a smartphone’s front-facing camera, Applied Human Factors and Ergonomics (AHFE2025), Volume 199. https://doi.org/10.54941/ ahfe1006877 Xu, C., Huang, W., Liu, J., and Li, L. (2025). Detecting driver drowsiness using
hybrid facial features and ensemble learning, Information, Volume 16 No. 4, 294. https://doi.org/10.3390/info16040294
LISTED IN THE AHFE DIGITAL BOOKSTORE CATALOGUE
Explore the complete digital volume
Affective and Pleasurable Design
Read this individual research paper free through the original publisher, or explore the full digital proceedings book.
ISBN 978-1-964867-80-9
Explore this ISBN in the AHFE Bookstore ↗Listed in the July 2026 bookstore catalogue; search by ISBN to confirm current availability · Digital book purchase optional