Ana Teixeira, Sonia Brito-costa, Anabela Gomes (2024). Colors in Mind: A Comprehensive Study on the Neurological Impact of Saturation. In: Health Informatics and Biomedical Engineering Applications. AHFE Open Access, vol. 142, pp. 90–96. https://doi.org/10.54941/ahfe1005074
The perception of color is a crucial cognitive aspect that profoundly impacts cognition, emotions, and behaviour. Cool colors evoke comfort and relaxation, while warm colors stimulate and energize. This study explores how color saturation impacts brainwave patterns, using EEG signals and the MUSE BCI. Twenty-five participants, including 5 colorblind individuals, aged 18-60, viewed 10 colors on a computer screen at varying saturations. Analysis reveals distinct color effects on attention and diverse responses. Notably, saturated blue captures attention, while yellow and violet elicit a less pronounced response. Energy frequency band analysis shows varied stimulation levels across brain waves. The ERD/ERS complex indicates positive aspects, suggesting desynchronization during color observation and heightened neuronal excitement. The study underscores color's substantial role, offering insights into psychology. Frontal EEG measurements elucidate the influence of color saturation on physiological and perceptual responses.
In our ever-changing technological world, where we spend extended periods in front of screens, the significance of color and its strategic use has increased. The way we perceive color, a fundamental cognitive aspect, holds consider- able importance. It not only plays a significant role in influencing cognitive processes but also affects different levels of mental arousal, as demonstrated by analysing power spectral density from EEG signals (Rakshit and Lahiri, 2017). Numerous studies in various fields, including psychology (Dantas et al., 2022; Clarke and Costall, 2008), neuromarketing (Chai et al., 2019; Wilms and Oberfeld, 2018), and design (Ko et al., 2010; Wang et al., 2021), explore the impact of color. Color goes beyond just aesthetics; it profoundly influ- ences cognition, emotions, and behaviour (Teixeira et al., 2023). Cool colors
Colors in Mind: A Comprehensive Study on the Neurological Impact of Saturation 91
like green, blue, and violet are often linked to feelings of comfort, relaxation, tranquillity, and stress reduction. On the other hand, warm colors like red, yellow, and orange are more stimulating, capable of evoking emotions and energizing individuals. Neutral colors, with their subdued emotional impact, have a lesser psychological effect (Clarke and Costall, 2008).
The utilization of color, encompassing factors such as hue, saturation, and brightness, has psychological implications that must be handled with care, especially in performance contexts where the color red, for instance, can serve as a potentially adverse environmental signal impacting behaviour. Color’s substantial influence extends into marketing and packaging, mak- ing color stimuli-based neuromarketing research an essential tool for market analysis (Teixeira and Gomes, 2023; Teixeira and Gomes, 2023; Graimann et al., 2002; Pfurtscheller, 2001). Brain-Computer Interaction (BCI) tech- nology, particularly in the field of Human-Computer Interaction (HCI), has gained prominence for its diverse applications. In information comprehen- sion, the skilful application of color enhances readability and understanding. This interdisciplinary study merges the Theory of Visual Perception, HCI, and cognitive neuroscience to explore how the brain processes color information using EEG technology (Hussain, 2021; Khattak et al., 2018). BCI assumes a crucial role in neuromarketing, examining the brain’s responses to marketing stimuli.
This research explored how color saturation influences brainwave patterns in colorblind and non-colorblind individuals. Utilizing EEG signals and the MUSE brain-computer interface (BCI), the study aimed to understand the impact of distinct color saturation levels and intermittent grey stimuli on physiological responses and perceptions. The goal was to uncover the subtle yet significant role of color in human perception, preferences, and psychology, irrespective of individual awareness.
The P100 wave, considering its amplitude and latency in response to each color was already studied and the results shown that present different ampli- tudes and latencies in the two samples and between colors (Teixeira and Gomes, 2023; Teixeira and Gomes, 2023). To our findings, we conducted frequency analysis and explored the ERD/ERS complex (Graimann et al., 2002; Pfurtscheller, 2001) for each color, reinforcing the results and suggest- ing potential avenues for future research. This study investigated the impact of color on frontal EEG results in two participant groups. A PC screen pre- sented 10 distinct colors under various conditions to ensure consistent visual stimuli. By the results, it can be concluded that certain colors indeed have a more pronounced impact, capturing the attention of individuals in both sample groups, such as the saturated blue color. Conversely, some colors, like shades of yellow and violet, elicited a less significant response from this perspective.
Concerning the topic of color, it holds great promise in various studies, offering insights in the field of psychology, for instance. The research demon- strated that frontal EEG measurements, namely ERS/ERD, can elucidate the influence of varying color saturation levels on participants’ physiological reactions and perceptual responses.
In future research, we aim to explore the relationship between color and marketing, conducting experiments during the observation of different exist- ing brand logos to investigate how viewing them influences brain activity and human mood.
This paper follows a structured organization, introducing the problem, outlining experimental protocol and participants, presenting results and discussions, and addressing some conclusions, limitations, and further work.
EXPERIMENTAL PROTOCOL AND PARTICIPANTS This study included 25 participants with an average age of 32 (SD = 12.3), comprising 12 women and 13 men. Five participants had red-green color blindness (deuteranopia), while the remaining 20 had normal color vision. The InteraXon’s MUSE BCI with a 256 Hz sampling rate was used to assessed P100 wave latency and amplitude, Theta, Alpha, Beta waves, and ERD/ERS complex. The MUSE headband, with 5 dry sensors, was comfortably worn, measuring frontal (F7 and AF8) and rear (TP9 and TP10) locations, with a reference sensor (FPZ). The experiment featured 10 distinct colors on a PC screen, intermittently presenting grey. Initially, colors were displayed with 100% saturation, followed by the same shades at 50% saturation. Each color appeared for 1 second, except for the 2-second presentation of grey. The sequence began and ended with geay, following a specific order detailed in Table 1.
Table 1. Color id, where S. means saturated.
Table available in the original PDF paper.
# Color RGB Name # Color RGB Name 2 (0; 0; 255) S. Blue 12 (62; 62; 194) Blue 4 (255; 255; 0) S. Yellow 14 (194 194; 62) Yellow 6 (255; 0; 255) S. Violet 16 (194; 62; 194) Violet 8 (255; 0; 0) S. Red 18 (194; 62; 62) Red 10 (0; 255; 0) S. Green 20 (62; 194; 62) Green
RESULTS AND DISCUSSION
To understand the impact on brain activity activation and inhibition induced by each presented color segment, an analysis of the ERD/ERS complex in theta band was conducted. Event-related desynchronization (ERD) signifies a localized and brief decrease in in power or amplitude of brain oscillations in response to a specific event or stimulus, while event-related synchronization (ERS) indicates an increase in that power. ERD/ERS values are expressed as percentages, with A denoting energy within the frequency band of interest during the activity period and R denoting energy during the initial reference period. The ERD/ERS complex is defined as the percentage of energy using the formula:
ERD
ERS % = (A −R)
R ∗100 (1)
Colors in Mind: A Comprehensive Study on the Neurological Impact of Saturation 93
Interpreting the complex, a negative value indicates desynchronization, signifying maximum absorption of information when R is greater than A. Conversely, a positive value indicates synchronization when R is less than A. In the context of this study, ERD and ERS describe changes in brainwave activity when exposed to screens of different colors. ERD, indicating a decrease in power and ERS, indicating an increase in power offer insights into how colors affect cognitive or emotional processes.
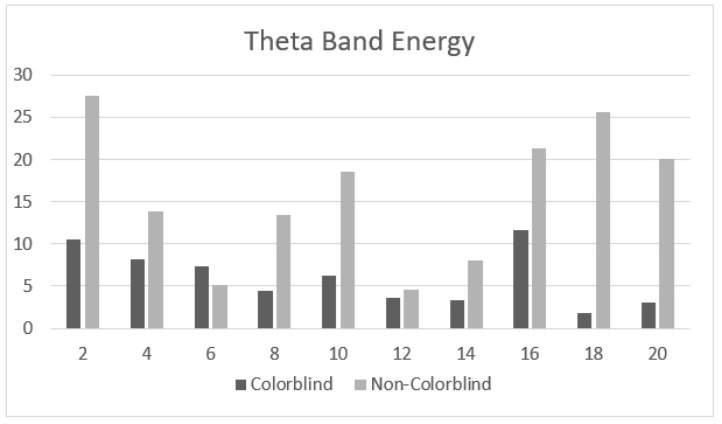
Figure 1: Average of theta band energy considering all colors described in Table 1.
For instance, increased ERD in the alpha band [8-13 Hz] typically suggests a decrease in cortical activity or inhibition in the brain. When viewing calming colors may suggest relaxation, as alpha band ERD is often associated with states of relaxation, calmness, or reduced cognitive load. However, in some cases, increased alpha band ERD may indicate increased visual processing or a decrease in visual attention.
Increased ERD in the beta band [13–30 Hz] is generally associated with increased cortical activity or activation in the brain, viewing attention- grabbing colors may indicate heightened focus, as beta band ERD is often linked to cognitive engagement, attention, and active mental processes. How- ever, in motor-related tasks, beta ERD may be observed, reflecting increased motor planning and execution.
In this experiment, the theta band [4–8] Hz was taken into considera- tion to conduct the ERD/ERS analysis, Figure 1. Increased ERD in the theta band may indicate changes in cortical activity associated with different cog- nitive and emotional processes. Theta band ERD can be associated with cognitive engagement, memory processes, and working memory tasks. It may also relate to emotional processing and the integration of emotional information.
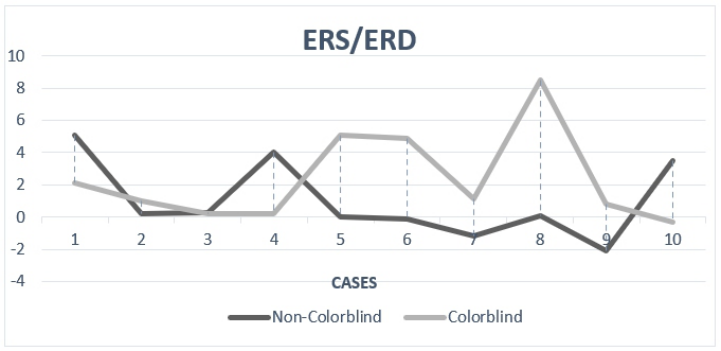
To fully comprehend the influence of colors, consecutive pairs of col- ors were considered as reference parameters, comparing the relationship between colors throughout the segment, Table 2. Grey color (#1, #3, #5, #7, #9, #11, #13, #15, #17, #19) served as a neutral baseline. ERD/ERS analysis in the theta band revealed desynchronization for colors #12 (Blue), #14 (Yellow), and #18 (Red) in non-colorblind individuals, suggesting a reduction in cognitive functions or relaxation. Conversely, an increase in theta band ERD for colors #2 (Saturated Blue), #8(Saturated Red), and #16 (Green) might indicate heightened cognitive engagement or arousal (Figure 2). Individuals with red-green color blindness, specifically deutera- nopia, have difficulty distinguishing between red and green colors due to the absence of the medium-wavelength cones (green cones) in their eyes. As a result, they may perceive red and green hues differently or have difficulty distinguishing between them. Blue shades are often well-distinguished by individuals with deuteranopia, as they involve different photoreceptor types. Yellow is generally the color that stands out and contrasts well for individuals with red-green color blindness.
Table 2. Relation between color in ERD/ERS analysis considering 10 cases with ten color pairs.
An increase or decrease in ERD concerning the baseline (grey color) indi- cates how the brain’s response to color differs from the neutral state. The analysis showed an ERD in the theta band for colors #12 (Blue), #14 (Yel- low), and #16 (red) in non-colour-blind individuals. This desynchronization
Colors in Mind: A Comprehensive Study on the Neurological Impact of Saturation 95
suggests that these colors lead to a reduction in certain cognitive functions or relaxation (Figure 2).
In the other hand, an increase in theta band ERD might suggest heightened cognitive engagement or arousal when viewing specific colors, such as colors #2 (Saturated Blue), #8 (Saturated Red) and # 20 (Green).
LIMITATIONS AND FURTHER WORK This study reveals distinct impacts of colors on attention, with saturated blue prominently capturing attention, while shades of yellow and violet evoke a lesser response, and the subtle detection of external changes from sensory stimuli is noted, emphasizing the nuanced nature of color perception. Posi- tive aspects in the ERD/ERS complex suggest heightened neuronal excitement during color observation, however, it is crucial to acknowledge this study’s limitations, namely the small sample size and the limited age range con- strain generalizability, emphasizing the need for larger, more diverse samples and consideration of age-related responses. Subjectivity in color preferences and environmental influences are recognized challenges (Best, 2017) and the reliance on a computer monitor may not fully replicate color experiences, suggesting exploration of alternative presentation methods.
Also, the technical limitations of the MUSE BCI device should be consid- ered for future research, that should expand beyond frontal EEG activity, incorporating behavioral assessments for a comprehensive understanding, for example, a longitudinal assessment could provide insights into poten- tial long-term effects, and explore the color-marketing relationship through brand logo observations promises to extend our understanding of how col- ors influence brain activity and human mood. In summary, while our study unveils intriguing findings, addressing these limitations, and venturing into new avenues will enrich our understanding of the intricate interplay between colors, cognition, and behaviour.
CONCLUSION
This study, in sum, underscores the importance of color in attention, empha- sizing the predominance of rich blue and the complex reactions to yellow and violet, and that our cognition is increased by the beneficial characteristics of neural excitation during color observation. To fully understand the complex interactions between colors, cognition, and behavior, future research should prioritize larger, more diverse samples, alternative presentation methods, and comprehensive assessments.
REFERENCES
Best J. Colour Design: Theories and Applications: Second Edition. Colour Design: Theories and Applications: Second Edition. 2017. Chai MT, Amin HU, Izhar LI, Saad MNM, Abdul Rahman M, Malik AS et al.,
Exploring EEG Effective Connectivity Network in Estimating Influence of Color on Emotion and Memory. Front Neuroinform. 2019;13.
Clarke T, Costall A. The emotional connotations of color: A qualitative investigation.
Color Res Appl. 2008;33(5). Dantas ÍJ de M, Batista FEA, Solino LJS, Freire AG, Nascimento MN do, Soares Júnior G. The psychological dimension of colors: a systematic literature review on color psychology. Research, Society and Development. 2022;11(5). Graimann B, Huggins JE, Levine SP, Pfurtscheller G. Visualization of significant
ERD/ERS patterns in multichannel EEG and ECoG data. Clinical Neurophysi- ology. 2002;113(1). Hussain AR. Colour Psychology in Art: How Colour Impacts Mood. Art and Design Review. 2021;09(04). Khattak SR, Ali H, Khan Y, Shah M. Color Psychology in Marketing. Journal of
Business and Tourism. 2018;04(01). Ko YH, Shen IH, Lee DS. Color combinations of visual display terminal (VDT) icon on user preferences and EEG response. Percept Mot Skills. 2010;110(2). Pfurtscheller G. Functional brain imaging based on ERD/ERS. In: Vision Research.
2001 Rakshit A, Lahiri R. Discriminating different color from EEG signals using Interval- Type 2 fuzzy space classifier (a neuro-marketing study on the effect of color to cognitive state). In: 1st IEEE International Conference on Power Electronics, Intelligent Control and Energy Systems, ICPEICES 2016. 2017. Teixeira A, Brito-Costa S, Espada S, Antunes M. Tonal Contrast: Influence of Text
Background Color on the Comfort and Time of Reading. In: 5a Euromediter- ranean Conference for Enviromental Integration, Italy. 2023. Teixeira AR, Gomes A. Analysis of Visual Patterns Through the EEG Signal: Color Study. In In: Schmorrow, D. D., Fidopiastis, C. M. (eds) Augmented Cognition. HCII 2023. Lecture Notes in Computer Science, vol. 14019, Springer. 2023. Teixeira, A. R., Gomes, A. (2023). Analysis of Visual Patterns Through the EEG
Signal: Color Study. In: Schmorrow, D. D., Fidopiastis, C. M. (eds) Augmented Cognition. HCII 2023. Lecture Notes in Computer Science, vol. 14019. Springer, Cham. Wang Y, Wang S, Xu M. The function of color and structure based on eeg features in landscape recognition. Int J Environ Res Public Health. 2021;18(9). Wilms L, Oberfeld D. Color and emotion: effects of hue, saturation, and brightness.
Psychol Res. 2018;82(5).
LISTED IN THE AHFE DIGITAL BOOKSTORE CATALOGUE
Explore the complete digital volume
Health Informatics and Biomedical Engineering Applications
Read this individual research paper free through the original publisher, or explore the full digital proceedings book.
ISBN 978-1-964867-18-2
Explore this ISBN in the AHFE Bookstore ↗Listed in the July 2026 bookstore catalogue; search by ISBN to confirm current availability · Digital book purchase optional