Andreas Alexopoulos, Jean Vanderdonckt, Luis Leiva, Ioannis Arapakis, Michalis Vakalellis, Vassilis Prevelakis (2024). Adaptive Visualization Framework for Human-Centric Data Interaction in Time-Critical Environments. In: Human Interaction and Emerging Technologies (IHIET-AI 2024): Artificial Intelligence and Future Applications. AHFE Open Access, vol. 120, pp. 280–285. https://doi.org/10.54941/ahfe1004578
In today's data-driven era, handling information overload in time-sensitive scenarios poses a significant challenge. Visualization is a valuable tool for comprehending vast amounts of data. However, it's crucial to have self-adapting visualizations that are tailored to the user's cognitive level and grow with their expertise. Existing solutions often fall short in this regard.This paper introduces a framework integrating Artificial Intelligence (AI) techniques for context awareness and emotion sensing, offering visualizations that adjust to user requirements. The framework makes use of cross-modal sensors and Machine Learning (ML) algorithms to analyse behavioural signals, usage statistics, and user feedback. This data guides real-time data ingestion techniques and ML-driven mechanisms, ensuring that visualizations adapt while safeguarding data privacy and confidentiality.
In today’s data-driven era, the task of making objective decisions through complex information visualization systems is increasingly daunting (Shakeel et al., 2022). This is especially true in time-sensitive contexts such as Security Operation Centers (Adams & Snider, 2018) and health monitoring dashboards (Kim, 2022), where humans must navigate information over- load, understand data clearly, and interact efficiently with machines. This task is very challenging for the non-expert human operator since thinking in purely numerical and mathematical abstractions is unnatural, especially in critical situations. Therefore, it is becoming crucial to have self-adapting visualizations tailored to the user’s cognitive level, which evolve alongside their increasing expertise and learn from past experiences.
Achieving this requires adopting AI agents that are capable of enhanc- ing context awareness and human-centric attributes of the presented data (Wu et al., 2022). Despite the success of some recent computational mod- els in predicting expert performance on various tasks, there is still a gap in modeling how other types of users (for example, non-experts) acquire new
Adaptive Visualization Framework for Human-Centric Data Interaction 281
skills over time and how visualizations may be intelligently adapted to their needs.
This paper presents a framework proposed by the SYMBIOTIK project1 that aim to integrate biological principles, collaborative and social-like prop- erties, and tailor-made agents guided by AI techniques for context awareness, emotion sensing, and expressing capabilities. Prior psychological theories have identified the selected properties as highly relevant to the development of human consciousness. The proposed framework incorporates a mechanism to deliver self-adapting visualizations tailored to the user’s cognitive level, evolving in response to their growing expertise and learning from previous experiences. Specifically, the system enables continuous learning and integra- tion capabilities through knowledge exchange and analysis loops formulated via data communication pipelines across the operational environment, the processing components, and the visualization interface. The Paper is orga- nized as follows: first, we detail the different components of the framework and the interactions between them. Then, we describe the evaluation strategy of the proposed solution. Finally, we present the conclusion of the work.
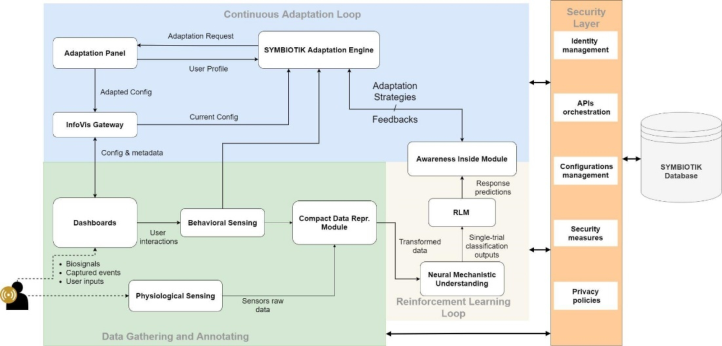
PROPOSED FRAMEWORK The proposed framework composes of four main layers as depicted in Figure 1. In the following we will discuss each of these layers in details.
Layer 1 - Data Gathering and Annotating: This layer is responsible for gathering data from users, annotating it, and then passing it on to the sub- sequent layers. Data collection is achieved through different cross-modal sensors, which collect multimodal behavioural signals. These signals are later analysed using various techniques. The sensors capture information related to the users’ physiological conditions, as well as behavioural data generated through user interactions with the Dashboard. All this informa- tion is stored in the Compact Data Representation module, which enables fast and efficient data storage. Simultaneously, the module utilizes various compression and encoding techniques to further reduce data size while preserving data integrity.
Layer 2 - Reinforcement Learning Loop: This layer is responsible for receiving and processing the annotated data from layer 1. The first mod- ule to receive this information is the Neural-mechanistic Understanding module, which processes it using various AI techniques to gain a deeper understanding of the patterns in the transformed data. The output of this module is shared with the Reinforcement Learning Module (RLM), which designs a Multi-Objective Deep Reinforcement Learning (MODRL) algo- rithm to identify optimal adaptation actions. These recommended actions are shared with the Awareness Inside module, which manages all RL aspects and shares the adaptation strategies that could be selected and later applied with the SYMBIOTIK Adaptation Module. Additionally, it receives user feedback from the SYMBIOTIK Adaptation Module, which is used for the reward function of the RL algorithm.
1https://symbiotik-infovis.eu/
Layer 3 - Continuous Adaptation Loop: This layer is responsible for providing an adaptation plan for the user dashboard and continuously monitoring the adaptation of such a plan. To achieve this, the SYMBI- OTIK Adaptation Module computes an adaptation for the Dashboard by performing one or several cycles of the adaptation process. While per- forming this task, the SYMBIOTIK Adaptation Module interacts with other modules to gather required inputs. Specifically, it uses the biosig- nals captured by the Behavioral Sensing module and requests the end user profile, which consists of demographic data, preferences, and settings for conducting an adaptation life cycle, from the Adaptation Panel. Further- more, it considers the current configuration file of the Dashboard that can be requested from the InfoVis Gateway. The output of the SYMBIOTIK Adaptation Module is an adaptation request, which is shared with the Adaptation Panel. The Adaptation Panel, in turn, shares the configuration file with the InfoVis Gateway, which is integrated within the Dashboard. This integration enables the realization of dashboard adaptations in real- time. The sensors will capture the user behaviour resulting from the new dashboard configuration and share this with layer 3 and 2.
Figure 1: High-level system architecture of the proposed framework.
Layer 4 - Security Layer: The security layer is responsible for defining, inspecting, and monitoring privacy and technical measures that ensure the security of assets across different layers. It also ensures the protection and compliance of the data used and exchanged by the system. This is achieved through several subcomponents, including Identity Management, Security Measures, APIs Orchestration, Privacy Policies, and Configuration Man- agement. This layer will implement the following security features. Firstly, it ensures data pseudonymization; a process that replaces personally iden- tifiable information (PII) fields within data records collected by the sensors with one or more artificial identifiers. This significantly reduces the risk of linking a dataset to a user’s original identity. Additionally, the layer employs robust encryption schemes for data encryption, selected for their
Adaptive Visualization Framework for Human-Centric Data Interaction 283
strength to ensure high-level security. Finally, strict access control mech- anisms are implemented to restrict data access, preventing unauthorized entry, and ensuring that only authorized personnel can interact with the data.
EVALUATION STRATEGIES To implement, test, and validate the framework, we will employ two dis- tinct real-world use cases that align with the criticality of time-sensitive decision-making and the acceleration of the end-user transition from novice to expert. In particular, the Crime Investigation use case will primarily tar- get the achievement of the novice-to-expert transition, while the Security Operation Center use case will facilitate time-sensitive decision-making.
The Crime Investigation use case aims to utilize the adaptive visualiza- tion mechanism to enhance the operational environment of Law Enforcement Agencies (LEA). Specifically, it will involve scenarios where criminals or suspicious individuals are identified through the investigation of phone- extracted data. The analyzed data will encompass a combination of diverse formats (auditory, visual, or textual) and types (e.g., Call Detailed Records, audio files, documents, images, etc.). Visualizing and exploring such datasets result in high-complexity representations (network graphs, timeline analysis, multi-modal charts, and more). Through the adaptation mechanism, our goal is to reveal missing or hidden interactions, identify uncovered patterns, and significantly improve overall usability and situation awareness.
The Security Operation Center use case aims to improve the decision- making process (detect, prevent, and respond) of security operators respon- sible for efficiently managing various tools and technologies to monitor the threat landscape of their organization. The primary investigation scenarios involve exploring vast amounts of data and identifying and mitigating poten- tial malicious incidents detected from various processes (e.g., abnormal, or high-severity events/alerts, malware analysis, data breaches, Denial of Ser- vice (DoS) and Distributed DoS attacks, and more). Through AI-powered adaptations, our objective is to optimize runtime monitoring and user-driven threat detection and response capabilities by providing visual adaptations to highlight critical information, reduce visual noise, and ultimately assist in responding rapidly in time-critical contexts.
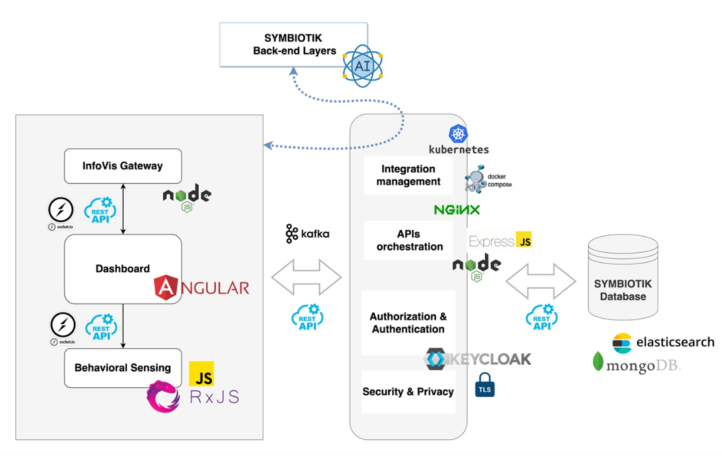
DEPLOYMENT TECHNOLOGY OVERVIEW To guarantee a modular architecture and provide a secure, scalable, and inter- operable solution with other dashboards, we’ve designed the deployment topology shown in Figure 2. Concentrating on the components and modules within the Adaptive Visualization Mechanism, we have developed compo- nents and services to establish communication pipelines, facilitate front-end to back-end data transfer, manage authentication and authorization, offer advanced storage, enable agile orchestration, and more. In more detailed, we use AEGIS AVT2, which is a web application utilized in an Angular- based framework, has been dockerized in a way to support the necessary set
of environment variables and network parameterization options. A Nginx3 dockerized version is being used as the environment’s webserver. In addi- tion, distinct implementations in a NodeJS4 programming environment that involve JavaScript services and associated libraries and frameworks (e.g., RxJS5, ExpressJS6, etc.) have been developed to support a set of initial func- tionalities for the InfoVis Gateway and the Behavioral Sensing components. Similarly, these implementations are being offered as a docker image with the essential environment variables exposed. In order to integrate these docker images and create a communication network between them, a YAML Docker Compose file was used. By using the Docker Compose7 tool, we were able to interconnect and run multi-container applications at once, both in local or production hosts, while laying the foundation for a scalable and robust docker setup through a Kubernetes8 orchestration plan. Additionally, the Docker Volume9 mechanism is employed to persist user-imported data or data generated by and used by the containers. Thus, the necessary config files for the sub-modules and the adapted configuration files from the Adaptation Engine mechanisms were handled by the Docker Volume file system.
Figure 2: Technologies involved in the deployment of the proposed framework.
Adaptive Visualization Framework for Human-Centric Data Interaction 285
CONCLUSION
This paper introduces a novel framework that utilizes Artificial Intelligence techniques to deliver adaptive visualizations tailored to the user’s cognitive level and expertise. By employing cross-modal sensors and Machine Learn- ing algorithms, the framework analyzes behavioral signals, usage statistics, and user feedback to guide real-time data ingestion techniques and ML- driven mechanisms. This ensures visualizations adapt to user requirements, addressing the challenge of information overload in time-sensitive scenar- ios. Furthermore, the framework prioritizes data privacy and confidentiality, making it a robust solution for data visualization in today’s data-driven era.
ACKNOWLEDGMENT
This work is supported by Horizon Europe’s European Innovation Coun- cil and SMEs Executive Agency (EISMEA) through the SYMBIOTIK project under grant agreement 101071147. This paper only reflects the authors’ views, and the European Commission is not responsible for any use that may be made of the information it contains.
REFERENCES
Adams, C. N., & Snider, D. H. (2018). Effective Data Visualization in Cybersecurity.
SoutheastCon 2018, 1–8. https://doi.org/10.1109/SECON.2018.8479113 Kim, S.-H. (2022). A Systematic Review on Visualizations for Self-Generated Health Data for Daily Activities. International Journal of Environmental Research and Public Health, 19(18). https://doi.org/10.3390/ijerph191811166 Shakeel, H. M., Iram, S., Al-Aqrabi, H., Alsboui, T., & Hill, R. (2022). A Comprehen-
sive State-of-the-Art Survey on Data Visualization Tools: Research Developments, Challenges and Future Domain Specific Visualization Framework. IEEE Access, 10, 96581–96601. https://doi.org/10.1109/ACCESS.2022.3205115 Wu, A., Wang, Y., Shu, X., Moritz, D., Cui, W., Zhang, H., Zhang, D., & Qu, H. (2022). AI4VIS: Survey on Artificial Intelligence Approaches for Data Visualization. IEEE Transactions on Visualization & Computer Graphics, 28(12), 5049–5070. https://doi.org/10.1109/TVCG.2021.3099002
LISTED IN THE AHFE DIGITAL BOOKSTORE CATALOGUE
Explore the complete digital volume
Human Interaction and Emerging Technologies (IHIET-AI 2024): Artificial Intelligence and Future Applications
Read this individual research paper free through the original publisher, or explore the full digital proceedings book.
ISBN 978-1-958651-96-4
Explore this ISBN in the AHFE Bookstore ↗Listed in the July 2026 bookstore catalogue; search by ISBN to confirm current availability · Digital book purchase optional