Emilia Visileanu, Marian Catalin Grosu, Paul Tiberiu Miclea, Korinna Altmann, Dirk Brossell (2023). Methods for the collection and characterization of airborne particles in the textile industry. In: Human Systems Engineering and Design (IHSED 2023): Future Trends and Applications. AHFE Open Access, vol. 112, pp. 212–223. https://doi.org/10.54941/ahfe1004132
3 Federal Institute for Occupational Safety and Health UNIT 4.5: Particulate Hazardous, Substances, Advanced Materials, NOLDNERSTR, 40–42, 10317 Berlin, Germany ↗
Airborne particulate matter is one of the main air pollutants. Their impact on mortality, and the occurrence of pulmonary and cardiovascular complications, have been the subject of numerous studies. Airborne particles are complex mixtures of organic and inorganic substances from different sources of particle emissions. Particulate Matter (PM) particles are classified according to their aerodynamic diameter expressed in µm and can vary from coarse (PM 10) to fine (less than PM 2.5). These diameter considerations are fundamental because they condition the penetration of particles into the bronchopulmonary system and the body. In recent years, there has been an interest in so-called “ultra-fine” particles, with a diameter of 0.1 µm (or 100 nm), or PM 0.1. They are nanoparticles and their impact on human health is not yet clear.With more than 1.5 million employees, textiles and clothing is a diverse sector that plays an important role in the European manufacturing industry, producing a turnover of €162 billion.An important component of the solid particles that generate air pollution in the textile industry is microplastics (MP) and nano plastics (NP), which also include microfibers (<5mm) and nanofibers (<100 nm), respectively. The particles released into the air during fiber and yarn processing range from 1 µg/m3 to 50 µg/m3.The paper presents the results of the determination of indoor and outdoor air concentration levels in textile companies, to identify the areas with the highest concentration level, by using an online recording system such as the Laser Aerosol Spectrometer MINI LAS model 11-E. The total concentration level TSP (µg/m3), the fractions PM 10(µg/m3), PM 2.5(µg/m3), PM1(µg/m3), as well as the total number of particles TC (1/l), were shown. It was noted that TSP is approximately at the same level both indoors and outdoors, but the fractions of PM10, PM2.5, and PM1 have much higher values indoors than outdoors with possible consequences on workers' health.The next step was the collection of fibers, namely micro and nano plastic particles from the vicinity of the workplaces of polyester, polyamide, and polypropylene fibers processing units in the textile industry in Romania, to obtain a sufficient quantity for laboratory analysis to determine the size and shape of the particles as well as their chemical composition. Two types of pumps were used, differentiated by their operating parameters: TECORA SKYPOST with airflow of 38 l/min and GILAIRPLUS with airflow 2l/min. Filters made of different materials with different diameters and pore sizes were used, namely: quartz filters (ø 47 mm, and ø 37 mm) on a TECORA SKYPOST type pump, polycarbonate nucleopore coated with a gold membrane (ø 25 mm) and silica filter (ø 9 mm) on GILAIRPLUS type pump.Using descriptive statistics, the calculation of correlation coefficients highlighted a strong correlation between the variables: "Collected mass/ Air concentration" and "Collected mass/ Air volume" for all diameters of the filters.The highest collected particle volume, determined by weighing the filters before and after collection, was obtained with the quartz filters (ø 47 mm) at an airflow of 38 l/min. The particles collected (polyester, polyamide, polypropylene) in the first stage were analyzed by SEM and thermogravimetric and it was found that the quartz filters absorbed the particles inside, with very few remaining on the surface. Thus no known methods can be used to perform analysis for particles collected on quartz filters. The number of particles on the filters was insufficient for analysis either because of the collection parameters used or because of the loss of particles during transport. As a result, in the next step, the use of 9 mm Si filters using the GILAIRPLUS pump at an airflow rate of 2l/min was chosen.To improve the transport conditions and avoid the loss of the particles and keep them on the surface of the filters, two methods were applied:- after weighing the filters were reintroduced into the collection pump holder;- a filtration system for airborne micro-nano plastics was designed and manufactured to selectively collect and transport PM10 and PM1 particles collected on SI filters.In both cases, SEM, Raman mapping, and GS-MS microscopy were used for analysis.Several times more PM10 than PM1 (74.5µg compared to 12.5 µg) was found. In all cases, both particles and fibers showed the same Raman fingerprint.The GS-MS analyses showed some contamination of the workspaces with particles other than the processed fibers. The presence of non-notifiable substances was also observed.The most viable filters are Si filters with a pore size of 10 microns to 1 micron and the use of the selected collection and transport filter system. In the following a filter system will be applied for collection on Au membrane-coated polycarbonate filters.
Airborne particulate matter as complex mixtures of organic and inorganic substances from different sources of particle emissions is one of the main air pollutants (Grosu et al., 2023). However, the abundance and varied composi- tion of the suspended particulate matter make it difficult to locate the precise precursors for some of these environmental pollutants.
Depending on the emission source, particulate matter (PM) can vary in size / aerodynamic diameter (ultrafine PM: 0.01 µm – coarse PM: 100 µm),
Methods for the Collection and Characterization of Airborne Particles 213
density, shape, and composition (Qader et al., 2023). PM from both nat- ural and anthropogenic sources is known to affect the environment (air, water, soil) and human health. Due to its microscopic size, PM can get deep into the lungs and bloodstreams, threatening human health, accounting for nearly one-third of deaths from chronic respiratory disease, lung cancer, and one-quarter of deaths from heart attacks (Agay-Shay et al., 2013). More, according to the latest OECD report, air pollution will be the largest envi- ronmental cause of premature death worldwide by 2050, unless collective action is taken (von Schneidemesser et al., 2015). As particular types of PM, plastic particles mater contamination and associated weathering mechanisms are emergent environmental and human food chain concerns (Klingelhofer et al., 2020). There are multiple sources of micro and nano plastic particles split into two main categories: primary (produced as microparticles or enters the natural environment already as microparticles) and secondary (generated by fragmentation or abrasion of other products in the natural environment) (Grosu et al., 2023). The textile industry, as a major polluter worldwide, gen- erates micro and nano plastic particles during the manufacturing processes, especially nylon, polyester, polyurethane, polyolefin, acrylic, and vinyl-type polymers (Visileanu et al., 2023). Various reviews highlight synthetic tex- tiles as the main superordinate source of airborne microplastics and fibers were the most abundant shape of MP found in the atmosphere (Schopel & Stamminger, 2019).
The paper presents the results of the identification, counting, collection, and characterization of micro and nanoparticles generated during various technological processes in the textile industry.
MATERIALS AND METHODS
Determining PM Concentration In the first step, we had to select the workplace with the highest total sus- pended particles in the air, to demonstrate the presence of the plastic particle in the air and that is possible to collect such amount that is necessary for char- acterization. The level of concentration (total suspended particles-TSP,PM10, PM2.5, and PM (µg/m3) and total counted particles-TC (l/l) in different work areas in the weaving and knitting mill that produce textile fabrics from syn- thetic fibers (polyester-PES/PET, polyamide-PA, and polypropylene-PP) were determined by using an online portable Grimm Optical Spectrometer MINI LAS model 11-E (Grimm Aerosol Technik, n.d.). The mini device uses high- tech laser optics to capture each particle with dimensions between 0.25 and 32 µm and classifies them into 31 size channels (via software), according to the European standard EN 481.
Sampling of MNPs The collection of particles was performed by using 2 methods:
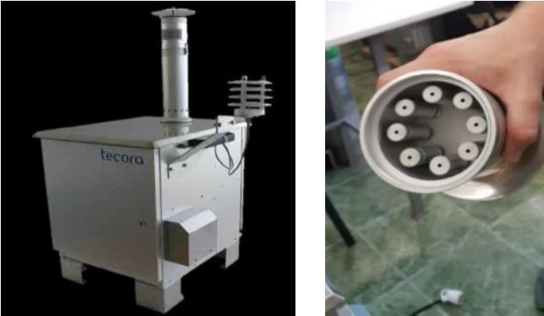
Method 1 - according to SR EN 12341: 2014 standard which is based on sampling the particles on the filters and weighing them using a balance. The TECORA-SKYPOST PM-HV (Figure 1). type device was used for
sampling, which ensures the volumetric measurement with dry gas ether with an accuracy of ±2%. Airflow 38 l/min, 6 m3/h rotary vane pump type. Quartz filters with a diameter of 47 mm were used (see Figure 2). The volume of air was recorded during the collection period. Particles were taken from each type of 3 filters (A1, A2, A3).
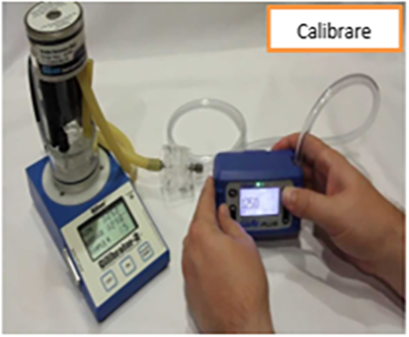
Method II - is based on sampling the particles on the filters using a GILAIR PLUS - type device equipped with cyclone Higgins-Dewell (HD) and a 2 l/min air flow pump. For sampling, 37 mm diameter quartz filters (B1, B2, B3) and 25 mm diameter nucleopore filters coated with gold membrane (C1, C2, C3) were used. For each type of particle and filter, 3 filters were taken. The number of particles collected was determined by the difference in mass between the white filters and the filters after collection.
Figure 1: TECORA SKYPOST PM-HV sampling device.Figure 2: GILAIR PLUS air sampling device.
Table 1 shows the values of the quantities of PES/PET, PA and PP particles collected, from which it can be seen that the highest quantity was obtained when using ø 37mm quartz filters and GILAIR PLUS pump with 2 l/min airflow for PA particles.
Methods for the Collection and Characterization of Airborne Particles 215
Initial mass, µg 9.101 9.393 9.463 9.014 9.569 9.077 9.489 9.9925 9.762 Mass after collection, µg 9.124 9.409 9.487 9.030 9.579 9.094 9.511 9.952 9.777 Mass of collected particles, µg 23.0 16.0 24.0 16.0 10,0 17,0 22.0 27.0 15.0 Air concentration, µg/m3 135.4 90.20 119.21 117.41 68.51 123.43 78.82 127.47 114.37 Air volume, l 1669 1774 2013 136,3 146,0 137,7 279,1 211,8 131,2 Temperature,
C 19.3
Collection parameters\characteristics Filter mass (µg)
Table 1. Particles quantity samples.
Table available in the original PDF paper.
Initial mass, µg 88.32 87.66 86.78 87.69 87.70 92.33 92.34 87.01 87.81 Mass after collection, µg 89.45 89.39 88.33 88.38 88.30 92.79 95.85 90.60 94.56 Mass of collected particles, µg 1.13 1.72 1.54 683 601 462 3.51 3.58 6.74 Air concentration, µg/m3 6.08 8.85 11.90 1.208 0.896 0.298 28.52 17.47 34.82 Air volume, l 172.3 185.2 122.5 247.42 242.11 261.6 120.07 200.48 191.30 Polycarbonate
Quartz filter,
ø37mm
Airflow:
2 l/min
with
Au-coated
membrane,
ø 25mm
Air flow-2 l/m
EXPERIMENTAL The database created as a result of the records made for each fraction was populated with at least 50 values for each variable. The main statistical indicators for this variable were obtained by using a specialized software program.
The mean, dispersion and standard deviation, median and quartiles, skew- ness, and kurtosis were calculated for each of the four variables considered to define air quality in the vicinity of the workplaces, to highlight cases where action should be taken. Histograms and box plots were plotted for TSP, PM10, PM2.5, and PM.
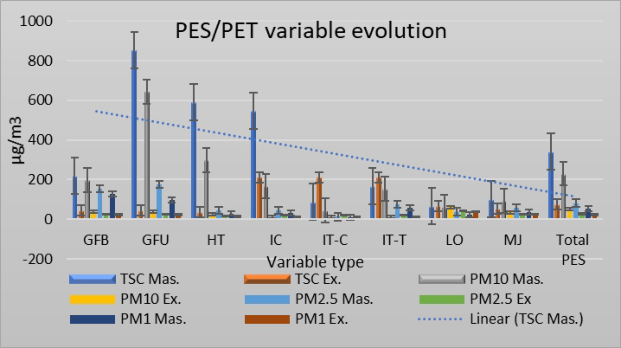
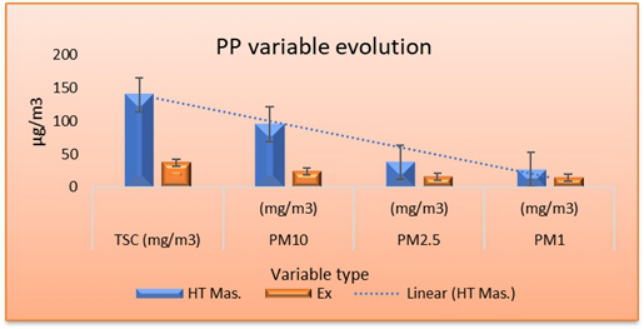
The comparative results (indoor/outdoor) for the companies processing PES/PET fibers are shown in Figure 3. The highest value of PES/PET parti- cle concentration was recorded inside the company processing recoverable PET materials (127.5 µg/m3); this value is about 4 times higher than the one recorded outside (36.7 µg/m3).
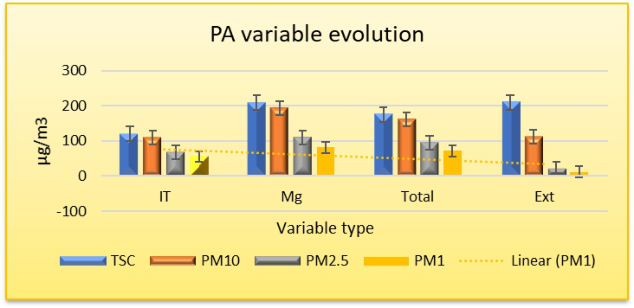
Figure 4 shows the comparative results (indoor/outdoor) for compa- nies processing PA fibers. In this case, the highest value of PM1 concen- tration of polyamide particles recorded in the vicinity of workplaces is 81.2 µg/m3 which is approx. 7 times higher compared to the outdoor value of 11.86 µg/m3. The average PM1 concentration recorded at the two com- panies is 71.57 µg/m3. The highest value of polyamide PM1 concentration recorded in the vicinity of the workplaces was obtained at MG company (81.2 µg/m3). The outdoor PM 1 value was 11.86 µg/m3. Figure 5 shows the comparative results (indoor/outdoor) for companies processing PP fibers. In this case, the concentration level of PP particles recorded inside the company is at 26.8 µg/m3 which is higher than that recorded outside by about 2 times, respectively 13.7 µg/m3. It can be seen that considering the concentration lev- els of the most dangerous particles for human health, namely PM1 (PES/PET, PA, and PP).
Methods for the Collection and Characterization of Airborne Particles 217
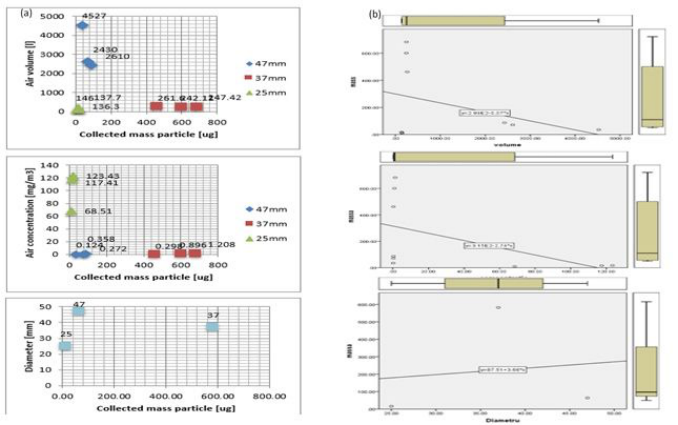
RESULTS AND DISCUSSIONS The correlation coefficient was calculated, by using the specific equation. There is a strong correlation between the variable: “Collected mass/ Air concentration”: r = 0997775 ÷ 0,999477 and “Collected mass/ Air vol- ume”, r = −0,97473 ÷ 0.80064 for all three diameters studied. A weak correlation is between collected mass (µg) and diameter of the filters (mm): r = 0,131679519. The real distribution of the data series (scatter) of the anal- ysed correlations is presented in Figure 6. The prediction of the value of the collected particle mass as a function of the diameter of the filters, particle concentration in the air, air flow of the pumps, and total air volume was made by plotting the regression curves and box-plot graphs and obtaining the regression equations.
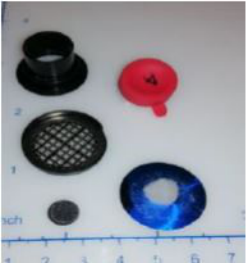
Two types of filter packaging systems were used to transport the filters to the ringing laboratories. System A consisted of the GILAIR PLUS pump holder into which the filters were inserted and transported after weighing (see Figure 7a). The system was used to collect and transport filters of quart
ø 37mm, nucleopore ø 25 mm, and Si ø 9mm diameter, used for the collection of PES, PA and PP particles.
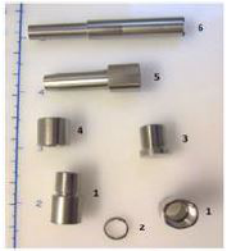
Figure 6: Correlations between air sampling parameters.Figure 7: a) Holder pump GilAir plus for system.Figure 7: b) Filtration components for system B.
Methods for the Collection and Characterization of Airborne Particles 219
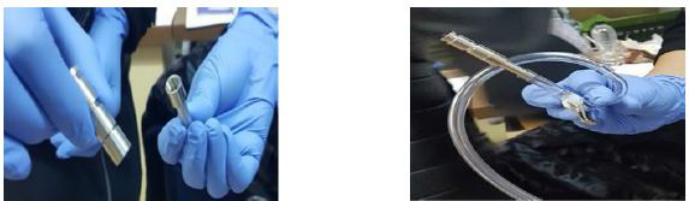
System B is a particle filtration system consisting of 1) a metal sample holder; 2) stainless steel O-Ring; 3) a graduation cup; 4) an end plug; 5) a tube adapter; 6) a multitool (see Figure 7b). This system was used for the collection and transport of PP particles collected on 9mm diameter Si filters.
Versa 3D scanning electron microscope from Termo Scientific (formerly FEI) was used for the analysis of the microparticles. The samples were not covered with metal or carbon. The acceleration voltage used was 4 kV with a spot size between 2 and 4 (samples), the current between 0,5 pA and 12 pA, and the WD distance used was 10mm. The nucleopore sample had a circular trace with an area of about 336 mm2. For the SEM analysis of the sample five different regions with a surface of 0.46 µm2 were selected on different parts of the sample.
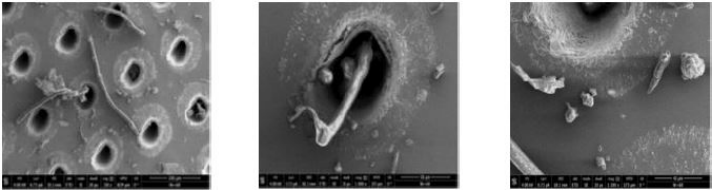
Figure 8 shows SEM images for PES particles. In the case of the A sys- tem of collection and transportation, very low concentrations of particles on filters were identified. A small number of particles (50) were counted. High-resolution image showing the fiber-like structure and small particles (with size below 10 microns) for all types of particles.
Figure 8: SEM images for PES/PET particles and microfibrils.
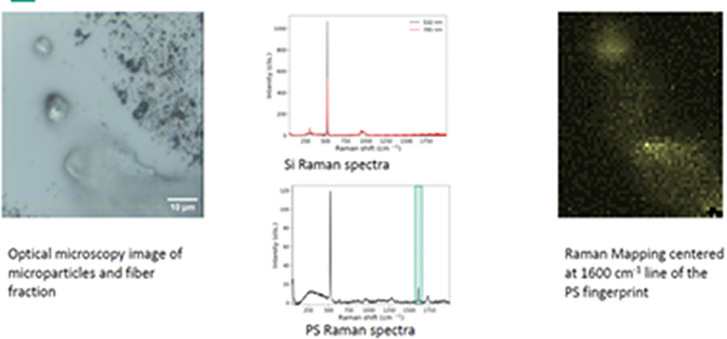
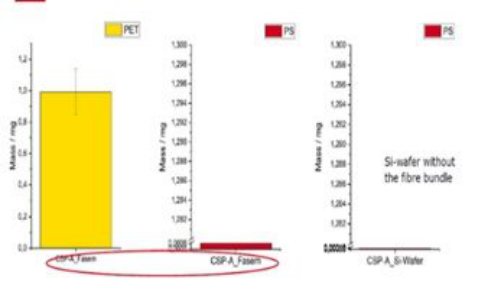
In the case of quartz filters, most particles would likely be deposited further inside the filter instead of on the surface, so any microscopical method will not work to determine concentrations. Particles and fibers were identified using µRaman spectroscopy: an optical microscope image of microparticles and fiber fraction of PES, Raman spectra of Si and Raman spectra of PES, Raman mapping centered on the 1600cm_1 line of the PES footprint, for PES particles collected and transported with system A are shown in Figure 9. Figure 10 shows the GS-MS spectra for the determination of the amount of PES particles.
GS-MS analyses showed us the presence of PET particles but also a small number of polystyrene particles. In the case of PP particles, a high quantity of PET particles was identified. For the PA particles, because of the low quantity of the particles, it wasn’t possible to provide GS-MS analyses. To improve the particle collection procedure, system B was designed and provided for the selective collection of PM10 and PM1 particles and their analysis. The system was coupled with the Gil Air Plus pump (see Figure 11) and applied for the collection of PP particles on 9mm Si filters and will be further applied for PES particles.
Figure 9: Optical microscope image and µRaman spectra (PES particles).Figure 10: GS-MS - PES particles.Figure 11: Mounting of system B.
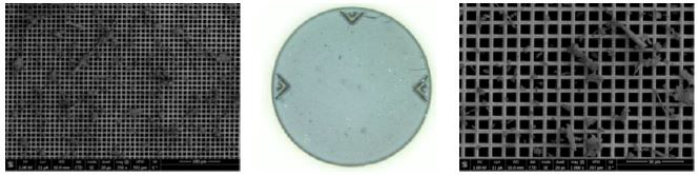
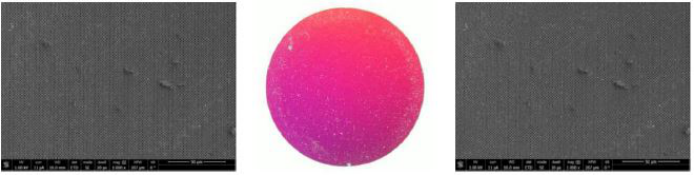
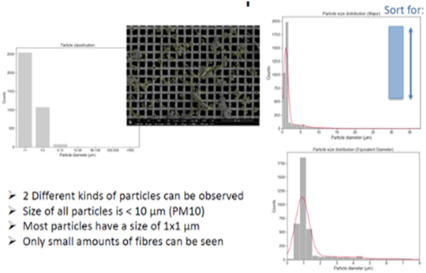
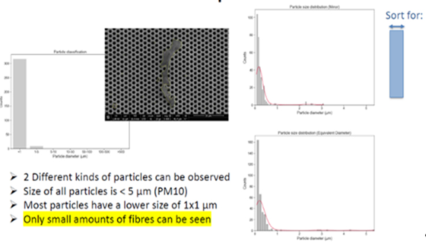
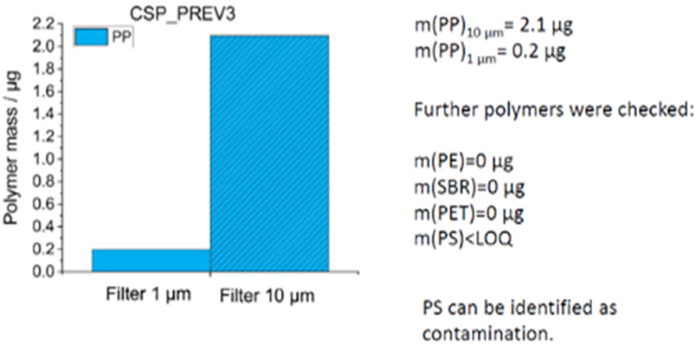
SEM images of PM10 and PM1 PP particles are shown in Figure 12 a, b. Both on the 10 µm and 1 µm pore size filter, different kind of particles and fibers can be detected all over the sample. As shown in Raman spectra for PM10 (see Figure 13a), and PM1 (see Figure 13b), the number of particles present on the 1 µm pore size filter is very low, compared with the particles presented on the 10 µm pore size filter.
Methods for the Collection and Characterization of Airborne Particles 221
Figure 12: a) SEM - PM10.Figure 12: b) SEM - PM1.Figure 13: a) Raman spectra for PM10.Figure 13: b) Raman spectra for PM1.
Figure 14 shows the GS-MS analyses for PM10 and PM1 which showed that the amount of 10 mm particles is about 10 times that of 1 µm particles. A small amount of polyester was also identified.
Figure 14: GS-MS for PM10 and PM1.
CONCLUSION
For all categories of PM1 concentrated particles determined inside the working rooms is higher compared to that determined outside.
Using system A, two issues were highlighted for collection and trans- port: quartz filters cannot be used for the analysis of particles collected by known methods; the amount of particles on the filters is insufficient for anal- ysis, either due to the collection parameters used or due to particle losses during transport.
Using system B for the collection and transport of Si filters, sufficient quan- tities of PP particles were obtained for SEM, Raman and GS-MS analyses. The system will be applied also to PES particles. Another system C for collection and transport will be applied for nucleopore filters. The GS-MS detection of foreign particles requires more careful cleaning of the workplaces and the air in the workrooms when changing batches of processed textile material (composition).
ACKNOWLEDGMENT
This research is carried out within the project: “Understanding exposure and toxicity of Micro- and Nano-Plastic contaminants in humans, POLYRISK” - Horizon 2020, Call: H2020-SC1-BHC-2018-2020” (Better Health and care, economic growth and sustainable health systems).
REFERENCES
Agay-Shay, K. et al., 2013. Air pollution and congenital heart defects. Environ. Res., Volume 124, pp. 28–34. Grimm Aerosol Technik, n.d. Optical spectrometer 11-E. [Online] Available
at: https://www.directindustry.com/prod/grimm-aerosol-technik/product-69071- 1571949.html Grosu, M. C. et al., 2023. Collection and Characterization of Synthetic Airborne Particles. Advanced Materials Letters, 14(1).
Methods for the Collection and Characterization of Airborne Particles 223
Klingelhofer, D., Braun, M., Quarcoo, D. & Brüggmann„ D., 2020. Research landscape of a global environmental challenge: Microplastics. Water Research, 170(115358), pp. 1–14. Qader, W., Dar, R. A. & Rashid, I., 2023. Phytolith particulate matter and its
potential human and environmental effects. Environmental Pollution, Volume 37, p. 121541. Schopel, B. & Stamminger, R., 2019. A comprehensive literature study on microfibres from washing machines. Tenside Surfactants Detergents, 56(2), pp. 94–104. Visileanu, E. et al., 2023. The Structural Influence of Airborne Particles on their
Toxicity. Advanced Materials Letters, 14(2), pp. 2302–1718. von Schneidemesser, E. et al., 2015. Chemistry and the Linkages between Air Quality and Climate Change. Chemical Reviews, 115(10), pp. 3856–3897.
LISTED IN THE AHFE DIGITAL BOOKSTORE CATALOGUE
Explore the complete digital volume
Human Systems Engineering and Design (IHSED 2023): Future Trends and Applications
Read this individual research paper free through the original publisher, or explore the full digital proceedings book.
ISBN 978-1-958651-88-9
Explore this ISBN in the AHFE Bookstore ↗Listed in the July 2026 bookstore catalogue; search by ISBN to confirm current availability · Digital book purchase optional