Marian-catalin Grosu, Ioan Hossu, Emilia Visileanu, Flori Breaban, Alexandra Gabriela Ene, Felicia Dondea (2024). Alternative methods for building energy preservation. In: Human Factors for Apparel and Textile Engineering. AHFE Open Access, vol. 134, pp. 1–9. https://doi.org/10.54941/ahfe1004909
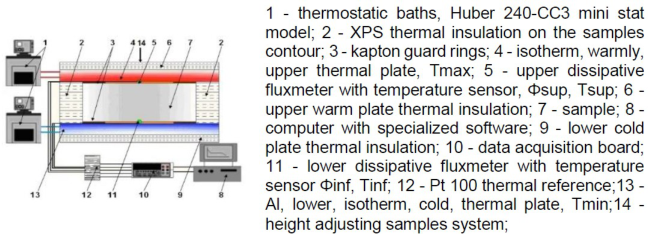
This article deals with aspects of the thermo-physical efficiency of coarse textile fibers arranged in the form of fibrous layers. The study is based on the need to improve the thermal protection of buildings in the context of sustainable development and to reduce the energy weight of buildings by reducing GHG emissions (H2O, CO2, CH4, CFC, N2O, etc.).At this stage, more and more products for construction are certified and analyzed in terms of embodied energy content and potential impact on the environment. In the current research, the tendency is to return to natural materials, with features similar to those of conventional materials in terms of performance.The advantage of exploiting a huge quantity of wool existing in Romania, currently unused, is the excellent wet-thermal and comfort properties of wool, concerning man and nature, 100% natural raw material, ecological and renewable, with a positive impact on man.By applying the technology specific to non-woven products, textile layers with layer density between 13 - 37 kg/m3 were made from wool with a fineness of 45-55 microns and a length of 150-220 mm. Measured characteristics (time-constant and spatially uniform heat flux) of the layers under different thermal conditions, respectively obtained from mathematical modeling and simulation were provided. Thermal measurements were performed with a complex lab device of the Laboratory of Civil and Environmental Engineering (LGCgE) of the University of Artois, IUT Bethune, France. The installation contains thermostatic baths, Huber 240-CC3, XPS thermal insulation on the samples contour, Kapton guard rings of 5 cm on the flux meters contour, Al, isotherm, warm, upper thermal plate, Tmax; upper dissipative flux meter with temperature sensor, Φsup, Tsup, upper warm plate thermal insulation; sample, computer with specialized software, lower cold plate thermal insulation, data acquisition board, lower dissipative fluxmeter with temperature sensor Φinf, Tinf, Pt 100 thermal reference, Al, lower, isotherm, cold, thermal plate, Tmin and a height adjusting samples system.To analyze the simultaneous influence of the independent parameters textile layer thickness (mm) and temperature (0C) on thermal parameters such as thermal resistance R - [m2K/W]; thermal conductivity λ - [W/(mK)] and the amount of heat stored in the sample Q - [J], an experimental design program using the rotating compound central factorial of order 2 was obtained.The designed matrix contains 13 sets of experimental combinations, 8 of which are distinct and 5 of which are the midpoint, and are made to determine the error value during the experiments. The experimental matrix contains the coded and actual values of X1 - textile layer thickness (mm) and X2 - temperature (0C) in 13 sets of experimental combinations in which the sample was measured. The empirical relationship between the independent process parameters and the obtained properties was obtained using the multiple regression technique. The interaction between the values of the independent variables X1 and X2 is presented as a polynomial equation of order 2, where the resulting value of Y depends on the interaction given by the polynomial equation at certain values of X1 and X2.Starting from the experimental data, the solutions provided by this specialized program led us to obtain models and simulations with very high accuracy. Technological limits and potential of the technology were materialized by correction coefficients (repeatable products under the same technological conditions, approximation of a technological, socio-economic optimum).By using this program, it is found that thermal resistance decreases with increasing layer density and hot plate temperature. The highest thermal resistance value of 2.77 m2 K/W was obtained at a density of 13 kg/m3 and a hot plate temperature of 400C. With increasing layer density (keeping the layer mass in g/m2 constant) the layer thickness decreases. Thus, the layer structure becomes more compact (the number of pores decreases, i.e. the amount of air in the structure decreases) causing the thermal resistance to decrease.
From the perspective of sustainable development, the combined global efforts to reduce energy consumption and pollutant emissions into the earth’s atmo- sphere require the promotion of research, development, and application of products with minimum negative effects. Products made from natural cel- lulosic (hemp, flax, wood) and protein (wool, flakes) fibers have thermal insulation properties close to those of established materials (mineral wool, glass wool, polystyrene (XPS -EPS)), but are nature-friendly (Hegyi et al., 2021). Among these, wool fibers are on an upward trend in use due to the
major stunning advantages such as: natural, renewable and sustainable char- acter, low embodied carbon, assure protection against moisture (Zabalza Bribián et al., 2011), (wool fiber absorbs the highest amount of water ∼30%), help control temperature, easy and safe in installation (has high resistance to compression due to its structure with crimps) (Lupu et al., 2013) is flame resistant (self-extinguishing character) (Hossu et al, 2015), thermal and sound insulation properties and lower price advantage (Hegyi et al., 2021). The energy savings that can be achieved in the construction sector, by insu- lating them are comparable to those of established materials with a strong environmental impact Corscadden et al., 2014), (Mansour et al., 2014. In the article, the results of mathematical modeling of the thermal characteris- tics of wool fiber nonwoven textile layers intended for thermal insulation of wall structures are analyzed. Thus, the contribution brought by these fibrous layers to thermal insulation is quantified, through two different aspects, namely: the increase of thermal and sound performance by wool textile layers (nonwovens) associated with concrete structures in the construction field.
MATERIALS AND METHODS
For the research, textile layers were made of nonwoven structure from coarse Romanian wool fibers, with a fineness of 45–55 microns and a length of 150–220 mm (Grosu et al., 2019). Following the thermal measurements made on the fibrous layer, under different temperature and density condi- tions, the values of the thermal parameters are within the limits of those obtained in the literature (Luc et al., 2012, Zach et al., 2012), and for a com- plete characterization of the influence of the structure of the layers on the thermal parameters, an experimental design was designed in a composite cen- tered program, in which the fibrous layer is analyzed taking into account two independent variables: density and temperature. The densities were obtained by ensuring the height of the samples, according to the parameters of the experimental plan, the samples having a surface imposed by the measuring installation of 25X25 cm. The measurement of the heat fluxes related to the test temperatures, according to NF EN 12667, and NF EN 12664, used an experimental installation from the Laboratory of Civil and Environmental Engineering (LGCgE) of Artois University, IUT, France (Wu, 2011) (Fig. 1).
Figure 1: The principle scheme of the experimental measuring installation and mea- sured parameters.
Alternative Methods for Building Energy Preservation 3
EXPERIMENTAL Rotating Composite Centred Factor Program of Order II (RCFP II)
To follow and interpret the simultaneous influence of the independent parameters textile layer density (kg/m3) and temperature (
C) on the ther- mal parameters thermal resistance R - [m2 K/W]; thermal conductivity λ - [W/(mK)]; and the amount of heat stored in the sample Q - [J], samples were made and measured according to an experimental design using RCFP II. The limits of the ranges of the two variables, the true values and the coded values (see Table 1).
Table 1. Correspondence of independent parameters with true values.
Table available in the original PDF paper.
Independent Variables Levels of Variation coded values −1,414 −1 0 1 1,414 U.M. x_1 - layer density (real values) 13 17 25 33 37 kg/m3 x_2 - hot plate temperature 20 26 40 54 60
C
The designed matrix contains 13 sets of experimental combinations, 8 of which are distinct and 5 of which are the midpoint, and are made to determine the error value during the experiments. The empirical relationship between the independent process parameters and the obtained properties was obtained using the multiple regression technique. The interaction between the values of variables x1 and x2 is presented as a polynomial equation of order 2, Y = b0 + b1x1 + b2x2 + b11x2 1 + b22x2 2 + b12x1x2 (1)
where Y is the dependent variable, b0 is the regression constant, b1 ¸si b2 are the coefficients of the independent variables, b12 is the interaction coefficient of the independent variables, and b11 and b22 are the quadratic coefficients of the independent variables. The models obtained are based on the coded values of the independent variables, e.g. the minimum and maximum values of the range of the two variables x_1 and x_2 are denoted by −1.414 and 1.414. Thus the resulting value of Y depends on the interaction given by the polynomial equation at certain values of x1 and x2. In this case, Y successively represents R, λ, and Q (Table 2).
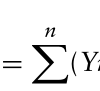
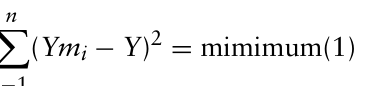
EXPERIMENTAL To establish the dependence relationship between the values of Y on the inde- pendent variables x_1 and x_2, a multiple regression analysis of the form of relation 1 was performed. The determination of the coefficients of the regression equation was carried out by the method of least squares minimiz- ing the sum of the squares of the deviations of the calculated values from the measured ones, expressed by the relation 1.
Equation reproduced from the original PDF.Equation reproduced from the original PDF.
Where: Ymi - measured values of the dependent variable under analysis; Y- experimental values of the dependent variable The coefficients of the polynomial equation of order 2 determine the values of a predictable response Y1 −3 and are presented in Table 3.
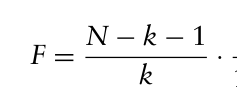
They can have both positive and negative values that influence the exper- imental results. The significance check of the coefficients of the multiple regression equation was done using the Fisher Snedecor (F-ratio) test which is defined as follows (Serbulescu et al., 2002):
Equation reproduced from the original PDF.
(2)
k · R2
Y·x1x2 1 −R2 Y−x1x2
Alternative Methods for Building Energy Preservation 5
Where: n is the number of experiments in the experimental matrix (sample volume), k is the number of independent variables, and R2 is the multiple correlation coefficient.
The F-ratio is calculated for a 95% confidence level and two degrees of freedom (f1=2, f2=10 respectively) and then compared with the corre- sponding tabulated value. When the calculated F-ratios value exceeds the corresponding tabulated value it means that the independent variables have a significant influence on the dependent variable. The tabulated F-ratio value for a 95% confidence level is 4.1. The values of the multiple correlation R2 coefficients (Table 3) between the experimental values and the calculated values illustrate a significant correlation.
The R2 multiple correlation coefficients and F values, together with the polynomial equation obtained after testing the significance of the coefficients by applying the Student’s test are presented in Table 4.
Table 4. Checking the significance of the coefficients of the regression equations Y1, Y2 and Y3.
Table available in the original PDF paper.
Coefficient (C) and Its Signification (S or N) Student Test Value (T) C Y1 Y2 Y3 T Y1 Y2 Y3
b0 1,744 (S) 0,046 (S) 39,285 (S) Tb0 55,232 59,661 38,514 b1 −0,443 (S) −0,006 (S) −3,770 (S) Tb1 −17,759 −10,379 −4,675 b2 −0,074 (S) 0,002 (S) 31,205 (S) Tb2 −2,960 2,658 38,697 b11 0,204 (S) 0,000 (N) 1,476 (N) Tb11 7,636 −0,168 1,706 b22 0,027 (N) −0,001 (N) 4,635 (S) Tb22 1,021 −1,066 5,359 b12 −0,078 (S) 0,002 (S) −5,890 (S) Tb12 −2,219 2,222 −5,165 S – with significative influence on Y; N- with non significative influence on Y
Y1 - Effect of Layer Density and Hot Plate Temperature on R Analysis of the mathematical model described by equation Y1 of the thermal resistance - R [m2 K/W] in the experimental matrix (Table 2) indicates that x_1 - thickness of the textile layer (mm) and x_2 - temperature (
C) have a strong influence on the characteristics described by the equation. The coef- ficients of the linear part, of degree I, have the same sign (negative) which means that x_1 and x_2 exert an indirect influence and the same effect on the thermal resistance.
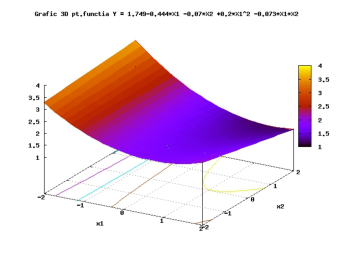
Thus, obtaining a non-woven textile with a higher or lower thermal resis- tance value must take into account both the layer density and the temperature difference to which the material is subjected. Figure 2a indicates that the response surface of the regression obtained is a quadric, as hyperboloid type, without critical point in the set range. x_1’s direct (b11>0) and significant influence on Y1’s is given by and interaction of the two independent vari- ables x_1 and x_1 through the mixed term. The negative sign (b12<0) shows an indirect influence, i.e. a tendency for Y1 to decrease when x_1 and x_2 act together. The effect of x_1 and x_2 on Y1 is shown in Figure 2.
Figure 2: a) Quadric surface b) 2D surface response.
From the graph it can be seen that the thermal resistance Y1 decreases with increasing x_1 and x_2. The highest value of thermal resistance of 2.77 m2 K/ W was obtained at a density of 13 kg/m3 and a hot plate temper- ature of 40
C. With increasing layer density (keeping the layer mass - g/m2 constant) the layer thickness decreases. Thus, the layer structure becomes more compact (the number of pores decreases, i.e. the amount of air in the structure decreases) causing the thermal resistance to decrease. Figure 2b shows a more prominent decrease in thermal resistance at the same temper- ature (x_2 = 40
C) with increasing layer density. Also a decrease in thermal resistance, but not significant, is recorded with increasing temperature, when the layer density is kept constant (x_1 =25 kg/m3). The temperature of the hot plate probably cannot significantly change the amount of air in the structure, as air is a good thermal insulator.
Y2 - Effect of Layer Density and Hot Plate Temperature on λ The equation Y2 of thermal conductivity - λ in the experiment matrix (Table 2) indicates that the layer density x_1 and hot plate temperature x_2 exert less influence on the characteristic Y2 - thermal conductivity λ, than in the case of Y1. Moreover, the coefficients of the degree 1 terms have different meanings, indicating the inverse influence on λ (see Table 5).
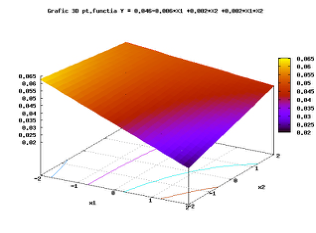
Thus, obtaining a non-woven textile material from wool fibres with the lowest value of thermal conductivity is positively influenced with decreasing layer density and increasing temperature to which the material is subjected. Figure 3a indicates that the obtained regression response surface is of the quadric hyperboloid type with no critical point in the range. The choice of the direction of variation in the exprimental domain depends on the intended purpose in practical applications. The lack of 2nd degree terms leads to a not very well defined response surface in the exprimental domain. The interac- tion x_1 and x_2, through the presence of the mixed term, has a significant influence on the thermal conductivity. The positive sign of the mixed term (b12>0) leads to a direct influence, i.e. a tendency for the thermal conductiv- ity to increase with the cumulative action of x_1 and x_2. The effect of x_1 and x_2 on Y2 is shown in Figure 3b.
Alternative Methods for Building Energy Preservation 7
Figure 3: a) Quadric surface b) 2D surface response.
Analyzing the response surface (see Figure 3a), it is found that λ decreases with increasing layer density and decreasing temperature. The lowest λ value of 0.036 W/(mK) was obtained at a density of 37 kg/m3 and a temperature of 40
C.
At a constant hot plate temperature (x_2 =40
C), a significant decrease in thermal conductivity with increasing layer density is observed. In contrast at a constant layer density (x_1 =25 kg/m3), the thermal conductivity increases insignificantly in the experimental range (Figure 3b). A low value of thermal conductivity implies a high value of thermal insulation capacity.
Y3 - Effect of Layer Density and Hot Plate Temperature on Q Equation Y3 of the amount of heat stored in the sample Q [J] in the experi- ment matrix (Table 2) indicates that x_1 - density of the textile layer (kg/m3) has a much lower and negative influence than x_2 - temperature (
C) on the characteristics described by the equation.
The hot plate temperature x_2 directly (b22>0) and significantly influences the thermal resistance by the presence of the second degree term.
A significant influence on Y3 is given by and interaction of the two inde- pendent variables x_1 and x_2 through the mixed term. The negative sign (b12<0) (see Table 5) shows an indirect influence, i.e. a tendency for the amount of heat stored in the sample to decrease when the two independent variables x_1 and x_2 act together.
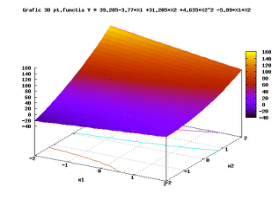
Figure 4: a) Quadric surface b) 2D surface response.
Thus, obtaining a wool textile non-woven designed for insulation with a higher value of heat stored in the sample depends primarily on the higher temperature difference to which the material is subjected and the decrease in the density of the layer. Figure 4a indicates that the regression response surface obtained is a quadric surface of hyperboloid type with no critical point in the range.
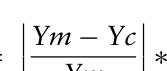
By checking the agreement of the mathematical model with the real process it is observed that the values of the difference between the real indepen- dent values (obtained from the 13 experiments) and the independent values calculated by the numerical modelling program, using relation 3:
Equation reproduced from the original PDF.
∗100 (3) Where Ym- average value of YR. If the percentage differences are less than 10%, then the mathematical model is considered to be adequate, and when this value is exceeded, the influence of other factors leading to the actual values of Y, which were not considered in the experimental measurements, is considered to be present.
Table 5. Checking the consistency of the mathematical model with the real process.
The work focused on the analysis of the influence of some technological parameters of different textile wool fibre layers, in the form of unwoven tex- tile structure (x_1: density of the textile layer - kg/m3) and (x_2: measuring temperature
C) on some very important parameters that are worked with in the field of thermal insulation, namely Y1 - thermal resistance R - [m2 K/W],
Alternative Methods for Building Energy Preservation 9
Y2 - thermal conductivity λ - [W/(mK)] and Y3 - the amount of heat stored in the sample Q - [J]. For this purpose, a 2nd order factorial design was used using a mathematical modelling software of an experimental matrix with 13 experiments representing the technological margins subject to measurements.
It was found that the influence of the dependent parameters x_1 and x_2 on Y is different, for the particular cases thermal resistance, thermal con- ductivity and the amount of heat stored in the nonwoven wool textiles. The difference more than 10 percent, sign that in the real situation, the other additional factors influence the results.
ACKNOWLEDGMENT
The publishing of this research has been funded by the Ministry of Research and Innovation, by Program 1 – Development of the national system for R&D, Subprogram 1.2 – Institutional Performance – projects for funding excellence in R&D&I, contract no. 4PFE/30.12.2021.
REFERENCES
Andreea Hegyi, Carmen Dico, Henriette Szilagyi, (2020). Sheep Wool Thermal Insulating Mattresses Behaviour in the Water Vapours Presence, Procedia Man- ufacturing, Volume 46, pp. 410–417, ISSN 2351–9789, https://doi.org/10.1016/j. promfg.2020.03.060. Grosu M. C., Alexan A., (2019) Non-conventional textile structures with technical
destination, designed and developed at S. C. Cora Trading & Service S. R. L., Industria Textila, vol. 70, nr. 1, doi: 10.35530/IT.070.01.1611. Hegyi, A.; Bulacu, C.; Szilagyi, H.; L˘az˘arescu, A.-V.; Mei¸t˘a, V.; Vizureanu, P.; Sandu, M. (2021). Improving Indoor Air Quality by Using Sheep Wool Thermal Insulation. Materials, 14, 2443. https://doi.org/10.3390/ma14092443 Hossu I., Grosu M. C., Horga G., Avram D., Breaban F., Industria Textila, 2015,
66(1), pp. 48–54. K. W. Corscadden, J. N. Biggs, D. K. Stiles, (2014). Sheep’s wool insulation: A sustainable alternative use for a renewable resource?, Resources, Conservation and Recycling, Volume 86, pp. 9–15, ISSN 0921-3449, https://doi.org/10.1016/j.resc onrec.2014.01.004. Lupu I. G., Cramariuc O., Hogas H. I., Hristian L., (2013). Journal of The Textile
Institute, 104(10): pp. 1125–1131. ¸Serbulescu L., Ciocoiu M., “Optimizarea tehnologiilor de prelucrare a firelor”, Ed.
Performantica, ISBN 973-8075-23-8, Ia¸si, 2002. Mansour E., Loxton C., Elias R. M., Ormondroyd G. A (2014). Environment International, 73, pp. 402–412. Wu, T., (2011) Formalisme des impedances thermiques generalisees. application a
la caracterisation thermique de parois de batiments, in Génie Civil, Université d’Artois: Béthune; FR. p. 217. Zabalza Bribián I., Valero Capilla A., Aranda Usón A., (2011_ Building and Environment. 46(5): pp. 1133–1140. Zach, J., et al., (2012) Performance evaluation and research of alternative thermal
insulations based on sheep wool. Energy and Buildings. 49: p. 8.
LISTED IN THE AHFE DIGITAL BOOKSTORE CATALOGUE
Explore the complete digital volume
Human Factors for Apparel and Textile Engineering
Read this individual research paper free through the original publisher, or explore the full digital proceedings book.
ISBN 978-1-964867-10-6
Explore this ISBN in the AHFE Bookstore ↗Listed in the July 2026 bookstore catalogue; search by ISBN to confirm current availability · Digital book purchase optional