Chunzhu Mi, Xiaojun Liu (2023). Visual variable perception in time series dynamic visualization. In: Usability and User Experience. AHFE Open Access, vol. 110, pp. 209–217. https://doi.org/10.54941/ahfe1003193
Visualization facilitates understanding by encoding large amounts of complex information into intuitive formats such as graphics and images. In the design of dynamic visualization of time series, visual coding is more important, because a large number of complex and high-dimensional data will follow over time, but users may not be able to process and filter them in time and effectively. The paper evaluates the cognitive load and performance of users under two time pressures of eight different dynamic visual variables through experiments, so as to allocate more significant coding methods to higher priority information and improve the efficiency of information acquisition. The results show that there are significant differences in cognitive load when using different visual variables, and the cognitive load is lower when using angle, symbol number and area coding. However, there is no significant difference in user performance. There was no significant difference in cognitive load between the two time pressure states, but there was significant difference in accuracy. The accuracy under low time pressure is significantly higher than that under high time pressure.
With the rapid development and convergence of Internet of Things, cloud computing, VR/AR, 5G, blockchain, artificial intelligence and other techno- logies, big data information has exploded. In the field of big data visualiza- tion, an important direction of research is to deal with time-related big data (Lu et al., 2020, Rufiange and McGuffin, 2013), which changes with time. However, the rapid change of data and the massive increase of data volume are in contradiction with spatial limitations. The use of static visualization to convey each attribute may lead to information oversaturation and visual confusion, so the visual presentation extends to the dynamic range. Dynamic visualization is usually used to represent the change and movement of objects and relationships, and to present the evolution of data in an expressive way (Brucker et al., 2014). For example, in the big data visualization board, data is refreshed over time to help users master real-time status and change trends.
According to the information processing theory proposed by Wickens (1984), when people perceive information through vision, the visual sensory organs first receive external stimuli, including static visual information and motion state. All kinds of information then enter the first module of informa- tion processing, namely sensory memory. Sensory memory capacity is large,
but storage time is short (Cooper, 1998). During this time, the meaning of new information must be quickly identified, classified, and assigned, or it will disappear forever. However, in the dynamic visualization of time series, the data is refreshed with time, and a large number of complex and high- dimensional data come one after another with the passage of time, so users may not be able to process and filter timely and effectively. Therefore, in dynamic visualization design, visual form coding is particularly important, and it is necessary to match the visual form with the information priority level to help users quickly obtain important information.
In dynamic visualization pages, motion is highly significant to human vision, even more sensitive than changes in color, texture, etc. (Lu et al., 2022). Bartram and Ware (2002), also showed that motion coding can be used as a visual coding property alone and does not interfere with existing visual channels such as color and shape coding. Previous studies on dynamic visualization have evaluated the perceptual accuracy of visual coding such as length, orientation, size, color, and frame rate (Dong et al., 2012, Esmaeili et al., 2022, Huber and Healey, 2005, Romat et al., 2018). However, few stu- dies have considered the changes of cognitive load when using different visual variables, and the impact of time pressure on load and performance. Accor- ding to the cognitive load theory, time pressure indirectly changes people ‘s working memory capacity and can limit people’ s cognition by affecting peo- ple ‘s emotions (Barrouillet et al., 2004). Therefore, this paper will study the cognitive load and performance of color (lightness, purity), size (area, height, length), angle, symbol number and character under low time pressure and high time pressure. Cognitive load was measured by NASA-TLX subjective questionnaire. Cognitive performance is measured by accuracy. The effecti- veness and efficiency of visual coding methods are ranked by examining the cognitive load and performance of users, so as to assist designers to complete more efficient visual coding when performing visual design on dynamic data.
PARTICIPANTS A total of 20 participants were enrolled in this study. There were 12 boys and 8 girls, and their ages ranged from 22 to 27 years (M = 24.61, SD = 1.57). They are all graduate students. All the subjects had normal vision and no achromatopsia.
STIMULI The experiment evaluated the effectiveness of eight visual variables in per- forming visual search task under two time pressures. The within-subject design was used in the experiment. The dependent variables were NASA-TLX subjective cognitive load score and accuracy.
In this experiment, eight visual variables are selected, which are brightness, purity, area, height, length, angle, symbol number and character, because these visual coding methods are widely used in visual scenes and can express quantitative changes of numerical values. In order to ensure the consiste- ncy of the changes in each experimental material, the experimental material
Visual Variable Perception in Time Series Dynamic Visualization 211
must be designed and processed. The material presents six graphic chan- ges, because the maximum number of elements that people can remember in short-term memory is 7±2. The experiment starts with six identical elements, and changes in each attribute over time, with a 10% gradient.
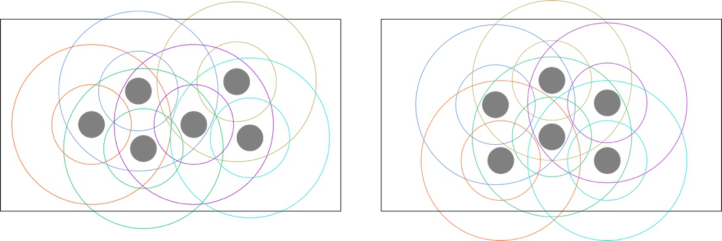
In order to avoid the interference of position effect on the experimental results, the experimental material elements will adopt a method similar to Poisson disk to realize position randomization and ensure that the distance between each element satisfies certain constraints. First, a circular element is generated with a certain point as the center of the circle, the radius is 50px, the minimum distance is designed to be 150px, and the maximum distance is 600px. Then, the sampling is carried out in the ring of 300-600px with this circular element as the center of the circle, which is the position of the next element. By this interpolation, a total of 5 samples were taken. The element position distribution in some experimental materials is shown in Figure 1, and it can be seen that the sampling range is in each color ring.
Figure 1: Example of element position distribution.
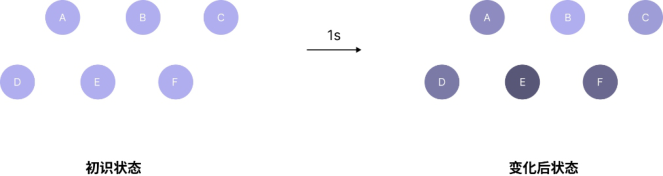
The experimental stimulus type is animation, which is made by Adobe Animate. It is set to 30 frames per second according to the smoothness. It takes 1 second to change from the original state to the final state after attri- bute change. The time pressure is controlled by the playback time. The more the playback time, the more times the animation can be repeated. There are two levels of time pressure: low time pressure and high time pressure. A pilot experiment was conducted before the experiment. Five subjects were invited to complete the experiment tasks at five time levels, namely 1s, 2s, 3s, 4s and 5s. Taking the accuracy rate higher than 80% as the low time pressure, combined with the subjective feelings of the subjects as a reference, the final playback time of the low time pressure group was 2s (2 times), and the play- back time of the high time pressure group was 4s (4 times). When the visual variable is brightness, the brightness of the elements in the figure changes, and each element is marked with capital letters, as shown in Figure 2.
PROCEDURE The experiment process is divided into four parts, including collecting per- sonal information, practicing experiment, formal experiment and filling in subjective load questionnaire. First, collect personal information and ask the
212 Mi and Liu
Figure 2: Schematic diagram of dynamic brightness change.
subjects to fill in their name, gender, age, profession and vision. Then explain the purpose of the experiment, the content of the experiment and the spe- cific operation methods to the user, and the subjects begin to practice the experiment after understanding.
In the formal experiment, they were divided into low pressure group and high pressure group. The subjects actively choose which group to complete first to ensure the randomness of the sequence. First, the guide is presented in the center of the screen for an unlimited time. After the subjects have read and understood it, they press the space bar to enter the experiment. Then pre- sent a group of experimental stimuli for 2s/4s, and automatically enter the judgment page when the time is up. The subjects are required to select the ele- ment with the largest change in the previous material, select the answer with the mouse, and click the “Finished” button to enter the next group of experi- ments. At this time, a 500ms “+” sign is displayed in the center of the display screen to eliminate the visual residue of the subject, and then the next group of animation materials are displayed. The low pressure group and the high pressure group completed 16 tests respectively, and the participants comple- ted a total of 16x2=32 attempts. After completing a group, participants were asked to fill in the NASA-TLX Subjective Cognitive Load Questionnaire to assess the psychological load of completing the task. The time for filling in the questionnaire is unlimited, and users can take a rest during this period.
RESULTS
Cognitive Load First, the normal distribution test of cognitive load was carried out in SPSS software. After Shapiro-Wilk test, the P value of significance was 0.091, and the level was not significant, so the data met the normal distribution. Then the data were tested for homogeneity of variance, and the samples of different visual variables showed no significant difference in cognitive load (p = 0.301>0.05), and the samples of different time pressure showed no signi- ficant difference in cognitive load (p = 0.678>0.05), so the data could be analysed for variance. Since both visual variables and time pressure are cate- gorical factors, two-factor analysis of variance will be used to analyse the impact of visual variables and time pressure on cognitive load. The analysis results are shown in Table 1.
Visual Variable Perception in Time Series Dynamic Visualization 213
Table 1. Analysis of variance of the impact of various factors on cognitive load.
Table available in the original PDF paper.
df MS F Sig.
Source Type III sums of squares
.371 7 .053 66.196 .094
Corrected Model 5.010 15 .334 417.529 .038 Intercept 391.510 1 391.510 489387.903 .001 Variable type 4.755 7 .679 849.054 .026* Time pressure .015 1 .015 18.581 .145 Variable type * Time pressure Error .001 1 .001 Total 411.028 17 Total after Correction 5.011 16
a. R-squared =.1.000(Adjusted R-squared =.997)
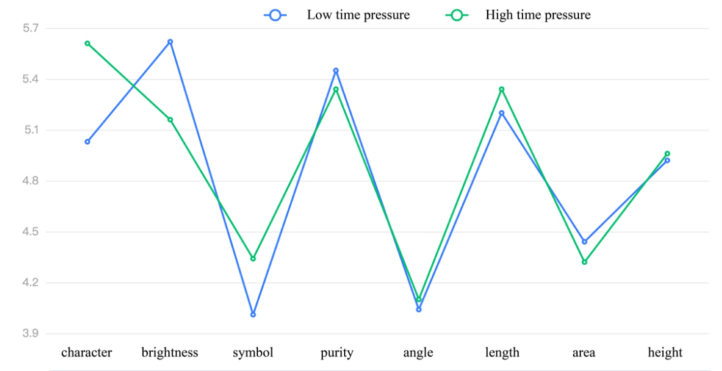
For the type of visual variables, the analysis of the results of the F-test shows that different types of variables have a significant impact on the results (p = 0.026<0.05), and there is a main effect. The effect of different time stress on cognitive load was not statistically significant (p = 0.145>0.05). The interaction effect of variable type and time pressure was not significant (p = 0.094>0.05). The comparison of the average cognitive load of parti- cipants in various visual variable types under different time stress levels is shown in Figure 3.
It can be seen from Figure 3 that the cognitive load of subjects under low time pressure and high time pressure is not different, which is con- sistent with the results of ANOVA. When subjects encode visual variables from angle, the cognitive load is the smallest, and the cognitive load is the largest when they encode visual variables from purity. The cognitive load from small to large is: angle<number of symbols<area<height<length< character<brightness<purity.
Figure 3: Comparison of cognitive load mean.
214 Mi and Liu
Since visual variables have a significant impact on cognitive load through analysis of variance, LSD method is further used to analyse the specific diffe- rences between variables. The results of multiple post-mortem comparisons showed that the cognitive load of users was lower when using angle, symbol and area coding. The cognitive load is higher when using height, length, cha- racter, lightness and purity. There was no significant difference in the angle, symbol and area of the lower group, and there was no significant difference in the height, length, text, brightness and purity of the higher group.
Correct Rate The Shapiro-Wilk test showed that the accuracy level was not significant (p = 0.196>0.05), and the data satisfied the normal distribution. Fluctu- ation of data was tested using homogeneity of variance, and the results showed that different visual variables (p = 0.007<0.05) and time pressure (p = 0.006<0.05) were significant, which did not meet the premise require- ments of analysis of variance. Therefore, non-parametric test will be used for difference study in the following. Since there were more than two groups of visual variable types, the Kruskal-Wallis test statistic was used for analysis and the results are shown in Table 2.
It can be seen from Table 2 that the test result of the sample is “keep the original hypothesis”, that is, different visual variables have no signi- ficant impact on the accuracy rate (p = 0.801>0.05). From the accu- racy distribution of various visual variables, we can see that the accu- racy distribution of length, area, character and symbol variables is rela- tively concentrated, and the accuracy of height and purity vary greatly. The correct rate of different visual variables is sorted as area>number of symbols>angle>character=length>purity>lightness>height from the largest to the smallest. The character and length are equal, but the length distribution is more concentrated.
Time pressure is composed of two groups (low pressure and high pres- sure), so MannWhitney test statistics are used for analysis. The test results are shown in Table 3. Different time pressures have significant effects on the correct rate (p = 0.007<0.05), that is, different time pressure samples have different effects on the correct rate.
Table 2. Effect of visual variables on accuracy non-parametric test results.
Table available in the original PDF paper.
Independent samples Kruskal-Wallis test
Null Hypothesis Test Sig. Decision 1 The distribution of accuracy is the same across categories of variable types.
.801 Retain the null hypothesis.
Table 3. Effect of time pressure on accuracy Non-parameter test results.
Table available in the original PDF paper.
.007* Reject the null
Independent sample Mann-Whitney U test
hypothesis.
Null Hypothesis Test Sig. Decision 1 The distribution of accuracy is the same across categories of time pressure groups.
Visual Variable Perception in Time Series Dynamic Visualization 215
By analyzing the frequency distribution of the two groups of data, it can be seen that the correct rate of users under low time pressure is more concen- trated in the correct rate of more than 75%. The specific comparison of the median difference shows that the median of low time pressure group (0.915) is significantly higher than that of high pressure group (0.665).
DISCUSSION
Through the analysis of the results of cognitive load, it can be concluded that different types of visual variables have significant effects on cognitive load. Previous studies (Taieb-Maimon et al., 2022, Kim and Heer, 2018) have shown that area is a very effective visual coding method, and Mackin- lay (1986) believes that area, length and angle are the most significant when representing quantitative data, probably because angle and area are more visually prominent in visual tasks, so users feel less cognitive load. The num- ber of symbols is used less in previous studies, but it is widely used in daily design. The experimental results show that the number of symbols brings no significant difference in cognitive load with angle and area, which is in low cognitive load, so it is also an effective coding method. Height, length, character, brightness and purity make users in a high cognitive load state, indicating that some coding methods that are easy to use in static state are not necessarily applicable in dynamic state.
According to the analysis of the accuracy results of the experimental tasks, different visual coding methods have no significant effect on the accuracy, which is inconsistent with the conclusions drawn by some previous stu- dies. For example, Sara et al. (2023) concluded that area change is more efficient than vertical linear change through two control experiments, and Taieb-Maimon et al. (2022) concluded that for quantitative data, the ave- rage accuracy of position and table visualization is significantly higher than that of area and color saturation through outlier detection task. While area is more significant than color. This may be because the tasks in the experiment were too simple to cause a significant difference in accuracy.
The results of cognitive load measured by controlling time stress showed that time stress did not significantly affect the cognitive load of participants. However, based on the cognitive load theory, the greater the time load, the more effort and attention users need to put in, resulting in a high intensity of cognitive load due to panic and anxiety. The reason why the results contradict the theory may be that the setting of time pressure in the experiment is not enough to make the participants feel the difference of cognitive load subje- ctively, or the experimental task is too simple, which takes up little cognitive resources of users, and it is difficult to wake up the cognitive load of users.
The correct rate of users under low time pressure is obviously higher than that under high time pressure. It may be that the increase of time pressure will lead to the user not being able to capture enough information in time, and the unnoticed information will not be processed in visual working memory. Low time pressure allows users to construct more localized mental representations, which can then be integrated into a coherent mental model (de Koning et al., 2011).
216 Mi and Liu
Based on the analysis and discussion of the above results, it is suggested that the angle, symbol number and area with lower cognitive load should be used preferentially in the design scene. Because there is no significant diffe- rence in the correct rate in the experiment, it may be because the task and experimental material setting are relatively simple, while the reality is more high-dimensional complex data. There is no significant difference in cognitive load between the two time pressure states, but there is significant difference in correct rate, and the correct rate under low time pressure is significantly higher than that under high time pressure, indicating that although subjective time difference brings less cognitive load to users, it may lead to a significant decline in performance. Therefore, in the design of time series dynamic data visualization, enough time should be reserved for users to obtain informa- tion, so as to avoid important information not being able to enter working memory for processing to make decisions and cause anxiety.
CONCLUSION
In terms of the above analysis and discussion of the experimental results, the following conclusions can be drawn: (1) Different visual variables have significant effects on cognitive load. The cognitive load of angle, symbol and area was significantly lower than that of height, length, character, brightness and purity. There were no significant differences in angle, symbol and area, and no significant differences in hei- ght, length, character, lightness and purity. Different visual variables had no significant effect on perceptual efficiency.
(2) Under different time pressure, there is no significant difference in cognitive load, but there is significant difference in cognitive efficiency. The cognitive efficiency of low time pressure is significantly higher than that of high time pressure.
LIMITATIONS Although the study has drawn some conclusions, there are some limitations. First of all, it may be that some of the experimental results are not statisti- cally significant because the task is too simple, and future research can choose deeper cognitive tasks, such as “estimating specific values” and “comparing change numerical multiples”. In addition, in order to avoid the bias caused by location effect, all visual variables were distributed in Poisson disk to inve- stigate the difference of cognitive load and cognitive performance caused by visual variables themselves. However, in real-world design scenarios, desi- gners overlay positional dimensions to help users quickly identify, such as height coding, which often aligns the bottom of elements. Therefore, when using the high-load visual variables measured in the experiment, we can use the design of superimposing other dimensions to help users reduce the load and improve cognitive performance.
Visual Variable Perception in Time Series Dynamic Visualization 217
REFERENCES
Barrouillet, P., Bernardin, S. & Camos, V. 2004. Time constraints and resource sharing in adults’ working memory spans. Journal of Experimental Psychology. General, 133, 83–100. Bartram, L. & Ware, C. 2002. Filtering and Brushing with Motion. Information
Visualization, 1, 66–79. Brucker, B., Scheiter, K. & Gerjets, P. 2014. Learning with dynamic and static visualizations: Realistic details only benefit learners with high visuospatial abilities. Computers in Human Behavior, 36, 330–339. Cooper, G. 1998. Research into cognitive load theory and instructional design.
Retrieved August, 1–33. de Koning, B. B., Tabbers, H. K., Rikers, R. & Paas, F. 2011. Attention cueing in an instructional animation: The role of presentation speed. Computers in Human Behavior, 27, 41–45. Dong, W. H., Ran, J. & Wang, J. 2012. Effectiveness and Efficiency of Map Symbols
for Dynamic Geographic Information Visualization. Cartography and Geographic Information Science, 39, 98–106. Esmaeili, S., Kabir, S., Colas, A. M., Linder, R. P. & Ragan, E. D. 2022. Evaluating Graphical Perception of Visual Motion for Quantitative Data Encoding. IEEE transactions on visualization and computer graphics. Huber, D. E. & Healey, C. G. Visualizing data with motion. Visualization, Vis 05
IEEE, 2005 2005. 527–534. Kim, Y. & Heer, J. 2018. Assessing Effects of Task and Data Distribution on the Effectiveness of Visual Encodings. Computer Graphics Forum, 37, 157–167. Lu, J. H., Wang, J., Ye, H., Gu, Y. H., Ding, Z. Y., Xu, M. L. & Chen, W. 2020. Illu-
strating Changes in Time-Series Data With Data Video. IEEE Computer Graphics and Applications, 40, 18–31. Lu, M., Fish, N., Wang, S. Q., Lanir, J., Cohen-Or, D. & Huang, H. 2022. Enhancing Static Charts With Data-Driven Animations. IEEE Transactions on Visualization and Computer Graphics, 28, 2628–2640. Mackinlay, J. 1986. Automating the design of graphical presentations of relational
information. Acm Transactions on Graphics, 5, 110–141. Romat, H., Appert, C., Bach, B., Henry-Riche, N., Pietriga, E. & Acm. 2018. Animated Edge Textures in Node-Link Diagrams: a Design Space and Initial Evaluation. CHI Conference on Human Factors in Computing Systems (CHI), April 21–26 2018 Montreal, CANADA. NEW YORK: Assoc Computing Machinery. Rufiange, S. & McGuffin, M. J. 2013. DiffAni: Visualizing Dynamic Graphs with a
Hybrid of Difference Maps and Animation. IEEE Transactions on Visualization and Computer Graphics, 19, 2556–2565. Sara Tandon, A. A.-R. 2023. Measuring Effects of Spatial Visualization and Domain On Visualization Task Performance : A Comparative Study. IEEE Transactions on Visualization and Computer Graphics, 29, 668-678. Taieb-Maimon, M., Ya’akobi, E., Itzhak, N. & Zaltsman, Y. 2022. Comparing Visual
Encodings for the Task of Anomaly Detection. International Journal of Human- Computer Interaction, 19. Wickens, C. 1984. Engineering Psychology and Human Performance.
LISTED IN THE AHFE DIGITAL BOOKSTORE CATALOGUE
Explore the complete digital volume
Usability and User Experience
Read this individual research paper free through the original publisher, or explore the full digital proceedings book.
ISBN 978-1-958651-86-5
Explore this ISBN in the AHFE Bookstore ↗Listed in the July 2026 bookstore catalogue; search by ISBN to confirm current availability · Digital book purchase optional