Felix Azenwi Fru, S. Camille Peres, Thomas Overbye, Wonhyeok Jang, Juntao Chen, Hayat Mbayed, Eric Keller, Jung Jung, Sanjana Kunkolienkar, Kayla Ivey (2023). Pedagogical Application of Visualization and Eye Tracking For Electrical Grid Management. In: Training, Education, and Learning Sciences. AHFE Open Access, vol. 109, pp. 211–216. https://doi.org/10.54941/ahfe1003167
Visualizations have been proven to be a beneficial pedagogical tool used in teaching complex concepts to students. Its application as an effective active learning method has been implemented in multiple sectors, such as arts, science, engineering, and social science. In this paper, we present a pilot study exploring the use of visualizations to facilitate students’ comprehension of electrical grid management principles in an active learning process. The methods for conducting the eye-tracking study are presented here, with the results available at the meeting. These results will illustrate how students engage with visualizations as part of the learning process. This study is part of a series of studies focused on examining how methods from human factors and ergonomics can be leveraged for evaluating electrical grid management control rooms. For instance, in a previous pilot study, eye tracking was used to evaluate situation awareness in electrical grid control rooms using visualizations. A comparison of the eye tracking results to the Cognitive Task Analysis (CTA), revealed four SA demons: misplaced salience, data overload, errant mental models, and attentional narrowing.
Visualizations have gained widespread recognition as an effective pedagogi- cal tool for teaching complex concepts to students. In recent years, it has been widely used in a variety of fields, including arts, science (Stieff, 2019), engi- neering (Vijayan et al. 2018), mathematics, physics (Hahn & Klein, 2022), computer science, clinical (Ashraf et al. 2018) and social science, to help students understand complex concepts and solve problems (Booth & Tho- mas, 2000). Particularly for those domains where students traditionally learn concepts through lectures, textbooks, and exercises.
However, these methods have limitations, and students often struggle to comprehend complex constructs. The use of visualizations to facilitate stu- dent learning has been implemented through active learning, where students
engage with the information presented in a more interactive and participa- tory manner (Schweitzer & Brown, 2007). The visualizations have been used by faculty to present information in a manner that is easily understood and provides students with a deeper understanding of the concepts being taught (Casperson & Linn, 2006).
Electrical grid management is a complex concept that involves several interrelated components, including power generation, transmission, distri- bution, and consumption (Glover et al., 2022). Understanding such complex information is important for the student’s understanding of the principles and practices of energy management. By visually representing complex concepts, students may be better able to understand relationships and their interactions, leading to improved comprehension and retention.
Eye-tracking technology has been increasingly used in education resea- rch as a tool to understand engagement and learning processes for students and teachers (Beach & McConnel, 2019). Eye-tracking provides researchers with insight into where students are focusing their attention and can be used to gain a deeper understanding of student engagement with visualizations (Lai et al., 2013).
METHODOLOGY
This pilot study will explore the use of visualizations as an active learning tool to enhance student comprehension of some power system operations principles. The study aims to investigate the impact of visualizations on stu- dent engagement and learning outcomes using eye-tracking technology. All data (think-aloud protocol and eye tracking) will be collected in separate ses- sions where each participant will respond to questions based on principles of power system operations.
Participant Selection The study will be conducted with undergraduate Electrical and Computer Engineering students who are enrolled in a junior-level power systems course. Students in the department are introduced to the topic of power systems with this course. It is assumed that they have not seen the topics presented in the study before although they have the background knowledge to under- stand the topics. The students will be presented with a Training Presentation slide on specific principles of electrical grid management extracted from the course materials. This will be followed by a visualization and traditional presentation of the same principles.
The visualization will consist of animated or static diagrams and gra- phs that explain the various components of the electrical grid and their interactions, while the traditional presentation will consist of tabular and mathematical descriptions. The student’s engagement with the visualizations and traditional presentation will be recorded using eye-tracking technology.
Study Design This study is exploratory in nature, and thus each topic is its own “mini” experimental design, but essentially the design is as follows: the design is a
Pedagogical Application of Visualization and Eye Tracking 213
mixed design as each participant will respond to all four topics (within subje- cts) but will only experience one condition (traditional or visualization). The primary independent variable (IV) is the type of presentation (traditional or visualization), with the second independent variable being the topic (three levels described below). The dependent variables are the scores on the que- stions as well as the measures obtained from the eye-tracking methods. It is important to note that for some of the topics the IV is manipulated for the training presentation, and for some of the topics, the IV is manipulated when the participants answer the questions.
Topic Selection The tables below describe the concepts to be tested, how they will be presented to the students and the questions that will be asked.
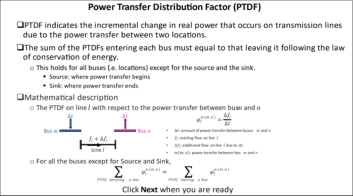
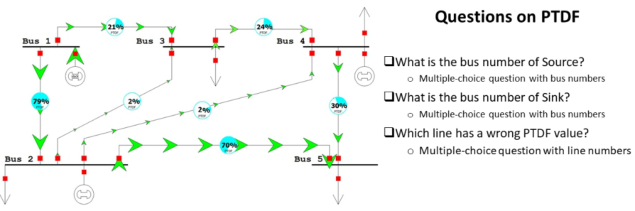
Table 1 represents the concept of Power Transfer Distribution Factor (PTDF). PTDF indicates the incremental change in real power that occurs on transmission lines due to the power transfer between two locations. This topic was chosen because PTDF is a dominant concept in power systems and often it is taught in class with a focus on mathematical aspects. Instructors often experience that students struggle with the concepts and content. The visua- lized material may help students understand the topic more thoroughly and intuitively. Figure 1 shows the content of the traditional method of teaching (or training) the concept (to the left) and the training with the visualization of the concepts (to the right). Table 1 shows the two training conditions (with the traditional content and the visualization content) and the questions that will be asked. Regardless of the training condition, all participants will have access to the visualization while answering the questions for the PTDF topic (see Figure 2).
Table 2 represents the concept of the amount of power generated from different locations on the US/Texas grid. This topic was chosen because the
Table 1. Power transfer distribution factor (PTDF).
Table available in the original PDF paper.
Training Presentation Questions Visualization (Static) Traditional (Mathematical Description)
– What is the number of Source? – What is the bus number of Sink? – Which line has a wrong PTDF value?
*Questions will be presented with visualization (Figure 2).
Figure 1: Training presentation (PTDF) – traditional (left) & visualization (right).Figure 2: Question presentation (PTDF).Table 2. Generation source.
Table available in the original PDF paper.
Training Presentation Questions∗ Traditional (Tabular) Visualization (Static Map & Pie Chart)
Which power generation source is used the most in Texas? Which region has the most power generation with natural gas? What are the top 4 regions for wind power generation?
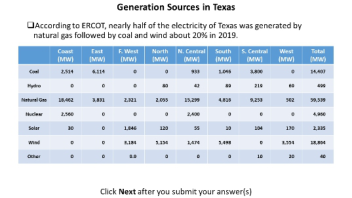
Figure 3: Training presentation (generation) – traditional (left) & visualization (right).
information about generation sources is typically conveyed in a table which can be difficult and time-consuming to parse. The visualized material may help students process this material more quickly. Figure 3 shows the content of the traditional method of teaching (or training) the concept (to the left) and the training with the visualization of the concepts (to the right). The traditional question presentation will correspond to the traditional training presentation and the visualization question presentation will correspond to the visualization training presentation.
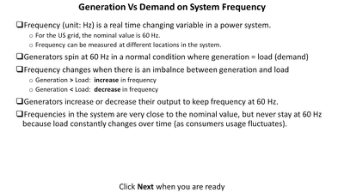
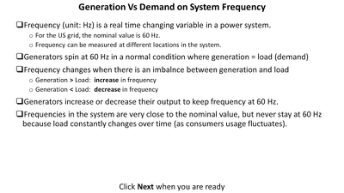
Table 3 represents the concept of Frequency (Hz). Frequency is a real-time changing variable in a power system. The nominal value for the US grid is 60 Hz. This topic was chosen because of the balance between the genera- tion and demand impact on system frequency. Also, it shows the amount of mismatch between generation and demand affects the recovery time of system frequency. Figure 4 shows the content of the traditional method of teaching (or training) the concept and Figure 5 shows the visualization method of trai- ning the concepts. Regardless of the training condition, all participants will
Pedagogical Application of Visualization and Eye Tracking 215
Table 3. Frequency.
Table available in the original PDF paper.
Training Presentation Questions∗ Traditional (Static Graph) Visualization (Animated Video 1 (small generator) & Animated video 2 (large generator)) Indicate the point of origin of frequency change. Which video case has a large generation loss?
*Questions will be presented with visualization (Figure 6).
Figure 4: Traditional training presentation (frequency)–slide #1 (left) & slide #2 (right).Figure 5: Visualization training presentation (frequency)–slide #1 (left) & slide #2 (right).
have access to the visualization while answering the questions for frequency topic.
RESULTS
The results of our pilot study will demonstrate the effectiveness of visualiza- tions in facilitating students’ comprehension of electrical grid management principles. The eye-tracking data should reveal that participants were more engaged with the visualizations compared to other traditional presentations of the learning materials, indicating that they found the visualizations to be an effective tool for understanding the principles.
The following metrics will be evaluated to assess the learning outcomes: Visual attention including fixation counts (the number of times fixations are directed towards a specific area known as the ‘area of interest’ – AOI); Fixa- tion duration (sustained attention of an AOI); and Patterns of saccades (scan paths).
CONCLUSION
In summary, this study will contribute to the research on the use of visualiza- tions in active learning as a pedagogical tool and explores their potential to enhance student comprehension of complex concepts such as electrical grid management principles. The results of the eye-tracking analysis will provide insights into student engagement with the visualizations and will help to fur- ther our understanding of future improvement opportunities of visualizations as an effective pedagogical tool.
ACKNOWLEDGMENT
The authors will acknowledge the student participants for their contributions and suggestions.
REFERENCES
Asfraf, Hajra. Sodergren, Mikael H. Merali, Nabeel. Mylonas, George. Singh, Harsimrat. & Darzi, Ara. (2018) Eye-Tracking Technology in Medical Education: A Systematic Review. Medical Teacher, Volume 40 No. 1. Beach, Pamela & McConnel, Jen. (2019) Eye Tracking Methodology for Studying
Teacher Learning: A Review of the Research. International Journal of Research & Method in Education, Volume 42 No. 5. Booth, Rhonda D. L & Thomas, Michael O. J. (2000) Visualization in Mathematics Learning: Arithmetic Problem-Solving and Student Difficulties, The Journal of Mathematical Behavior, Volume 18, No. 2. Casperson, Janet M. & Linn, Marcia C. (2006) Using Visualizations to Teach
Electrostatics. American Journal of Physics, Volume 74 No. 316. Glover, Overbye, Sarma & Birchfield, 7th ed. (2022). Power Systems Analysis and Design, Cengage Learning. Hahn, L. and Klein, P. (2022) Eye Tracking in Physics Education Research: A syste-
matic literature Review, Physical Review Physics Education Research. Volume 18 No. 1. Lai, Meng-Lung. Tsai, Meng-Jung. Yang, Fang-Ying. Hsu, Chung-Yuan. Liu, Tzu- Chien. Lee, Silvia Wen-Yu. Lee, Min-Hsien. Chiou, Guo-Li. Liang, Jyh-Chong. & Tsai, Chin-Chung. (2013) A Review of using Eye-Tracking Technology in Explo- ring Learning from 2000 to 2012. Educational Research Review. Volume 10. Schweitzer, Dino, and Brown, Wayne. (2007) Interactive Visualization for the Active
Learning Classroom. Proceedings of the 38th SIGCSE technical symposium on Computer science education. pp. 208–212. Stieff, Mike. (2019) Improving Learning Outcomes in Secondary Chemistry with Visualization-Supported Inquiry Activities. Journal of Chemical Educa- tion, Volume 96 No. 7. Vijayan, Kavin Kathiresh. Mork, Ola Jon. Hansen, Irina Emily. (2018). Eye Tracker as a Tool for Engineering Education. Universal Journal of Educational Research, Volume 6 No. 11.
LISTED IN THE AHFE DIGITAL BOOKSTORE CATALOGUE
Explore the complete digital volume
Training, Education, and Learning Sciences
Read this individual research paper free through the original publisher, or explore the full digital proceedings book.
ISBN 978-1-958651-85-8
Explore this ISBN in the AHFE Bookstore ↗Listed in the July 2026 bookstore catalogue; search by ISBN to confirm current availability · Digital book purchase optional