Ziaul Haque Munim, Tae-Eun Kim (2023). A Review of Learning Analytics Dashboard and a Novel Application in Maritime Simulator Training. In: Training, Education, and Learning Sciences. AHFE Open Access, vol. 109, pp. 123–133. https://doi.org/10.54941/ahfe1003158
Developing a Learning Analytics Dashboard (LAD) to evaluate maritime simulation training performance based on key performance indicators (KPIs) of maritime navigational competence can improve learning efficiency and effectiveness. Relevant data needs to be fed from simulation training logs and other sources, analysed using appropriate visualization and artificial intelligence approaches, and reported in a single window with valuable insights for trainees and instructors. This study provides a Systematic Literature Review (SLR) of published literature on LADs using scientometric tools and techniques. The findings reveal six research clusters and publication trends in LAD research. An example of a novel application of Automated Machine Learning (AutoML) analysing data from maritime desktop simulator training is presented for future maritime LAD development.
Learning Analytics Dashboards (LADs) are useful for tracing learning acti- vities that can provide valuable insights to students and teachers (Verbert et al., 2013). Depending on the degree of insights, LADs can be descriptive, predictive and prescriptive (Susnjak et al., 2022). Varying degrees of insights can be utilized for assessing learning progress throughout a particular assi- gnment or task, during a course as well as for final assessment at the end of a course. A large number of the studies on LADs focus on online, blended or distance learning courses, e.g. Florian-Gaviria et al. (2013) and Herodo- tou et al. (2019). While the use of LADs in regular school or university level courses has been evident, for example, Han et al. (2021), LAD applications in simulation-based professional or vocational training are rare.
Maritime education and training (MET) use training simulators at vari- ous degrees of fidelity to facilitate practical skill development (Kim et al., 2021). In the MET context, the performance assessment of trainees during the simulations is usually based on the subjective assessment by an instru- ctor (Kobayashi, 2005). The presence of instructor bias and their subjective
assessments can pose significant obstacles to achieving reliable and objective performance evaluations of trainees in maritime simulators. While there have been ongoing efforts to enhance the objectivity of maritime simulator training performance assessment (Ernstsen and Nazir, 2020, Fan and Yang, 2023), reliable and scalable approaches utilizing readily useable data from simulator logs are limited.
This study reviews the extant literature on LADs using a Systematic Lite- rature Review (SLR) approach. To demonstrate a use case of LADs in performance assessment of maritime simulator training, a novel example using the Automated Machine Learning (AutoML) approach is presented.
METHODOLOGY
The first step in the SLR is to search for relevant literature in academic data- bases through a systematic workflow. The Web of Science (WOS) database is used in this study since it is one of the largest academic databases with the coverage of more than 200 million records, including journal articles, conference proceedings and books (Clarivate, 2023) and is one of the most commonly used databases in SLRs.
Aligned with the focus of this study, initially, the Boolean expression “lear- ning analytics dashboard” was used to find relevant studies for review, which reverted 56 documents (see search 1 in Table 1), of which several were lite- rature reviews. The literature search was improved following the literature search approach of one of the most cited studies (Matcha et al., 2019) and one of the recent review studies (Valle et al., 2021) with minor adjustments.
No Boolean keywork search expression No. of studies in WOS
167
1 “learning analytics dashboard*” 56 2 (“learning analytics” OR “educational data mining”) AND “dashboard*” [Adopted from Matcha et al. (2019)]
239
3 “dashboard*” AND (“learning” OR “learner*” OR “student*”) AND “analytics” [Adopted from Valle et al. (2021) with adjustments]
85
4 “learning analytics dashboard*” OR “learning dashboard*” OR “dashboard for learning analytics” OR “educational dashboard*” [Adopted from Valle et al. (2021)]
144
5 SEARCH 2 OR 3 OR 4 249 6 Limited to journal articles only 231 7 Limited to studies in English only 224 8 Limited to publishers Springer Nature, Elsevier, Taylor & Francis, IEEE, Wiley, Emerald Group Publishing, Oxford University Press, Sage
9 Manually filtered for relevance 89
A Review of Learning Analytics Dashboard and a Novel Application 125
Further, Valle et al. (2021) stated several terms that are used in the literature to refer to LAD. The search approach in this study utilized these terms, see search 2–4 in Table 1. The search 5 combined searches 2–4 using the “OR” operator to find collectively exhaustive records among the searches, which reverted 249 records.
After refining the list by only journal articles written in English, limiting to reputed publishers only, and then manually screening for relevance, 89 stu- dies were identified for further analysis. The exclusion criteria in the manual screening process were — literature reviews, bibliometric reviews, science mapping, general overview studies not directly related to LAD, opinion type studies, and studies deliberately focused on children education. The detailed screening process is reported in Table 1.
RESULTS
The analysis of the sample of 89 identified studies revealed publication trends and six research clusters in LAD. Thereafter, a novel application of LADs in maritime simulator training assessment is presented.
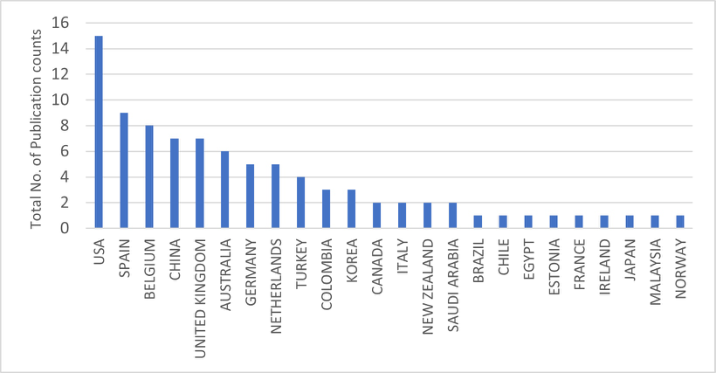
Publication Trends in LAD Research The bibliometrix package (Aria and Cuccurullo, 2017) in R-software was used to analyse publication trends. The 89 studies were published in 40 aca- demic outlets from 2013 to 2022, with an annual growth rate of 31.8%. As reported in Table 2, the number of publications on LADs has grown lar- gely since 2018. The most relevant journals for publication of LAD research are IEEE Transactions on Learning Technologies, Computers & Education, and Computers in Human Behavior (Table 3). Figure 1 reports the ranking of countries according to the number of publications. Scholars from the Uni- ted States of America (USA), Spain and Belgium have published the most on LAD-related topics.
Table 2. Number of annual publications and citation metrics (TC refers to total citations; source: authors).
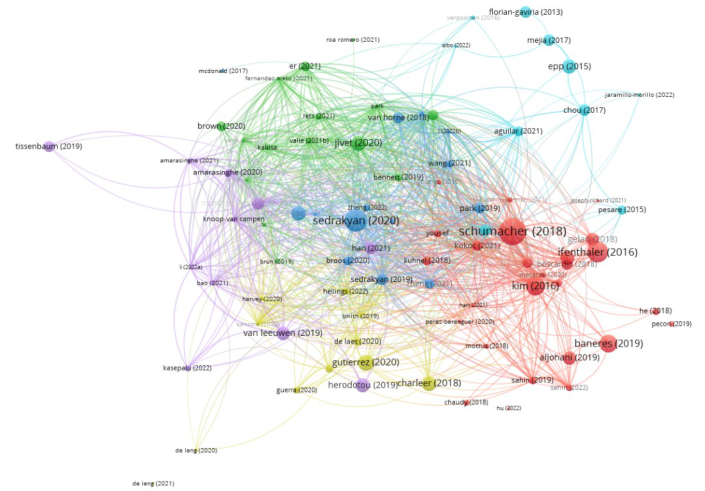
Cluster Analysis Using Bibliographic Coupling A bibliographic coupling cluster analysis of the 89 sample studies extracted from the WOS database using the VosViewer software (Van Eck and Wal- tman, 2009) reveals six clusters, see Figure 2. When two or more studies cite a number of common studies, they are referred to as bibliographically cou- pled (Kessler, 1963) and are likely to share a common theme. In Table 4, the four most cited studies from each cluster are reported.
(1) Expectations from LADs (red): Studies in this cluster explored the features of LADs that students expect (Schumacher and Ifenthaler, 2018), privacy expectations (Ifenthaler and Schumacher, 2016), learning achievement and satisfaction expectations (Kim et al., 2016), and finally, the expectation to identify students who may
A Review of Learning Analytics Dashboard and a Novel Application 127
Figure 2: Bibliographic coupling of 89 sample studies using VosViewer (source: authors).Table 4. List of four most cited studies in each cluster (source: authors).
Table available in the original PDF paper.
Cluster 1 (Red) Cluster 2 (Green) Cluster 3 (Blue) Jivet et al. (2020) Sedrakyan et al. (2020) Schumacher and Ifenthaler (2018)
Ifenthaler and Schumacher (2016)
Howell et al. (2018) Molenaar and Knoop-van Campen (2018) Kim et al. (2016) Brown (2020) Sedrakyan et al. (2019) Baneres et al. (2019) Er et al. (2021) Park and Jo (2019)
Gutiérrez et al. (2020) Herodotou et al. (2019) Epp and Bull (2015) De Laet et al. (2020) Han et al. (2021) Chou et al. (2015) Charleer et al. (2017) Martinez-Maldonado (2019) Ramos-Soto et al. (2017) Tissenbaum and Slotta (2019) Florian-Gaviria et al. (2013)
be at risk early (Baneres et al., 2019). The core expectations from LADs include delivering adaptive learning content and providing self-assessment (Schumacher and Ifenthaler, 2018). Meanwhile, students who use LADs frequently are likely to demonstrate higher learning achievement but less satisfied with LADs than low-frequency users (Kim et al., 2016).
128 Munim and Kim
(2)Sensemaking of LADs (green): There are several perquisites to the sensemaking of LADs to teachers and stu- dents. Students with a high self-regulated learning (SRL) ability find LADs more relevant (Jivet et al., 2020). However, only providing activity stati- stics and reports through visualisation in LADs may not drive SRL abilities (Howell et al., 2018). Also, from the teachers’ perspective, it is common to become frustrated with data presentation in LADs (Brown, 2020). LADs that are designed following relevant pedagogy theories are likely to improve the relevance of LADs to users (Er et al., 2021).
(3) Design principles in LADs (blue): For the success of LADs in their goals of improving learning achievement and supporting teachers, design principles need proper scrutiny. For stu- dents, LADs with higher visual attraction and usability enhance learning achievement (Park and Jo, 2019). For teachers, it is evident that those who used LADs more frequently were providing more diverse feedback to stu- dents (Molenaar and Knoop-van Campen, 2018). Studies have provided detailed guidelines on the design principles of LADs, particularly with a focus on feedback loop design (Sedrakyan et al., 2020). In a LAD, feedback can be categorised into four: cognitive, behavioural, outcome-oriented, and process-oriented (Sedrakyan et al., 2019).
(4) LADs as support in student-teacher dialogue (yellow): In addition to facilitating learning achievements in physical or online class- room environments, LADs are also useful in student-teacher dialogue or briefing-debriefing contexts. Utilizing LADs leads to improved advisory gui- dance to students who failed courses (Gutiérrez et al., 2020) as well as motivated students and triggered dialogue (Charleer et al., 2017). LADs that can provide textual outcomes based on learning analytics data are parti- cularly useful, mainly as a complementary tool though (Ramos-Soto et al., 2017). (5) Real-time and predictive assessment (purple): While a majority of the LADs mainly provide descriptive data and visua- lize them, advanced applications of LADs include real-time and predictive assessment of students. Using predictive analytics, teachers can identify students-at-risk, and usually, their performance gets significantly better than those who were not identified using such analytics (Herodotou et al., 2019). Real-time information from LADs are also useful for orchestrating ada- ptive feedback in a face-to-face or group task assessment (Han et al., 2021, Martinez-Maldonado, 2019, Tissenbaum and Slotta, 2019).
(6) Open learner model (turquoise): Studies in this cluster focus on student-faced LADs that provide visualiza- tion of their activities and performances. This is known as the open learner model or open student model. Such LADs help students find their core competencies (Chou et al., 2015), level of understanding (Epp and Bull, 2015), and challenges in the learning environment (Mejia et al., 2016), while improving reflection and the degree of awareness (Florian-Gaviria et al., 2013).
A Review of Learning Analytics Dashboard and a Novel Application 129
APPLICATION IN MARITIME SIMULATOR TRAINING ASSESSMENT The majority of the applications of LADs were observed in traditional class- room courses and online or distance learning courses. Despite evidence of significant benefits in student learning achievement and facilitating teachers as a complementary tool, the use of LADs is rare in the context of vocatio- nal and professional training programs such as maritime simulator training. Major challenges are the subjectivity involved in the key performance metrics (KPIs) for assessment, difficulties in setting the performance standards, and data availability.
Studies on maritime simulator training performance assessment have used various datasets from simulator training exercises (Hjelmervik et al., 2018, Øvergård et al., 2017) and eye trackers (Atik, 2019). To reduce bias in subjective assessment, studies have also used multi-criteria decision-making, Bayesian network models, and artificial neural networks (Ernstsen and Nazir, 2020, Fan and Yang, 2023). However, these approaches either provide a sim- ple performance assessment based on a few parameters or are not suitable for adoption in a LAD with real-time or predictive capabilities.
This study demonstrates a novel application of AutoML (He et al., 2021) by analysing data extracted from a desktop maritime simulator training exe- rcise. The extracted data file includes 6601 observations of 24 parameters with approximately one-second intervals for one student exercise. A group of 12 students were part of the exercise, but each was exposed to a different situation since they started from different locations. The logged data starts at timestamp 00:02:23.920 and ends at 01:52:24.002. Since only one student’s simulator training log data is available, only unsupervised machine learning (ML) could be used, particularly anomaly detection models for unlabelled data.
The DataRobot AutoML cloud computing platform (datarobot.com) was used for analysis. The AutoML platform implemented the six ML models. The best-performing model is the One-Class SVM Anomaly Detection with Calibration with Synthetic AUC1 values of 0.6557, 0.6608, and 0.6616 in the validation, cross-validation and holdout samples, respectively. The best- performing model can be deployed for the prediction of anomalies for new datasets of the same exercise with identical parameters.
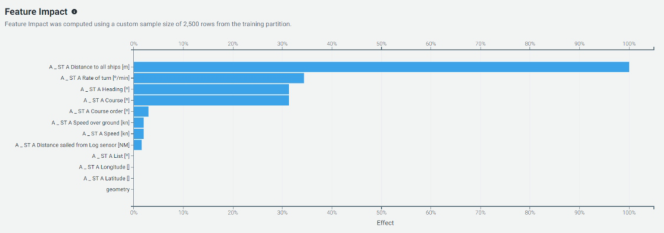
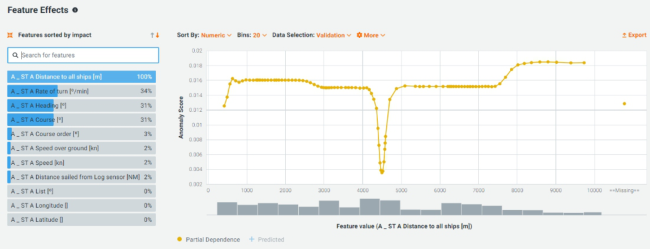
Anomaly detection is also referred to as novelty, uniqueness, or outlier detection. The most relevant features for anomaly detection have been identified using the best-performing ML model (Figure 3). Out of the 24 input parameters, eleven parameters are detected as informative features contributing to the model performance, of which eight have some visible effects on the anomaly. The most crucial parameter is the distance to all ships followed by the rate of turn, heading, and course, which can be used in the design and development of maritime learning analytics dashboards, but these parameters alone cannot judge navigational performance; they need to be interpreted in combination with other parameters (including non-technical) within the defined scenarios. Figure 4 presents the feature effect of the most 1For details on anomaly detection in DataRobot, please see https://docs.datarobot.com/en/docs/modelin g/special-workflows/unsupervised/anomaly-detection.html. Accessed on February 15, 2023.
130 Munim and Kim
Figure 3: Most relevant features for anomaly detection (source: authors).Figure 4: Individual feature effects on anomaly (source: authors).
crucial parameter, that is, distance to all ships. Given the set of informative parameters, for the analysed data, the degree of anomaly falls to the lowest when the distance to all ships is about 4500 meters. In addition, the degree of anomaly increases from the usual level sharply when the distance to all ships is approaching more than 7500 meters. Similarly, feature effects of the other relevant parameters can be explored.
CONCLUSION
This study provides a systematic review of LAD research and demonstrates a novel application potential in the context of maritime simulator training performance assessment. The review of LAD literature revealed six research clusters. The number of publications on the topic has been growing recently, although still in the early stages. IEEE Transactions on Learning Technologies is the most relevant journal outlet for the publication of LAD research, and scholars from the USA are the most productive on this topic.
Studies in the six clusters provide evidence that LADs have the poten- tial to augment teachers’ capabilities, allow for informed assessment and a more transparent understanding of learning progress, lead to diverse feed- back to students, and should be used more as a complementary tool during the educational process. LADs improve students’ learning achievement, trig- ger conversation, and motivate them to learn more engagingly. The design features of LADs play a vital role in their implementation success.
A Review of Learning Analytics Dashboard and a Novel Application 131
This study reports an example of anomaly analysis for one student’s simu- lation log data using AutoML. If data from multiple students are accessible, their individual anomaly patterns as well as the anomaly pattern of the group of students for the same simulator training exercise, could be asses- sed. This unveils the potential for large-scale implementation of LADs in maritime simulator-based training performance assessment using the demon- strated approach in descriptive, predictive, and prescriptive designs. Future research should further explore the use of similar ML techniques and new approaches to implement LADs utilizing data from simulator logs and other relevant sources such as eye-tracking.
ACKNOWLEDGMENT
The authors thank Head Simulation Engineer at the Department of Maritime Operations at the University of South-Eastern Norway, Haakon Thorvaldsen, for providing the log dataset from desktop simulator training exercises. The used dataset will be made available in dataverse.no after the publication of this manuscript.
FUNDING This research is funded by the European Union’s Horizon Europe research and innovation programme under grant agreement No 101060107.
REFERENCES
Aria, M. & Cuccurullo, C. 2017. bibliometrix: An R-tool for comprehensive science mapping analysis. Journal of Informetrics, 11, 959–975. Atik, O. 2019. Eye tracking for assessment of situational awareness in bridge resource
management training. Journal of Eye Movement Research, 12(3):7. Baneres, D., Rodríguez-Gonzalez, M. E. & Serra, M. 2019. An early feedback prediction system for learners at-risk within a first-year higher education course. IEEE Transactions on Learning Technologies, 12, 249–263. Brown, M. 2020. Seeing students at scale: How faculty in large lecture courses
act upon learning analytics dashboard data. Teaching in Higher Education, 25, 384–400. Charleer, S., Moere, A. V., Klerkx, J., Verbert, K. & De Laet, T. 2017. Learning analytics dashboards to support adviser-student dialogue. IEEE Transactions on Learning Technologies, 11, 389–399. Chou, C.-Y., Tseng, S.-F., Chih, W.-C., Chen, Z.-H., Chao, P.-Y., Lai, K. R.,
Chan, C.-L., Yu, L.-C. & Lin, Y.-L. 2015. Open student models of core compete- ncies at the curriculum level: Using learning analytics for student reflection. IEEE Transactions on Emerging Topics in Computing, 5, 32–44. Clarivate. 2023. Web of Science Coverage Details [Online]. Available: https://clariv ate.libguides.com/librarianresources/coverage [Accessed February 12 2023]. De Laet, T., Millecamp, M., Ortiz-Rojas, M., Jimenez, A., Maya, R. & Verbert,
K. 2020. Adoption and impact of a learning analytics dashboard supporting the advisor—Student dialogue in a higher education institute in Latin America. British Journal of Educational Technology, 51, 1002–1018.
132 Munim and Kim
Epp, C. D. & Bull, S. 2015. Uncertainty representation in visualizations of learning analytics for learners: Current approaches and opportunities. IEEE Transactions on Learning Technologies, 8, 242–260. Er, E., Dimitriadis, Y. & Gaševi´c, D. 2021. Collaborative peer feedback and lear-
ning analytics: Theory-oriented design for supporting class-wide interventions. Assessment & Evaluation in Higher Education, 46, 169–190. Ernstsen, J. & Nazir, S. 2020. Performance assessment in full-scale simulators–A case of maritime pilotage operations. Safety Science, 129, 104775. Fan, S. & Yang, Z. 2023. Towards objective human performance measurement
for maritime safety: A new psychophysiological data-driven machine learning method. Reliability Engineering & System Safety, 109103. Florian-Gaviria, B., Glahn, C. & Gesa, R. F. 2013. A software suite for efficient use of the European qualifications framework in online and blended courses. IEEE Transactions on Learning Technologies, 6, 283–296. Gutiérrez, F., Seipp, K., Ochoa, X., Chiluiza, K., De Laet, T. & Verbert, K.
2020. Lada: A learning analytics dashboard for academic advising. Computers in Human Behavior, 107, 105826. Han, J., Kim, K. H., Rhee, W. & Cho, Y. H. 2021. Learning analytics dashboards for adaptive support in face-to-face collaborative argumentation. Computers & Education, 163, 104041. He, X., Zhao, K. & Chu, X. 2021. AutoML: A survey of the state-of-the-art.
Knowledge-Based Systems, 212, 106622. Herodotou, C., Hlosta, M., Boroowa, A., Rienties, B., Zdrahal, Z. & Mangafa, C.
2019. Empowering online teachers through predictive learning analytics. British Journal of Educational Technology, 50, 3064–3079. Hjelmervik, K., Nazir, S. & Myhrvold, A. 2018. Simulator training for maritime complex tasks: an experimental study. WMU Journal of Maritime Affairs, 17, 17–30. Howell, J. A., Roberts, L. D. & Mancini, V. O. 2018. Learning analytics messages:
Impact of grade, sender, comparative information and message style on student affect and academic resilience. Computers in Human Behavior, 89, 8–15. Ifenthaler, D. & Schumacher, C. 2016. Student perceptions of privacy principles for learning analytics. Educational Technology Research and Development, 64, 923–938. Jivet, I., Scheffel, M., Schmitz, M., Robbers, S., Specht, M. & Drachsler, H. 2020.
From students with love: An empirical study on learner goals, self-regulated lear- ning and sense-making of learning analytics in higher education. The Internet and Higher Education, 47, 100758. Kessler, M. M. 1963. Bibliographic coupling between scientific papers. Journal of the Association for Information Science and Technology 14, 10–25. Kim, J., Jo, I.-H. & Park, Y. 2016. Effects of learning analytics dashboard: analyzing
the relations among dashboard utilization, satisfaction, and learning achievement. Asia Pacific Education Review, 17, 13–24. Kim, T.-E., Sharma, A., Bustgaard, M., Gyldensten, W. C., Nymoen, O. K., Tusher, H. M. & Nazir, S. 2021. The continuum of simulator-based maritime training and education. WMU Journal of Maritime Affairs, 20, 135–150. Kobayashi, H. 2005. Use of simulators in assessment, learning and teaching of
mariners. WMU Journal of maritime affairs, 4, 57–75. Martinez-Maldonado, R. 2019. A handheld classroom dashboard: Teachers’ perspectives on the use of real-time collaborative learning analytics. International Journal of Computer-Supported Collaborative Learning, 14, 383–411.
A Review of Learning Analytics Dashboard and a Novel Application 133
Matcha, W., Gaševi´c, D. & Pardo, A. 2019. A systematic review of empirical studies on learning analytics dashboards: A self-regulated learning perspective. IEEE Transactions on Learning Technologies, 13, 226–245. Mejia, C., Florian, B., Vatrapu, R., Bull, S., Gomez, S. & Fabregat, R. 2016. A
novel web-based approach for visualization and inspection of reading difficulties on university students. IEEE Transactions on Learning Technologies, 10, 53–67. Molenaar, I. & Knoop-van campen, C. A. 2018. How teachers make dashboard information actionable. IEEE Transactions on Learning Technologies, 12, 347–355. Øvergård, K. I., Nazir, S. & Solberg, A. S. 2017. Towards automated performance
assessment for maritime navigation. TransNav: International Journal on Marine Navigation and Safety of Sea Transportation, 11, 229–234. Park, Y. & Jo, I.-H. 2019. Factors that affect the success of learning analytics dashboards. Educational Technology Research and Development, 67, 1547–1571. Ramos-Soto, A., Vazquez-Barreiros, B., Bugarín, A., Gewerc, A. & Barro, S.
2017. Evaluation of a Data-To-Text System for Verbalizing a Learning Analytics Dashboard. International Journal of Intelligent Systems, 32, 177–193. Schumacher, C. & Ifenthaler, D. 2018. Features students really expect from learning analytics. Computers in Human Behavior, 78, 397–407. Sedrakyan, G., Malmberg, J., verbert, K., Järvelä, S. & Kirschner, P. A. 2020. Linking
learning behavior analytics and learning science concepts: Designing a learning analytics dashboard for feedback to support learning regulation. Computers in Human Behavior, 107, 105512. Sedrakyan, G., Mannens, E. & Verbert, K. 2019. Guiding the choice of learning dashboard visualizations: Linking dashboard design and data visualization concepts. Journal of Computer Languages, 50, 19–38. Susnjak, T., Ramaswami, G. S. & Mathrani, A. 2022. Learning analytics dashbo-
ard: a tool for providing actionable insights to learners. International Journal of Educational Technology in Higher Education, 19, 12. Tissenbaum, M. & Slotta, J. 2019. Supporting classroom orchestration with realtime feedback: A role for teacher dashboards and real-time agents. International Journal of Computer-Supported Collaborative Learning, 14, 325–351. Valle, N., Antonenko, P., Dawson, K. & Huggins-Manley, A. C. 2021. Staying on tar-
get: A systematic literature review on learner-facing learning analytics dashboards. British Journal of Educational Technology, 52, 1724–1748. Van Eck, N. & Waltman, L. 2009. Software survey: VOSviewer, a computer program for bibliometric mapping. Scientometrics, 84, 523–538. Verbert, K., Duval, E., Klerkx, J., Govaerts, S. & Santos, J. L. 2013. Learning
analytics dashboard applications. American Behavioral Scientist, 57, 1500–1509.
LISTED IN THE AHFE DIGITAL BOOKSTORE CATALOGUE
Explore the complete digital volume
Training, Education, and Learning Sciences
Read this individual research paper free through the original publisher, or explore the full digital proceedings book.
ISBN 978-1-958651-85-8
Explore this ISBN in the AHFE Bookstore ↗Listed in the July 2026 bookstore catalogue; search by ISBN to confirm current availability · Digital book purchase optional