Steven Kangisser, Abhishek Shankar, Javier Irizarry, Harnish Sharma (2023). Visualization enhancements to facilitate the use of digital demonstrators for instructional applications. In: Training, Education, and Learning Sciences. AHFE Open Access, vol. 109, pp. 180–190. https://doi.org/10.54941/ahfe1003164
This paper investigates a novel approach to instruction in the use of complex instruments. A laser scanner is employed as a test bed for lessons which can then be more broadly implemented. Laser scanners use optical signals from reflected light. These signals are then processed to create a 3D point cloud of the scanned object or environment. The point clouds can be used to derive accurate information about the mapped area's dimensions. Laser Scanners are widely used in aerospace, manufacturing, law enforcement, agriculture, and construction industries to capture details and create models of existing structures and objects. Many universities teach students the theory and process of laser scanning. Laser scanners are typical instruments for which instruction on their application requires students to apply theoretical knowledge through hands-on exposure to technology. Limited access to instructional scanning instruments presents a challenge when class sizes are large, or courses are offered remotely. In these cases, access to the equipment required can impede the accomplishment of the stated course objective. As a means of negating the limited access to a physical instrument, a digital demonstrator was developed. This digital prototype can augment or replace a physical artifact, such as a laser scanner. To accomplish this task, the researchers examined the current method of scanner instruction at undergraduate and master's degree levels. A simulated scanner was then developed and tested in actual courses at three universities' graduate and undergraduate level courses. Student performance was measured using a mixed methods approach. Testing confirmed that a digital representation of a complex instrument could be an effective teaching tool, even to the extent of replacing a physical artifact. Having established the utility of a digital demonstrator, the researchers incorporated additional visualization capabilities into the digital scanner interface. These interface enhancements are not found on the physical scanner and are intended to facilitate student understanding of scanner theory rather than instrument operation alone. Such visualization enhancements had to be offered in a way in which the absence of the added visualization component would not be critical to the student's ability to operate an actual physical scanner. User testing confirmed that visualization additions to the interface facilitated an understanding of the theory behind the instrument's application and that students could later operate a physical scanner without these enhancements. The authors conclude by offering a set of principles for visualization enhancements to a digital interface that others may apply when designing demonstrators for instructional use.
Visualization Enhancements to Facilitate the Use of Digital Demonstrators 181
INTRODUCTION
Laser Scanners are widely used in the construction industry to capture details of existing structures and objects. Laser scanners analyze the built envi- ronment, including real-world objects, by collecting data on shape and appearance. The resulting data is frequently applied to develop digital three- dimensional models (Ebrahim, 2015). Laser scanners use laser beams to create a three-dimensional point cloud. The scanner sends out a laser beam and calculates resulting point cloud information based on the amount of time taken by the beam to return to the scanner. These point clouds can then be used to derive accurate information about the mapped area’s dimensions.
Instruction of laser scanning skills requires students to apply theoretical knowledge through hands-on exposure to laser scanner technology. This instruction must often be accomplished with the availability of few or no physical scanners. The limited availability of scanning instruments presents a challenge when class sizes are large, as the instrument-to-student ratio does not permit each student reasonable hands-on access. Also, when such courses are offered remotely, access to the equipment required to gain this exposure can impede the accomplishment of the stated course objective. At the Geor- gia Institute of Technology, School of Building Construction, laser scanning is taught to students both at the undergraduate and graduate levels. A typical semester combined cohort size is approximately sixty-five students, yet the School possesses only two instructional scanners.
The development of a digital demonstrator which could augment or replace a physical laser scanner was developed as a solution to the limited or non-availability of physical scanners. To accomplish this task, the research- ers examined the current method of scanner instruction at the undergraduate and master’s degree levels. A simulated scanner was then developed which incorporates interactive visualizations. These visualizations are designed to enable student understanding of both theory and field application of laser scanning. The digital prototype was tested by initial introduction to a test group of high school students, followed by a graduate and an undergraduate class at the Georgia Institute of Technology, as well as two other universi- ties. Student performance was measured using a mixed methods approach. The results of these tests are detailed in this article, along with conclusions concerning the effectiveness of a digital demonstrator for the instruction of laser scanning.
BACKGROUND
Learning through a digital demonstrator is, in many ways, like simulation gaming. In gaming, the goal is to simulate a decision-making process and demonstrate the consequences of incorrect decisions. Kriz (2003) defines games as “the simulation of effects of decisions made by actors assuming roles that are interrelated with a system of rules and with explicit references to resources that realistically symbolize the existing infrastructure and avai- lable resources.” There are two types of simulation games, open and closed. Open games lack a clearly defined ending and permit players to establish goals based on personal preference. The digital demonstrator is more similar
to closed games as rigid rule simulation is incorporated. Players receive clear instructions which are based on well-defined rules. The problem statement is presented to the player within a well-defined framework. Participants must solve the problem precisely while adhering to the rules. The simulation model, rules, and flow are not stated explicitly in open, free-form games. Hence, a reflection phase is needed when teaching specific skills through gaming simulation. During reflection, participants can apply the knowledge acquired during the gaming simulation to the real world.
Training exercises have been demonstrated to be critical to gaining compe- tence as part of knowledge transfer for complex skills. Advanced computing has recently enabled the integration of more serious games and simulations in skill training. The use of these tools has increased dramatically for trai- ning that is complex, time-critical and involves high risk. Simulators can now provide the learner with visualizations of the environment and the dynamics related to the user’s actions (Aronsson, Artman et al., 2021).
Digital demonstrators offer increased flexibility over physical artifacts when used for knowledge transfer. One important feature of a demonstrator is the ability to incorporate visualizations not otherwise included in the physi- cal version. Information technology and graphics enable the development of powerful animated visualizations of technical phenomena (Card, Mackinlay, & Schneiderman, 1999; Spence, 2001). Ainsworth explains that dynamic representations can visualize entities that are not otherwise visible but are spatially distributed (Ainsworth and Van Labeke, 2004). Dynamic displays can also be used to distort reality by, for example, altering the speed of a process, changing the viewpoints, or by adding cues to direct viewers’ atten- tion to critical components or processes (Hegart, 2004). Dynamic displays can also be used to deliberately distort reality. This technique can be emplo- yed to improve understanding (Schwan, Garsoffky, & Hesse, 2000), or to draw direct attention to display features which are thematically relevant but perhaps not easily understood (Lowe, 2004). Integration of interactive visu- alizations are more effective for students who are motivated and poses the metacognitive skills to effectively engage with these interactive visualizations (Hegart, 2004).
When employing dynamic visualizations, it is important to consider the amount of information being portrayed. Lowe explains that it is possible to include too little information, in which case the user may be underwhelmed, and experience a loss of cognitive engagement. Including too much infor- mation causes the user to be overwhelmed. In this situation high cognitive demands may prevent the user from adequately processing the information due to the excessive cognitive demands imposed. When learners become ove- rwhelmed, they adapt by applying attention selectively to a subset of the information contained in the interactive visualization (Lowe, 2004).
METHODOLOGY
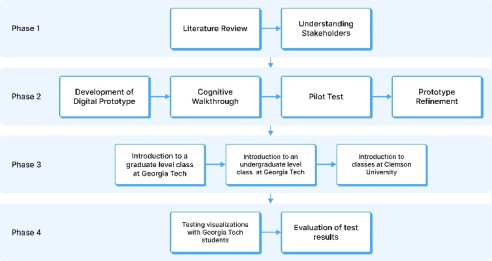
The work plan for this research is illustrated in Figure 1. It encompasses ele- ven primary activities, including a literature review, identification of stakeh- olders, developing a digital prototype, conducting a cognitive walkthrough, a
Visualization Enhancements to Facilitate the Use of Digital Demonstrators 183
Figure 1: Methodology.
pilot test, prototype refinement, introduction to a graduate-level class, intro- duction to two undergraduate-level classes, further evaluation of interactive visualizations, and the evaluation of test results.
Understanding the Stakeholders The initial task for this study was to understand the needs of the stakeholders who interact with laser scanners in the classroom. To accomplish this task, researchers observed instructors’ and students’ interaction using a physical scanner in a traditional classroom setting. Observation included a graduate course in Construction Technology, offered in the School of Building Con- struction at the Georgia Institute of Technology. Such traditional scanner instruction is performed using limited instruments compared to class size. It was determined that there are two stakeholders, instructors, and students. For instructors, it was observed to be desirable to develop a demonstrator with which the instructor can teach students the setup and operation of a laser scanner. Instructors should be able to use the tool to test students’ knowledge of a scanner’s operation for both formative and summative evalu- ations. Instructors should also have tools to measure proficiency in scanner operation. Students should be able to access the laser scanner demonstrator both synchronously and asynchronously, as not all learning occurs during scheduled class time.
Development of a Digital Prototype The results of the first phase, user analysis, informed the design decisions made in the design phase. Understanding the needs of both instructors and students, the researchers determined that designing multiple distinct operati- onal modes would permit greater flexibility for all users. For this reason, an access mode and an assessment mode were developed. To reflect a variety of commercially available laser scanners, the design decision was made to deve- lop a generic scanner inspired by available models but responsive to the needs of new users. The design phase was carried out in Figma (an Adobe company), a tool that allows the development of wireframes. Wireframes were then car- ried over to Protopie, a high-fidelity prototyping tool commonly used in user interface design. High-fidelity interactions were designed using this Protopie
software. The digital demonstrator is viewed on a browser window hosted on the Protopie cloud.
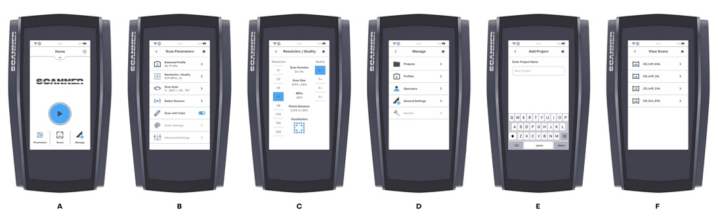
The first use mode of the demonstrator is the access mode. The access mode is an unrestricted mode aimed at instructional and practice usage. This mode has full access to the digital demonstrator and has no constraints on the device settings. All of the laser scanner settings can be modified by the users. Instructors can employ the access mode as a teaching tool during class instru- ction. Students can follow along during a lecture interacting with the laser scanner as they see beneficial. The access mode is depicted in Figure 2. Using the access mode, students can follow up after a lecture, further familiarizing themselves with the laser scanner at their own pace.
Supplementing the Access mode is the Assessment mode. The assessment mode is a restricted functionality mode aimed at enabling instructors to assess student proficiency in the operation of the laser scanner device. This mode can be used for evaluation at both the formative and summative stages of assessments. While in this mode, the user has a randomly assigned scenario that they must navigate. The assessment mode permits instructors to gauge students’ proficiency using the laser scanner in one of the two randomly assi- gned scenarios. Students can use this mode to measure their proficiency and ability to operate a laser scanner. When the student demonstrates operatio- nal proficiency in the digital demonstrator, they are rewarded with a data set identical to what a physical laser scanner device would provide at the succes- sful completion of a laser scan activity. Students can then use this data set to advance to the data processing and analysis stages outside this demonstrator’s scope.
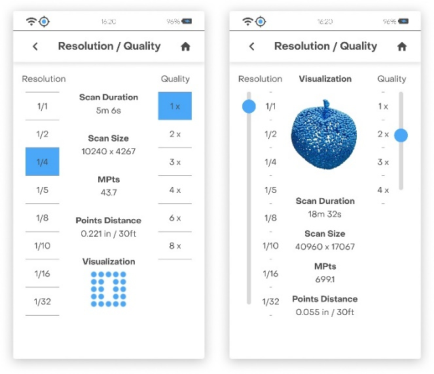
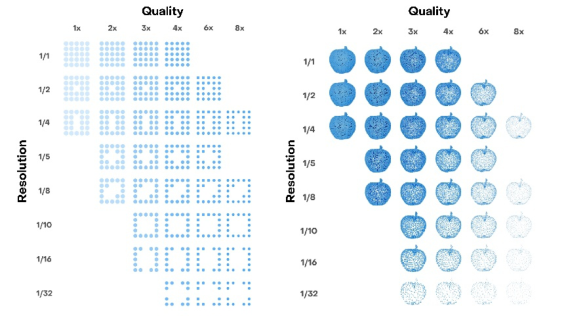
The digital demonstrator permits users to interact with all functions found on typical laser scanners, including setting functions required to conduct a laser scan. The most important setting which the user must understand is selecting resolution and quality. Determining the correct resolution and quality requires an understanding of laser scanning theory and the trade-off between resolution, quality, and time required to conduct the scan. To pro- mote student learning of this relationship, a visualization was added to the scanner screen that includes these settings (Figure 3). Ultimately, two visua- lizations were tested. The first set of visualizations consisted of a 6x6 grid of circles. Based on the resolution and quality of the scan, the circles would change in size, opacity, and number. This grid is very abstract and placed
Figure 2: A-F: access mode screens.
Visualization Enhancements to Facilitate the Use of Digital Demonstrators 185
Figure 3: Visualization comparison.Figure 4: Resolution and quality depictions.
towards the bottom of the screen to be non-intrusive. A second visualiza- tion was later tested. This visualization consists of a 3D model of an apple. The apple was chosen as a 3D object unrelated to scanning practice as it can convey intent without delivering a specific construction-related message. The apple was displayed as a point cloud that would change the point size and density based on the settings adjusted. The apple’s position was adjusted to make it appear larger and was the first element read on the screen. For both visualizations, the depicted object changes as the user modifies the resolution and quality setting. This effect is depicted in Figure 4 for both visualization schemes. Neither of these two visualizations are found on actual physical scanners.
Cognitive Walkthrough, Pilot Test, and Refinement To identify design shortcomings, the researchers first conducted a cognitive walkthrough. As described by Lewis, Polson, Wharton, and Rieman in 1990, a cognitive walkthrough is a usability inspection method designed to bring together an interface evaluation and a cognitive model (Mahatody, 2010). Researchers presented the digital demonstrator interface to a graduate stu- dent with limited exposure to scanner use. The student was asked to perform a laser scanning task using the demonstrator tool. The student verbalized his actions and described why each action was selected. The research focus was on the cognitive activities of the student, including their goals and know- ledge when performing each task. Errors were observed and recorded with particular attention to the cause of each error and the student’s description of what they were looking for at the moment. Based on this analysis, several refinements were made to the digital demonstrator.
Following the cognitive walkthrough, the digital demonstrator was used to instruct a cohort of high school students on the use of a laser scanner. These students were selected as they allowed the researchers to access test subjects who were available at that time at the Georgia Institute of Tech- nology building construction summer camp without exhausting the limited number of university-level construction students who could later participate in a more directed analysis of the tool. Clicks on the web-hosted prototype were monitored using Useberry, an online codeless prototype analytics plat- form. Time on task and errors were recorded. In general, the high school students found the prototype easy to moderately easy to use. Required refi- nements were noted, and the digital demonstrator was modified to reduce observed confusion and to permit additional actions.
Implementation With Graduate and Undergraduate Students Having conducted initial testing and refinement of the digital demonstra- tor, the resulting prototype was employed to instruct students in the use of laser scanning within courses at the Georgia Institute of Technology. The demonstrator was integrated into an undergraduate and graduate-level course during the fall 2022 semester. In both cases, the courses were on technology applications in building construction. During prior semesters, instruction in laser scanning relied on the use of FARO Focus laser scan- ners produced by Faro Technologies Inc. The School of Building Construction owns two of these scanners. Students were first instructed using a PowerPoint presentation. After this, students gathered around a scanner provided in the classroom. Here they gained practical exposure to the setup of the physical scanner. Due to the availability of only two scanners, there are typically eight to fourteen students per scanner. Under these conditions, only a few students gain hands-on experience during instruction. With the digital demonstrator available, the instructor projected the digital demonstrator on a large screen in front of the class. Students used the online prototype of the scanner to accomplish tasks as discussed. Students then used the assessment mode to test their proficiency with the setup of a laser scanner. Each student’s use of
Visualization Enhancements to Facilitate the Use of Digital Demonstrators 187
the access mode was tracked using the Useberry platform. Some undergradu- ate students were not provided with the assessment mode. All the graduate students interacted with both the access and assessment modes.
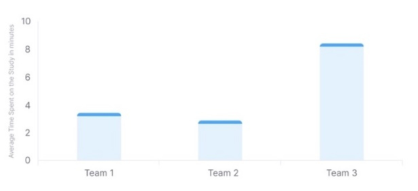
Once the students completed using the digital demonstrator, they progres- sed to setting up a physical FARO laser scanner. They worked in teams of four to six students for this task. The teams then employed the FARO scan- ner to collect scanning data of an assigned area of the Cadell Building on the Georgia Institute of Technology campus. Once the data was collected, the graduate students were asked to provide verbal team feedback on using the digital demonstrator. Undergraduate students’ feedback on the digital demonstrator was solicited using a written survey. Since not all the under- graduate students had been given hands-on access to the demonstrator, those who did not became the control group and formed a separate team for the purpose of data collection. The time required to set up the FARO scanner was monitored for each team, including the control group.
An additional experiment was conducted with students at Clemson Uni- versity’s Emerging Technologies in Construction Undergraduate course. The intent was to validate student confidence in being prepared for actual scan- ning at an institution that does not have instructional scanners available. In this course, students are exposed to methods of planning and managing construction projects with technology and, when possible, gain hands-on experience utilizing the technology in completing construction planning acti- vities. Introduction of laser scanning was consistent with course learning objectives. An attempt was made to measure effectiveness of scanner instru- ction through class exercises and a questionnaire. The class of 16 students was instructed on best practices and techniques to produce laser scans. Students practiced using the demonstrator to change settings, including scan duration, size, point distance, and visualization parameters to set resolution/quality of the scan, all critical to the scan quality.
Testing of Alternative Visualization As discussed above, two visualizations were developed as learning aides for scan resolution and quality. The first option was of a lesser fidelity and desi- gned to visually conform to the scanner screen convention used for other settings. Users of this visualization must primarily rely on theory from formal instruction, drawing on the visualization for support. The second visualiza- tion was later introduced to determine the effect of using a higher fidelity interactive depiction. This option is more prominent on the scanner screen, deviates from other screen design conventions, and facilitates setting selection with little prior understanding of scanning theory. A separate user test was conducted with five students, representing both undergraduate and graduate students. Users interacted with the higher fidelity, blue apple depiction when learning scanner operation with the digital demonstrator. Users then set up a physical scanner, as directed. The process of setting up the scanner was timed. A focus group format debriefing was then conducted to obtain and document the user’s experience.
RESULTS
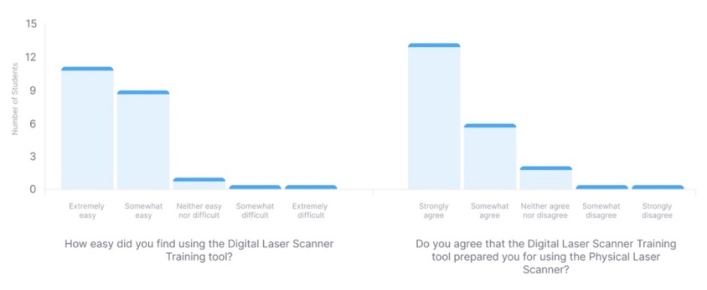
Using the digital demonstrator with undergraduate students was shown to provide effective skill training. The students were able to interact with the digita scanner successfully. Those students who used the full digital demon- strator exhibited a far better understanding of the setup of the physical scanner based on observation. Figure 5 illustrates the time required to set up the Faro laser scanner. Teams one and two used the full digital demon- strator, while members of team three had not. Team three was less clear on how to set up a scanner and appeared to fumble along, making several cor- rections as they progressed. Teams one and two set up the physical scanner quickly and without error. The undergraduate students reported finding the digital demonstrator extremely easy to use and prepared them to interact with a physical scanner (Figure 6). Students reported that the demonstrator was a beneficial tool for learning laser scanner skills. Similarly, the graduate students reported finding the scanner as being easy to interact with.
While students appreciated the value of both visualization tools used to assist with the understanding of resolution and quality, the focus group presented with the higher fidelity blue apple version reported difficulty in transitioning away from this aid. All five of these users reported a dependence on the visualization, not mentioned by any of the users of the lower fidelity version. The five students unanimously reported that the absence of this inte- ractive visualization left them not understanding the relationship and using
Figure 5: FARO scanner setup time.Figure 6: Student opinion on the digital demonstrator.
Visualization Enhancements to Facilitate the Use of Digital Demonstrators 189
an approach to the setting that was determined by the time available to scan only. They essentially guessed at the resolution and quality ratio selection. These students had relied on the intended aid as a replacement to understan- ding the requisite theory. Once the visualization was removed, they lacked the skill to perform the required action.
For the Clemson University experiment, students were surveyed to measure their readiness to use the actual scanner. Two students reported feeling fully prepared, while four reported being somewhat prepared, and two students felt that they would require additional instruction. Four students had not attended the demonstrator session, and four did not respond to the survey.
CONCLUSION
Integrating a digital demonstrator as an instructional tool for teaching stu- dents the correct setup and use of laser scanners proved to be helpful when applied in construction management courses. Testing documented that stu- dents found the demonstrator easy to understand and beneficial when first exposed to a physical scanner. Students could quickly transfer the experience gained with the digital prototype to the setup of a physical scanner. Those students who completed full training on the digital demonstrator were able to set up the physical scanner more quickly than those with limited access to the prototype.
As discussed, students exposed to the higher fidelity interactive visualiza- tion had difficulty applying the learning exercise to a physical laser scanner. This indicates that visualizations with a high level of abstraction better aid learning while using a digital demonstrator. While having a highly detailed visualization helps users understand concepts, they become heavily reliant on the intended learning aid. When designing visualizations, thought should be put into striking the right balance between abstract and detailed so that users can still perform the activities without the visualization. The size and placement of the visualization is also a factor. A large visualization draws the user’s attention, leaving them fixated on interaction. A balance should be struck when placing the visualization so that the user is aware of its presence but is not actively dependent on it to accomplish the required task.
This research was limited to a single-use demonstrator. It is anticipated that similar success would be possible with digital demonstrators of other techno- logy equipment in many areas of STEM education. Extension of the lessons learned from this study should be tested using other technologies standard in construction education. The demonstrator was designed to be used on a laptop computer screen. Several students did not bring laptops to class and relied on their smartphones when interacting with the digital demonstrator. This introduced unintended impediments to interacting with the online pro- totype. Future work would involve building a mobile version of the digital demonstrator to enable increased access.
REFERENCES
Ainsworth, S. and VanLabeke, N., 2004. Multiple forms of dynamic representation.
Learning and instruction, 14(3), pp. 241–255.
Aronsson, S., Artman, H., Brynielsson, J., Lindquist, S. and Ramberg, R., 2021.
Design of simulator training: a comparative study of Swedish dynamic decision- making training facilities. Cognition, Technology & Work, 23, pp. 117–130. Card, S. K., Mackinlay, J. D., and Schneiderman, B. 1999. Readings in information visualization: Using vision to think. San Diego, CA: Academic Press. Ebrahim, M. A. B., 2015. 3D laser scanners’ techniques overview. Int J Sci Res, 4(10),
323–331. Hegarty, M., 2004. Dynamic visualizations and learning: Getting to the difficult questions. Learning and Instruction, 14(3), 343–351. Kriz, W. C., 2003. Creating effective learning environments and learning orga-
nizations through gaming simulation design. Simulation & Gaming, 34(4), 495–511. Lewis, C., Polson, P. G., Wharton, C., and Rieman, J., 1990, March. Testing a walkthrough methodology for theory-based design of walk-up-and-use interfaces. In Proceedings of the SIGCHI conference on Human factors in computing systems, pp. 235–242. Lowe, R. K., 2004. Interrogation of a dynamic visualization during learning.
Learning and Instruction, doi: 10.1016/j.learninstruc.2004.06.003. Mahatody, T., Sagar, M., and Kolski, C., 2010. State of the art on the cognitive walkthrough method, its variants and evolutions. Intl. Journal of Human–Computer Interaction, 26(8), 741–785. Schwan, S., Garsoffky, B., and Hesse, F. W., 2000. Do film cuts facilitate the perce-
ptual and cognitive organization of activity sequences? Memory & Cognition, 28, 214–223. Spence, R., 2001. Information visualization. Essex: ACM Press.
LISTED IN THE AHFE DIGITAL BOOKSTORE CATALOGUE
Explore the complete digital volume
Training, Education, and Learning Sciences
Read this individual research paper free through the original publisher, or explore the full digital proceedings book.
ISBN 978-1-958651-85-8
Explore this ISBN in the AHFE Bookstore ↗Listed in the July 2026 bookstore catalogue; search by ISBN to confirm current availability · Digital book purchase optional