Kim Sunwoong (2023). Predictive Validity of the Vehicle Seat Comfort Score by Using the Seat Design and Testing Factors. In: Human Factors in Transportation. AHFE Open Access, vol. 95, pp. 82–87. https://doi.org/10.54941/ahfe1003794
Vehicle seat comfort engineering is one of the most important things among vari-ous seat engineering fields. Many seat engineers want to make it easier to predict and improve comfort. There were several attempts, but it was not easy to predict due to the highly subjective nature of comfort. In this study, we tried to confirm the feasibility of developing a tool that can easily predict comfort by utilizing the main design factors of seats and vehicle packages. As Consumer’s various expe-riences while using cars were defined as comfort factors and models to predict them were developed. A total of 5 cars of mid-sized sedans with various charac-teristics were selected as the subject of this study. As objective measures, dimen-sions of the seats with SAE J826 OSCAR, calculated data from force-deflection curves of the seat, and occupants package layout dimensions were selected. SLD measurement, SgRP calculation, and 3D scans were conducted for all study ve-hicle models. In order to obtain consumer evaluation results, a comfort clinic was conducted for 33 Americans (28 males and 5 females). A model for predicting overall comfort was developed by analyzing both quantitatively and qualitatively measured and evaluated data. The adjusted R2 value of the developed prediction model was 0.8047, showing very high explanatory power.
Around 30 million new vehicles are registered each year worldwide. This also means that countless engineers from all over the world are working hard to create better, more comfortable cars. These engineers not only evaluate products using various quantified indicators, but also predict and improve performance by using various types of CAE tools and/or Evaluation systems in earlier development stage when there is no product. In the automotive
Predictive Validity of the Vehicle Seat Comfort Score 83
seat engineering, it is conducted based on quantified data in various fields such as safety, performance development and evaluation, and NVH as well using various tools and equipment. In the field of seat comfort, enginee- ring was conducted using various quantitative measurement data from the past. However, there was a clear limitation for the comfort analysis in earlier development stage without a product.
Ahmadpour and her colleagues define comfort as ‘Comfort is depicted as a complex construct derived by passengers’ perceptions beyond the psycho- logical (i.e. peace of mind) and physical (i.e. physical well-being) aspects, and includes perceptual (e.g. proxemics) and semantic (e.g. association) aspects’ (Naseem Ahmadpour et al., 2014). In this way, unlike the past, when comfort was defined as the occupant’s perceived feeling by the physical characteristics of the seat from the engineering point of view, many attempts are being made to define comfort in terms of various factors, interactions, and furthermore, user experience.
Kolich proposed a conceptual framework from the drawbacks related with currently used seat comfort engineering and process as a possible mechanism. There were 4 major factors to affect vehicle seat comfort, Vehicle/Package factors, Social factors, individual factors, and seat factors. And it sugge- sted multi-layered inputs and outputs models as a qualitative framework for the development of a theoretical and methodological basis for the science of automobile seat comfort (Mike Kolich, 2008).
Basic anthropometrical factors such as sex, height, and weight and interfa- ced pressure data were used to predict aircraft seat comfort scores in Zhao’s neural network model (Chuan Zhao et al. 2018). This model consists of input layer, hidden layer, and output layer. Totally, 8 independents variables were used to predict OCI (Overall Comfort Index) with some hidden layer.
However, in these previous studies, there is a limit to predicting the comfort index, which is actually very complex, with conceptual models or studies with restrictive factors.
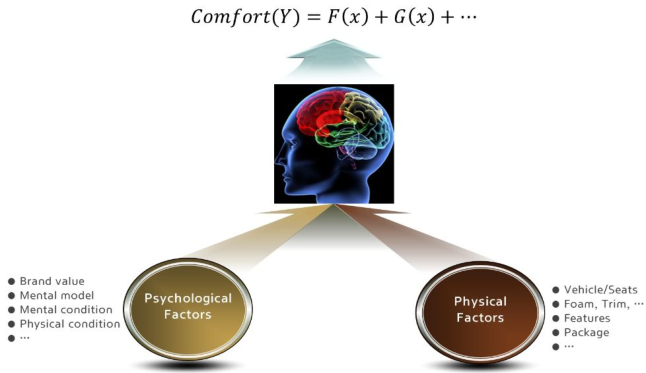
As shown in Figure 1, it is assumed that consumer’s perceived feeling about comfort and/or discomfort is affected by both physical and psychological
Figure 1: Perceived comfort conceptual model.
84 Kim
aspects in this study. The former, a physical factor of car seats, is familiar to many engineers and researchers, but the latter, a psychological factor, is of interest to some researchers and is at a level where the need for research is considered in these days.
In this study, it tried to translate from defined consumer’s perceived comfort to engineers’ or engineering language as a pilot study to improve engineering efficiency.
METHOD
It is a very difficult problem to define both/each physical and psychological factors as a single mathematical function. In this study, physical factors were selected as independent variables to test the predictability of comfort scores using design and test factors.
Totally 5 vehicles were selected from Mid-sized sedan segments which have various seat dimensions both physical properties and perceived comfort score from JDPA (JD Power and Associate) APEAL (Automotive Performance, Execution and Layout) study.
It was measured that Static Load Deflection and Hardness profile as para- meters of seat mechanical properties, Physical dimension of specified section from 3D scanned data as parameters of seat design factors, benchmark SgRP (Seating Reference Point), track travel path, and joint angles of SAE J826 at benchmark SgRP position as interior package layout parameters for each selected vehicle.
First, each vehicle’s SgRP were predicted by SAE J3103 benchmark H-point procedure. Later, SAE J826 3D manikin set to predicted standard seat posi- tion to gather Torso/Thigh/Knee angle, AHP (Acceleration Heel Points), L53 (horizontal distance from AHP to SgRP), and H30 (Vertical height from AHP to SgRP).
3D scan at predicted standard location was conducted with and without SAE J826 dummy. And, the dimensional data were calculated like as insert width, exit point, amount of penetration, bolster radius, and effective bolster radius at some specified cross-sections and centreline section. After that, the driver seat was removed to measure mechanical properties of each vehicles’ seats – SLD (Static Load Deflection) and HP (Hardness Profile).
Consumers’ comfort clinic was conducted with 33 US participants (Male 28, Female 5) - average height 173cm (154.9 ∼198.1 cm), average weight 84.8kg (44 ∼124.7kg). A questionnaire was newly developed to conduct this study with total 52 questions – 44 questions for comfort factors and 8 questions for basic informs about participants.
RESULTS
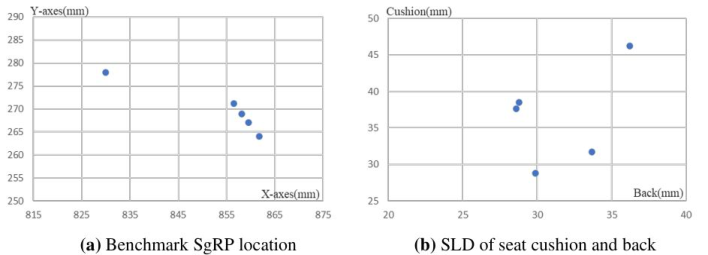
As shown in Figure 2, the occupant package layout and seat mechanical properties was different among all test vehicles. The range of L53 was 830mm ∼860mm, and H30 was 264mm ∼278mm. SLD variation of the seat back was 29mm ∼36mm, and the cushion was 29mm ∼46mm.
Predictive Validity of the Vehicle Seat Comfort Score 85
Figure 2: Test vehicles and vehicle seats measured data. (a) Shows the differences of occupant package layout of among test vehicles. (b) Shows the differences of mechanical properties (SLD) of among test vehicles.
ANOVA result showed the overall seat comfort score from consumer clinic had statistically significant differences (P < 0.05) among test vehicles (post Hoc. Study result by Turkey-Duncan: Vehicle A 7.5 > Vehicle D 7.0 > Vehicle C 6.7 > Vehicle B 6.1 ≓Vehicle E 5.9).
As a results of basic data analysis from above, it was confirmed that the experimental vehicles all had different occupant package layouts, seat mech- anical properties, and seat styling. Additionally, the perceived comfort scores were also different. From these reasons, it was assumed that the developing a prediction model from these variables are valid.
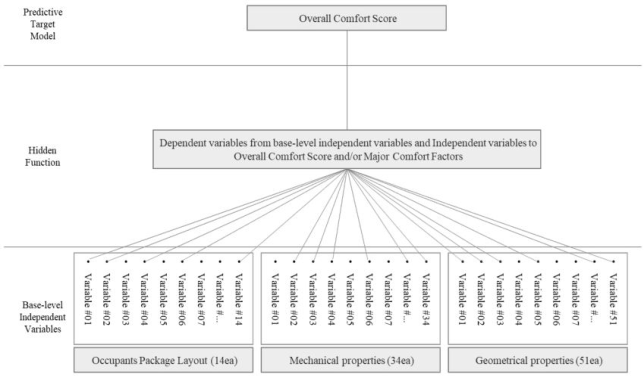
The basic conceptual model to predict overall comfort of the vehicle seats is like as Figure 3. Total 99 base-level independent variables were used to deve- lop a prediction model. There were multi-layered hidden functions between base-level independent variables and predictive target model, OCS. The pre- diction models for OSC had statistical significances (Adjusted R2 = 0.8047).
Figure 3: Basic conceptual model of predicting OCS (overall comfort score) by using the design engineering, styling, and vehicle factors.
86 Kim
The developed final prediction model applied the regression model and the rule base model at the same time.
Table 1 shows the actual feedback from consumers, prediction results, and its accuracy. As a result of the analysis, it was confirmed that the accuracy of the prediction model was at least 93%.
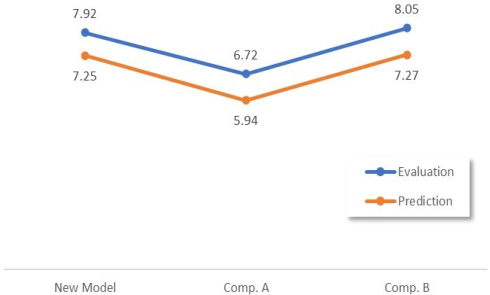
DISCUSSION AND CONCLUSION It was applied to newly developed seat to verify its validity and compare experts’ evaluation score, after developing this prediction model. Figure 4 shows that comparison results between evaluation and prediction.
There was a slight difference between the predicted and the evaluation result, but it was confirmed that the trend was similar. The similar results observed at the comparison study between consumer’s clinic and prediction results as above Table 1. In general, comfort evaluation mainly uses 10 points, 9 points, and 7 points scales. If the regression model is used without any restrictions, a situation may occur in which the predicted result value out- puts a score that exceeds the maximum scale. It is expected that the certain logic to prevent the highest score from exceeding the scale standard used to compensate for this will be applied somewhat conservatively and appear as a result.
However, through this study, it was confirmed that the prediction of the comfort score by the quantitative factors attempted was valid.
Figure 4: Comparison between evaluation and prediction results.Table 1. Prediction results and accuracy.
Table available in the original PDF paper.
Consumer’s Clinic (⃝a ) Prediction Results (⃝ b ) Accuracy(⃝a /⃝ b ) Vehicle A 7.5 7.33 97.7% Vehicle B 6.1 5.76 94.4% Vehicle C 6.7 6.3 94.0% Vehicle D 7.0 6.5 92.9% Vehicle E 5.9 5.49 93.1%
Predictive Validity of the Vehicle Seat Comfort Score 87
REFERENCES
Chuan Zhao, Sui-huai Yu, Charles Miller, Moin Ghulam, Wen-hua Li, Lei Wang, (2018) Predicting aircraft seat comfort using an artificial neural network, Human Factors and Ergonomics in Manufacturing & Service Industries, Vol.29, Issue 2, 154–162, DOI: 10.1002/hfm.20767. Mike Kolich, (2008). A conceptual framework proposed to formalize the scientific
investigation of automobile seat comfort, Applied Ergonomics, 39, 15–27. Naseem Ahmadpour, Gitte Lindgaard, Jean-Marc Robert & Bernard Pownall (2014): The thematic structure of passenger comfort experience and its relationship to the context features in the aircraft cabin, Ergonomics, DOI: 10.1080/00140139.2014.899632. Suzanne Hiemstra-van Mastrigt, Liesbeth Groenesteijn, Peter Vink, Lottie F. M.
Kuijt-Evers, (2017). Predicing passenger seat comfort and discomfort on the basis of human, context and seat characteristics: a literature review, Ergonomics, 60:7, 889–911, DOI: 10.1080/00140139.2016.1233356. Yang Zhonglian, Sun Shouqian, Gao Zenggui, Chen Yumiao, (2010). Correlation Model of Overall and local Sitting Comfort based on Rating Scales, 2010 IEEE 11th International Conference on Computer-Aided Industrial Design & Conceptual Design 1, DOI: 10.1109/CAIDCD.2010.5681272.
LISTED IN THE AHFE DIGITAL BOOKSTORE CATALOGUE
Explore the complete digital volume
Human Factors in Transportation
Read this individual research paper free through the original publisher, or explore the full digital proceedings book.
ISBN 978-1-958651-71-1
Explore this ISBN in the AHFE Bookstore ↗Listed in the July 2026 bookstore catalogue; search by ISBN to confirm current availability · Digital book purchase optional