Jisun Kim, Henrietta Howarth, Joy Richardson, John Preston (2023). User-centred generation of early-concept Mobility-as-a-Service interface designs aimed at promoting greener travel. In: Intelligent Human Systems Integration (IHSI 2023): Integrating People and Intelligent Systems. AHFE Open Access, vol. 69, pp. 616–627. https://doi.org/10.54941/ahfe1002884
Transportation Research Group, Civil, Maritime, Environmental Engineering and Science, Faculty of Engineering and the Environment, University of Southampton, Southampton, UK ↗
With the increasing focus on sustainable travel, there is a particular need for easier journey planning that connects people in areas of current high car dependency with employment and other activities using greener transport modes. Mobility-as-a-Service (MaaS), which may be accessed from a mobile application (app), allows integration of various transport modes along with booking and payment functions into a single mobility service. Careful consideration of a MaaS app interface design is required for it to encourage active and sustainable travel amongst users. This study applied the Design with Intent tool with the aim of generating novel MaaS interface design concepts to support and encourage sustainable journeys in five design workshops involving 23 participants. Participants used 22 design cards each showing a design pattern and applied example from another field as inspiration. They worked in groups to discuss a range of MaaS design ideas that may encourage more frequent use of public transport and active travel. General topics discussed within the workshops included design ideas for: providing relevant information that assists easy and efficient journey planning and execution relating to the use of sustainable travel; promoting achievement of goals and pursuit of value; helping habit formation through positive reinforcement; and enabling personalisation of information to better suit users’ specific needs in travel. Further work is needed to determine which of the resulting design ideas could be implemented within a MaaS app.
Mobility as a Service (MaaS) is a relatively new mobility concept or a tran- sport solution that integrates various mobility services and transport modes. It was initially defined as a mobility distribution model that meets users’ needs for transport through a single interface enabling planning, booking and paying (Hietanen, 2014; Heikkilä, 2014). Various mobility services are com- bined as part of a seamless offering that is typically accessed via mobile phone applications (apps). MaaS encourages people towards more sustainable travel
User-Centred Generation of Early-Concept Mobility-as-a-Service Interface Designs Aimed 617
behaviours and reorganises transport to address sustainability challenges by providing alternatives to private car ownership (Pangbourne et al. 2018; Sochor et al., 2018). Hence, larger potential uptake of MaaS could yield more societal benefits, such as reduction in personal carbon emissions and congestion. This ultimately could contribute to improvement in air quality and reduction in traffic accidents (Smith and Hensher, 2020).
In order for the potential benefits to be realised more fully, promoting users’ sustainable travel behaviour seems vital. Given the services are supplied to users through a digital platform (Kamargianni and Matyas, 2017), typi- cally a mobile app, it would be worth the effort to create the app that better assist users to select and use more sustainable travel options more effectively.
Persuasive technology that is defined as any interactive computing system developed to change people’s behaviours or attitudes has been applied to a wide range of areas. Early examples included computing systems to promote health and improve productivity at the workplace (Fogg, 2003). It also has been used in the development and verification of the effects of travel apps that encouraged users to take environmentally friendly options in various stu- dies (Anagnostopoulou et al., 2018; Bothos et al., 2014; Jylhä et al., 2013). However, the previous trials tended to show a lack of user-centredness in the development of strategies for behaviour change. This means end-users’ needs may not have been reflected in such strategies sufficiently. There- fore, this study attempted to generate design concepts and possible solutions by actively engaging users from the initial stage of the design process of a persuasive MaaS app.
User-centred design is an approach that places users at the centre of the entire design process (Wever et al., 2008). It can be effective to enhance the success and acceptance of the product (Norman and Draper, 1986; Hermawati and Lawson, 2014). Behaviour change interventions using user- centred design tended to show a higher likelihood of improving user enga- gement as it ensures the potential product facilitates positive and lasting behaviour change (McCurdie et al., 2012; Patel and Arya, 2017). In this study, users were engaged in the generating design concept stage as it is one of the user-centred design processes in which users can be actively involved (Wever et al., 2008).
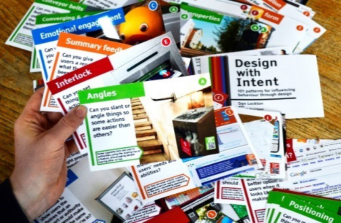
DESIGN WITH INTENT (DWI) TOOLKIT The DwI toolkit is a collection of design patterns that was created in response to the need for influencing users’ behaviour to reduce environmental impact and utilise products and systems in a more sustainable way. It is a suggestion tool that inspires design solutions by proposing techniques with examples that could be applicable to a range of target behaviours (Lockton et al., 2010). It has 101 design patterns (see the image showing examples of patterns in Figure 1) classified into eight lenses into which those patterns sharing similar considerations are grouped: Architectural, Errorproofing, Interaction, Ludic, Perceptual, Cognitive, Machiavellian and Security (Lockton et al., 2010a). Descriptions of the lenses and design patterns are provided in Appendix A and Appendix B respectively. Two different modes are suggested in terms of
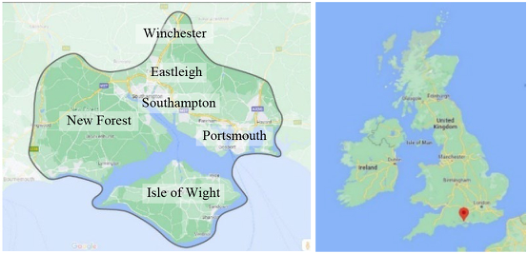
Figure 1: Examples of the design with intent design patterns (Lockton et al., 2013).Figure 2: Main areas included in the Solent Future Transport Zone (left), Map of the UK with a red mark showing the location of the Solent Future Transport Zone (right).
how to use the toolkit: inspiration mode and prescription mode. The former is more suitable in a brainstorming context where the patterns are explored informally. However, the latter is more effective when target behaviours that a designer wants to attain through design as ideal outcomes are determined (Lockton et al., 2013; Lockton et al., 2010).
DwI has been used in a number of studies investigating behaviour changes in several domains. It was applied in the creative process to facilitate idea generation for designing in-vehicle interfaces aiming to reduce fuel use and emissions (Allison and Stanton, 2020); and in the evaluation process of the Cognitive Work Analysis Design Toolkit based on its application to enhance safety at rail level crossings (Read et al., 2016). The method was used as a tool to generate end-user interface ideas for designing flight deck technology (Parnell et al., 2021).
This study was initiated and executed to inform the design of an inclu- sive MaaS app that encourages people towards sustainable travel for the Solent region. The activities were conducted as part of the Future Transport Zones trial programme funded by the UK Department for Transport. The trial programme aims to design, evaluate and deliver innovative approaches in personal mobility and sustainable urban logistics in the areas including Southampton, Portsmouth and Isle of Wight (see Figure 2).
METHOD
Five workshops sessions were organised and conducted. The main purpose was to identify insights for designing and optimising a MaaS app to promote
User-Centred Generation of Early-Concept Mobility-as-a-Service Interface Designs Aimed 619
sustainable travel behaviour by actively engaging potential end-users in the process with the application of the DwI toolkit. Prescription mode (Lockton et al., 2010a) was adopted because target behaviours were predefined and proposed to participants for developing design concepts using given DwI patterns. The target behaviours were suggested as ‘planning and conducting journeys with more use of public transport and active travel; choosing and using private car travel less often; and creating new habits of using sustainable travel’. Amongst 101 design patterns, 22 cards were used in the workshops. They were carefully selected by the researchers considering whether poten- tial ideas prompted by those cards were relevant to the design of a MaaS app interface. They were divided into two sets of cards to be used in each participant group for group activities in the workshop.
PARTICIPANTS In total, 23 participants took part in the study. The breakdown in each session was N = 8, N = 5, N = 2, N = 3 and N = 5. The sample included 14 females and 9 males aged between 18–24 years (N = 5), 25–44 years (N = 12), 45–64 years (N = 3) and 65 years or older (N = 3). They were recruited through an online advertisement posted on the University’s intranet for students and staff, as well as the researchers’ Facebook or Linkedin pages. Along with the online methods, flyers were displayed on notice boards inside the University buildings and cafes or public places around campus. The study was appro- ved by the Ethics Committee, University of Southampton (approval number: 65105.A2).
PROCEDURE Prior to the workshop, an online questionnaire was administered to parti- cipants who confirmed their attendance by email in order to obtain demo- graphic information. Upon arrival, participants were greeted and required to sign the consent form indicating that they agreed to participate in the study. They were involved in activities planned as follows. The workshop consisted of three parts including a comfort break between the second and third parts in which refreshments were offered. In the first part, participants were briefed about the background of MaaS and the goal of the project. It was followed by a group discussion on participants’ experiences of regular or frequent jour- neys and transport modes they use. In the second part, participants were introduced to the DwI tool and shown how to use it for generating design concepts and ideas. They were assigned to one or two groups for group acti- vities depending on the number of participants in each workshop session. A minimum of two and maximum of four participants were in each group. Par- ticipants in each group were given a set of 11 cards and asked to familiarise with them individually. They had an opportunity to discuss any questions about the cards and how they could apply the patterns on the cards to gene- rate design ideas at any time. Then, they were asked to create design ideas using the cards as prompts within the group and to write down or sketch to record their ideas. A variety of different coloured pens with post-it notes
and A3/A4 sheets of paper were supplied. In the third part, a nominated representative from each group explained their group’s ideas followed by a whole room discussion for feedback. At the end of the session, partici- pants were given an opportunity to vote for their favourite ideas. They were asked to write down the ideas they like the most on a post-it note and han- ded it in to the researchers. The researchers took notes of key points and ideas on the whiteboard during the discussions. All the sessions were video and audio recorded with participants’ awareness and consent. The duration of workshop was two hours. Participants received £10 as a thank you for their time.
DATA ANALYSIS Design ideas created in all five sessions were examined as follows. In the pro- cess, ideas collected from post-it notes and sketches that participants used to record their ideas, as well as notes on the whiteboard taken by the researchers during the sessions, were reviewed. First, ideas generated in each session were examined thoroughly. Similar ideas generated in the same session were grou- ped together and considered one idea. Seven ideas that were developed based on incorrect understanding about the cards were excluded. Second, those ideas from all the individual sessions apart from the seven excluded ideas were collated, reviewed and compared altogether to identify ideas without dupli- cation. At the end of the process, frequencies of ideas were calculated based on the number of sessions in which the specific ideas were discussed. This process was performed to capture recurrent patterns, regarded as meaningful ideas in this study, that could be established as themes representing partici- pants’ potential preferences or requirements from the app (Saldaña, 2021). In addition, participants’ favourite ideas from each session were reviewed. They were worth taking into account as customer preferences are associated with customer satisfaction (Singh et al., 2017) as well as repurchase inten- tion of the service or product (Haverila, 2011). Such ideas that appeared in a bigger number of sessions (higher frequency) and those that were voted as participants’ favourite ideas were analysed and interpreted in the following sessions.
RESULT
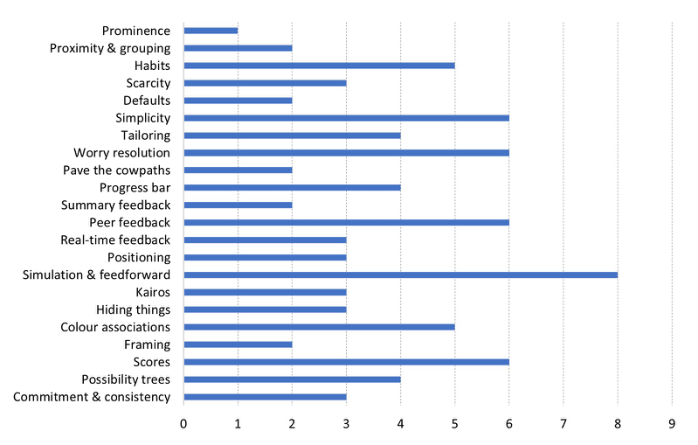
In total 83 design ideas were developed in the five sessions as shown in Figure 3. All the selected 22 cards contributed to generating those ideas. Due to constraints of space, only the key ideas that were most frequently mentio- ned across the five sessions and the ideas voted on by participants as favourite ideas will be delineated.
Out of 83 ideas, five ideas were mentioned most frequently (in three work- shop sessions), and they were identified as key ideas as follows. Names of the cards used as inspirations are presented in brackets. The ideas included: Idea 1 (I1): App shows how much money the user is saving and provides cost comparison preview to help them select an economical option (Simulation & feedforward). I2: App reports on what the user has been doing to make
User-Centred Generation of Early-Concept Mobility-as-a-Service Interface Designs Aimed 621
Figure 3: Number of ideas created for each card.
changes in the future in terms of calories burned, CO2 emissions produced and money saved (Summary feedback). I3: App shows journey progress in percentage and distance travelled with alerts about the upcoming route con- ditions (e.g., hills) (Progress bar). I4: App shows progress bar for the user’s different goals, for example, how much money they have saved this month; how much they have reduced their private car usage or saved CO2 emissi- ons, and how many trees are equivalent to them; how much weight they have lost, or how active they have been (Progress bar). I5: App offers information about main, popular, cycle, flat and well-lit routes. This could be enabled by allowing users to share which routes they have been on for other users can see. The routes should be easily seen and accessed in the app (Pave the cowpaths).
In total, 16 ideas were identified as participants’ favourite ideas. Names of the cards used as prompts are shown in brackets. The ideas were as follows: Favourite Idea 1 (F1): App predicts traffic and route at certain time and direct the user to routes with less traffic (Possibility trees). F2: App shows achieva- ble options or goals to assist to get people out of cars gradually (Possibility trees). F3: App presents route options and topography, such as cycle lane, route complexity and gradient and enables the user to filter those options (Possibility trees). F4: App gives warning about heavy traffic or emission levels through push notification so the user can avoid using cars (Kairos). F5: App provides real-time weather reports through push notification so the user can decide on a more environmentally friendly travel mode, such as cycling or walking on a sunny day (Kairos). F6: same as I1 (Simulation & feedforward). F7: App presents how environmentally conscious the user’s travel choice is by showing the level of CO2 emissions, visualising and comparing greenness of the choices with other routes in percentage (Simulation & feedforward). F8: Same as I2 (Summary feedback), F9: Same as I4 (Progress bar), F10: Same as
I5 (Pave the cowpaths). F11: App makes suggestions prioritising users’ travel history, such as frequent or regular journeys and routes, users’ behaviours and adapts search results (e.g., suggesting greener modes as the level of the user’s CO2 emissions increased) (Tailoring). F12: App enables the user to perso- nalise their journey planning prioritising their needs and goals, such as CO2 emissions, active travel time, calories burned and money saved (Tailoring). F13: App presents best route options first depending on the user’s needs and priorities, for example, quickest or easiest route for cycling, well-lit routes. It does not make car options as default (Defaults). F14: App provides incen- tives for frequent use of sustainable travel modes for positive reinforcement (Habits). F15: App helps users develop habits to achieve their goals regar- ding steps taken, calories burned, environment, cost-saving, time-saving, and health using gamification (Habits). F16: App groups together travel options that have similar functions and provides related information, for instance, providing information about which station to use, general facilities, storage, changing facilities for cycling, or information about accessibility (Proximity & grouping).
DISCUSSION
Interpretation is provided based on the analysis of the most frequently mentioned ideas and participants’ favourite ideas.
Regarding the most frequently addressed ideas, participants expressed their needs of a MaaS app to support cost-effectiveness of their travel by ena- bling them to preview and compare cost of options (I1). They also wanted the app to help them achieve their goals that result in positive conseque- nces to themselves, the society or the environment. This could be enabled by reviewing their activities relating to burning calories, saving money and CO2 emissions (I2, I4). They expressed the need for effective journey imple- mentation and related decision making. This could be facilitated by showing journey progress and suggesting main or popular route choices of others (I3, I5).
Participants’ favourite ideas were mainly organised into four main cate- gories: 1) supporting efficient journey planning and execution; 2) facilitating achievement of goals and pursuit of value; 3) helping habit formation; and 4) enabling personalisation. First, they discussed requirements for a MaaS app to assist effective decision making for journey planning and execution to bet- ter suit their needs (F1, F3, F4, F5, F10, F13, F16). They were linked to app features that could facilitate ease of route selection for sustainable travel by prioritising regular, popular or more suitable route options. This could sup- port the user’s needs for saving time and the environment, enhancing comfort and safety. Ultimately this is to stimulate use of public transport and active travel. Furthermore, some of the ideas pertained to reducing the negative consequences of private car use including heavy traffic and CO2 emissions (F1, F4) discouraging people from using private cars (F13). Using nudges provided in a timely manner was also proposed as a facilitator in a few of those ideas (F1, F4, F5). Second, participants showed their preferences for a MaaS app to help pursue their values in travel (F2, F7, F8, F9). They were
User-Centred Generation of Early-Concept Mobility-as-a-Service Interface Designs Aimed 623
linked to promote users’ goals achievement focusing on cost effectiveness, environmental sustainability, time, safety and health. Relevant suggestions included a MaaS app that allows the user to easily see and compare cost and the level of greenness of various possible travel options (e.g., the TripShift app), and enables them to check their progress on how well they have per- formed to attain their goals. Offering feedback on a regular basis was also recommended. The suggestions may facilitate changes in future behaviours based on the reflection of their previous behaviours. Third, habit formation (F14, F15) through positive reinforcement was mentioned. Relevant ideas were proposed, for example, providing incentives for frequent use of sustai- nable travel. In addition, giving the user motivations to achieve their goals related to health, finance and time as gamification. This is to facilitate repe- tition of desired behaviour through motivational mechanisms that leads to automatic behavioural process (Robson et al., 2015). Lastly, personalisation (F11, F12) was discussed as a tool to tailor search results and route opti- ons to better suit the user’s specific needs for enhancing health, finance and environmental sustainability by using sustainable travel.
Overall, participants presented a range of design ideas inspired by the DwI patterns. Those ideas may be linked to what they want from the future MaaS app as well as how it could support such preferences. The generated ideas were related to provision of relevant information to assist easy and efficient journey planning and execution prioritising cost- and time-efficiency, envi- ronmental sustainability, safety, convenience and comfort. A key focus was placed on boosting the use of sustainable travel by making it easy and sui- ting the user’s preferences better. Preferences for a MaaS app to maximise users’ goal achievement and pursuit of value related to cost, time, environ- ment, safety and health. Some of the generated ideas were associated with habit formation that may result in attaining benefits from those priorities linked to cost, time, convenience and environment. Positive reinforcement could be considered as a means to strengthen change in behaviour to become a habit. Personalisation was suggested as a possible method to support the user’s needs and goals linked to those priorities defined in the habit formation category. Offering timely nudges, regular feedback could perform as a tool to facilitate travel behaviour change.
One of the widely known advantages of a MaaS app is its technological integration for planning, booking and paying for mobility services through a single platform (Kamargianni and Matyas, 2017). The needs and require- ments identified in this study could offer more elaborate guidance in how to design and optimise a MaaS app to have stronger benefits and reasons for users to use it beyond what has been argued in the existing literature. Recur- ring themes such as cost- and time-efficiency, convenience, comfort and safety in this study – in line with the widely accepted criteria for public transport service quality (Randheer et al., 2011) – should undoubtedly be considered for designing a MaaS app. Along with such factors, focus should be given to environmental sustainability that repeatedly appeared in the workshop discussions. Frequent mention has been made that MaaS encourages people to use more sustainable travel modes (Pangbourne et al., 2018). In response
to the aim, the design ideas developed in this study could contribute to desi- gning a MaaS app to initiate and strengthen desired changes in people’s travel behaviour encouraged by the app.
CONCLUSION
This study aimed to develop insights for designing and optimising a MaaS app that promotes users’ behaviour change towards sustainable travel. It was initiated in the circumstances that persuasive technology applied in related approaches to developing persuasive travel apps lacked in user-centredness. Workshops with potential end-users were conducted to create design ideas for a MaaS app that could encourage sustainable travel applying the DwI toolkit. In total, 83 ideas were generated inspired by all the 22 down-selected DwI cards. Four main categories of ideas were identified: providing rele- vant information to enable easy and efficient sustainable journey planning and execution; supporting users’ goal achievement and pursuit of value; assi- sting habit formation through reinforcement; and allowing personalisation of information to better suit users’ specific needs in travel. Future work would be to further identify how those ideas could be directly implemented in a MaaS app. Considerations of gender and age inclusivity may need to be given that could contribute to more effective usage and wider acceptance of the app.
ACKNOWLEDGMENT
This study was funded by the UK Department for Transport as part of the Solent Future Transport Zone programme.
REFERENCES
Allison, C.K. and Stanton, N.A., 2020. Ideation using the “Design with Intent” toolkit: A case study applying a design toolkit to support creativity in developing vehicle interfaces for fuel-efficient driving. Applied ergonomics, 84, p. 103026. Anagnostopoulou, E., Bothos, E., Magoutas, B., Schrammel, J. and Mentzas, G.,
2018. Persuasive technologies for sustainable mobility: State of the art and emerging trends. Sustainability, 10(7), p. 2128. Bothos, E., Mentzas, G., Prost, S., Schrammel, J. and Röderer, K., 2014. Watch your Emissions: Persuasive Strategies and Choice Architecture for Sustainable Decisions in Urban Mobility. PsychNology Journal, 12(3). Fogg, B.J., 2003. Persuasive Technology: Using Computers to Change What We think
and Do. Morgan Kaufmann, San Francisco. Haverila, M., 2011. Mobile phone feature preferences, customer satisfaction and repurchase intent among male users. Australasian Marketing Journal (AMJ), 19(4), pp. 238–246. Heikkilä, S., 2014. Mobility as a Service – A Proposal for Action for the Public
Administration, Case Helsinki. MSc dissertation, Aalto University. Hermawati, S. and Lawson, G., 2014. Managing obesity through mobile phone applications: a state-of-the-art review from a user-centred design perspective. Personal and Ubiquitous Computing, 18(8), pp. 2003–2023. Hietanen, S. 2014. “Mobility as a Service”—The new transport model? Eurotran-
sport, 12(2), 2–4.
User-Centred Generation of Early-Concept Mobility-as-a-Service Interface Designs Aimed 625
Jylhä, A., Nurmi, P., Sirén, M., Hemminki, S. and Jacucci, G., 2013, September. Matkahupi: a persuasive mobile application for sustainable mobility. In Proceedings of the 2013 ACM conference on Pervasive and ubiquitous computing adjunct publication (pp. 227–230). Kamargianni, M. and Matyas, M., 2017. The business ecosystem of mobility-as-
a-service. In transportation research board (Vol. 96). Transportation Research Board. Lockton, D., Harrison, D. and Stanton, N.A., 2010. The Design with Intent Method: A design tool for influencing user behaviour. Applied ergonomics, 41(3), pp. 382–392. Lockton, D., Harrison, D. and Stanton, N.A., 2010a. Design with intent: 101 patterns
for influencing behaviour through design v.1.0. Windsor: Equifine. Lockton, D., Harrison, D. and Stanton, N.A., 2013. Exploring design patterns for sustainable behaviour. The Design Journal, 16(4), pp. 431–459. McCurdie, T., Taneva, S., Casselman, M., Yeung, M., McDaniel, C., Ho, W. and
Cafazzo, J., 2012. Health consumer apps: the case for user-centered design. Biomedical instrumentation & technology, 46(s2), pp. 49–56. Norman, D.A. and Draper S.W., 1986. User-Centred System Design: New Perspective on Human-Computer Interaction. Lawrence Earlbaum Associate, Hillsdale. Pangbourne, K., Stead, D., Mladenovi´c, M. and Milakis, D., 2018. The case of mobi-
lity as a service: A critical reflection on challenges for urban transport and mobility governance. In Governance of the smart mobility transition. Emerald Publishing Limited. Parnell, K.J., Banks, V.A., Allison, C.K., Plant, K.L., Beecroft, P. and Stanton, N.A.,
2021. Designing flight deck applications: combining insight from end-users and ergonomists. Cognition, Technology & Work, 23(2), pp. 353–365. Patel, S. and Arya, M., 2017. The BUS framework: a comprehensive tool in creating an mHealth app utilizing behavior change theories, user-centered design, and social marketing. Journal of mobile technology in medicine, 6(1), p. 39. Randheer, K., Al-Motawa, A.A. and Vijay, P.J., 2011. Measuring commuters’ perce-
ption on service quality using SERVQUAL in public transportation. International journal of marketing studies, 3(1), p. 21. Read, G.J., Salmon, P.M. and Lenné, M.G., 2016. When paradigms collide at the road rail interface: evaluation of a sociotechnical systems theory design toolkit for cognitive work analysis. Ergonomics, 59(9), pp. 1135–1157. Robson, K., Plangger, K., Kietzmann, J.H., McCarthy, I. and Pitt, L., 2015. Is it all
a game? Understanding the principles of gamification. Business horizons, 58(4), pp. 411–420. Saldaña, J., 2021. The coding manual for qualitative researchers. The coding manual for qualitative researchers, pp. 1–440. Smith, G. and Hensher, D.A., 2020. Towards a framework for Mobility-as-a-Service
policies. Transport Policy, 89, pp. 54–65. Singh, N., Srivastava, S. and Sinha, N., 2017. Consumer preference and satisfaction of M-wallets: a study on North Indian consumers. International Journal of Bank Marketing. Sochor, J., Arby, H., Karlsson, I.M. and Sarasini, S., 2019. A topological approach
to Mobility as a Service: A proposed tool for understanding requirements and effects, and for aiding the integration of societal goals. Research in Transportation Business & Management, 27, pp. 3–14. Wever, R., Van Kuijk, J. and Boks, C., 2008. User-centred design for sustainable behaviour. International journal of sustainable engineering, 1(1), pp. 9–20.
APPENDIX A Lens Summary of description
Perceptual (P) The perceptual lens addresses how users perceive patterns and meanings while interacting with systems and puts it into forms to inspire designers to think about how to influence user behaviour Cognitive (C) The cognitive lens relates to techniques helping designers use the knowledge on how users make interaction decisions that could be used to influence user behaviour Architectural (A) The architectural lens employs techniques to affect user behaviour through environmental design Interaction (I) Interaction lens suggests common interface design elements where users’ interaction with the system affects the way their behaviour is influenced. Machiavellian (M) The Machiavellian lens includes design patterns that show an ‘end justifies the means’ approach applied to control and influence users Ludic (L) Techniques for influencing behaviour that can be derived from games or playful interactions Errorproofing (E) The errorproofing lens helps designers to create a product or a system that helps users work without making an error (Lockton et al., 2010a).
User-Centred Generation of Early-Concept Mobility-as-a-Service Interface Designs Aimed 627
APPENDIX B Card (Lens) Summary of prompt
Prominence (P) Directing users’ attention to the intended place by making it more prominent Proximity & grouping (P)
Grouping elements so that users can perceive those elements have similar functions Habits (C) Making it easy for users’ new behaviours to become habitual Scarcity (C) Emphasising that a resource is running out or limited in quantity Defaults (E) Making the default setting to stimulate the preferred behaviour of users Simplicity (A) Structuring things more simply and clearly to make it easier for users to perform the intended behaviour Tailoring (I) Enabling systems’ functions to be adapted to match users’ needs and abilities Worry resolution (M)
Helping users relieve worry about their behaviour (after having suggested it) Pave the cowpaths (A)
Recognising some of the users’ desired paths and codifying them into the system Progress bar (I) Letting users know their progress towards reaching a goal Summary feedback (I)
Providing users with a report on what they have been doing or the consequences Peer feedback (I)
Enabling other users of the system to give users feedback on their behaviour Real-time feedback (I)
Letting users know how their behaviours affect the system real time Positioning (A) Rearranging things to guide users to interact with them in the desired location Simulation & feedforward (I)
Providing users with a preview or simulation of the results of different actions or choices Kairos (I) Giving users a suggestion at the right moment to promote behaviour change Hiding things (A)
Hiding functions or elements you would prefer users not to use Colour associations (P)
Using colours to show associations between specific behaviours/outcomes Framing (C) Showing choices in a way that frames the available options more positively Scores (L) Giving users feedback on their behaviours as a score or allowing them to compare to a reference point Possibility trees (P)
Giving users a map of the routes/choices to use for achieving different goals Commitment & consistency (C)
Encouraging users to commit to a goal and assisting them to behave consistently with the commitment
(Lockton et al., 2010a).
LISTED IN THE AHFE DIGITAL BOOKSTORE CATALOGUE
Explore the complete digital volume
Intelligent Human Systems Integration (IHSI 2023): Integrating People and Intelligent Systems
Read this individual research paper free through the original publisher, or explore the full digital proceedings book.
ISBN 978-1-958651-45-2
Explore this ISBN in the AHFE Bookstore ↗Listed in the July 2026 bookstore catalogue; search by ISBN to confirm current availability · Digital book purchase optional