Jan Mayer, Roland Jochem (2023). Quality forecasts in manufacturing using autoregressive models. In: Intelligent Human Systems Integration (IHSI 2023): Integrating People and Intelligent Systems. AHFE Open Access, vol. 69, pp. 295–301. https://doi.org/10.54941/ahfe1002848
Companies in the manufacturing industry are facing a variety of challenges such as increasing product complexity and variety and the accompanying complexity of production processes. The developments for more sustainability and optimized use of resources are additional societal requirements. Consequently, the demands of efficient solutions in quality management are also increasing. Innovative processes are needed to meet industrial challenges. Therefore, enhanced availability of data in production offers an opportunity. Hence, the combination of associated process and manufacturing knowledge and data availability creates the possibility to improve product- and process-related quality as well as the use of resources. As a consequence, machine learning methods are used to utilize and evaluate the collected data volumes. Their application in quality control enables the operation of smart solutions like the detection of anomalies in both product and process quality. However, there is no standardized algorithm to implement in any desired production environment. Conclusively, the application of specific algorithms is highly dependent on the desired project output, human factors and the underlying infrastructure. As main manufacturing branch, mass production combines the potential benefits of machine learning applications and their occurring challenges for product and process and monitoring. Existing reporting tools like the statistical process control (SPC) enhance process owners to continuously monitor manufactured products and processes. Nonetheless, the execution of the SPC is naturally reactive, once the monitored products have been already produced. Thus, process owners require a proactive, user friendly and interactive forecast application regarding their product and process quality.Predictive quality control is one way of improving product- and process-related quality while taking advantage of greater data availability. It represents an implementation of quality control in conjunction with data-driven quality forecasting. This application enables companies to conduct data-driven forecasts of product- and process-related quality. The aim is to use machine predictions as a basis for decision-making for action measures to be derived by the user. On the basis of the large amounts of data and algorithmic evaluation, measures can be derived by process and utilization investigations. Among other things, future events with influence on the quality can be controlled in an improved way. In quality management, decision-making processes are based on extensive data collection and analysis. Predictive quality should be seen as a supplement to conventional methods, e.g. SPC.Convenient implementation methods are key to achieve effective quality monitoring in terms of product and process control. For this reason, automated machine learning can be used to ease the realization of forecasting methods. Specifically, autoregressive models are robust and optimized statistical methods which fit to both forecasts of product and process quality. An observed evaluation metric like the mean absolute error for the next ten forecast items has been decreased by more than 50% from 0.141 to 0.66 with an underlying data range from 0.38 to 1.998. Since this calculation was processed including a univariate feature vector, improvements can be achieved by adding connected features, i.e. sensor data, for a higher accuracy in the forecasting results.
Companies in the manufacturing industry are facing a variety of challenges such as increasing product complexity and variety and the accompanying complexity of production processes (Goshime et al., 2019). The develo- pments for more sustainability and optimized use of resources are additional societal requirements (Herrmann et al., 2014). Consequently, the demands of efficient solutions in quality management are also increasing. Innovative processes are needed to meet industrial challenges. Therefore, enhanced avai- lability of data in production offers an opportunity (Wuest et al., 2016). Hence, the combination of associated process and manufacturing know- ledge and data availability creates the possibility to improve product- and process-related quality as well as the use of resources. Established moni- toring procedures enclosed in operative quality management benefit from this development to create proactive process intervention. As a consequence, machine learning methods are used to utilize and evaluate the collected data volumes. Their application in quality control enables the operation of smart
solutions like the detection of anomalies in both product and process qua- lity (Hyun Park et al., 2017). Recent research effort has been concentrating on single quality measurements and their prediction using high dimensio- nal feature vector (Möhring et al., 2016; Teinemaa et al., 2019; Viharos & Jakab, 2021). However, there is no standardized algorithm to implement in any desired production environment. Especially in companies which contain a lower maturity degree in digitization and analytical prospects. Conclusi- vely, the application of specific algorithms is highly dependent on the desired project output, human factors and the underlying infrastructure.
This paper focuses on a broad industrial approach for the application of quality measurements and further create forecasts of process qualification. The outcome leads to a proactive expert system providing novel intervention procedures in manufacturing and ramp up of production machinery.
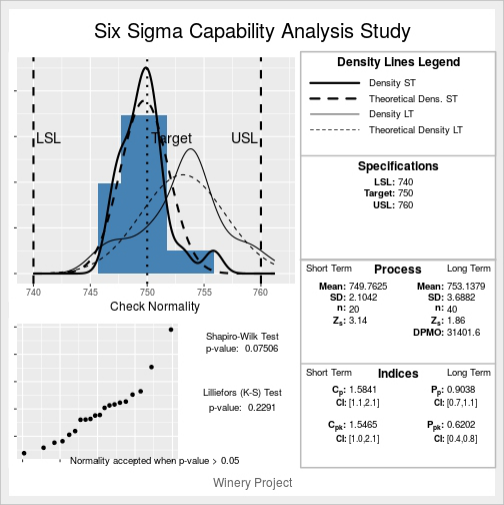
Procedures for Process and Product Control Existing reporting and monitoring tools like statistical process control (SPC) enhance process owners to continuously track manufactured products and processes. Nonetheless, the execution of the SPC is naturally reactive, as the monitored products have been already produced. This continuity for evaluating manufacturing processes is a common procedure to describe the capabilities of machinery in manufacturing industries. Therefore, multiple descriptive indices like process potential (Cp) and process performance (Cpk) are calculated from samples to assess manufactured products in relation to a distinct quality feature (Kane, 1986). Maintaining this evaluation over time allows interpretations about process quality. To achieve this informa- tion, it is sufficient for the evaluation to assess a measurable quality feature concerning its numerical characteristics. Furthermore, upper and lower spe- cification limits (USL, LSL) are introduced by the process owners to define hard limits once the process is not in the desired quality range (MacGregor & Kourti, 1995). This procedure is described in literature as process qualifica- tion and is part of the SPC (Tsung et al., 2008). In spite of the broad industrial application of the SPC, describing samples does not allow a real- time eva- luation of desired process capabilities. In addition, non-normal distributions of the chosen samples or multi-stage manufacturing processes decrease the interpretation of the process and its performance (Nikzad et al., 2018).
The quality range is the deviation of the optimum measurement in positive and negative direction, i.e. USL and LSL. To what extent the quality range is taken is individually defined by the process owner (Bahria et al., 2019). The letter s corresponds to the estimated standard deviation of the process distribution.
Cp = UCL −LCL
6s (1)
µ −LCL
(2)
Cpk = Min
3s ; UCL −µ
3s
To finally specify if the process is qualified, a number of around 130 obse- rvations of the quality measurement is recommended. Thus, to find out what
Quality Forecasts in Manufacturing Using Autoregressive Models 297
Figure 1: Six sigma process qualification dashboard (Cano et al., 2020).
kind of distribution is present, a statistical test and a histogram are used for the visualization of the result. This step is used to check if the process distribu- tion is skewed or if the variance of the distribution is too wide for producing too many products outside the desired quality range, indicated by the Cp and Cpk value. The overarching concept can be found within methodologies of Six Sigma, which developed in the last years more Proactive Process Intervention via Process and Product Quality Prediction
As main manufacturing branch, mass production combines the potential benefits of machine learning applications and their occurring challenges for product and process and monitoring. Thus, process owners require a proactive, user friendly and interactive forecast application regarding their product and process quality. Predictive quality control is one way of impro- ving product- and process-related quality while taking advantage of greater data availability (Wuest et al., 2014). It represents an implementation of quality control in conjunction with data-driven quality forecasting. This application enables companies to conduct data-driven forecasts of product- and process-related quality. The aim is to use machine predictions as a basis for decision-making for action measures to be derived by the user (Möh- ring et al., 2016). On the basis of the large amounts of data and algorithmic evaluation, measures can be derived by process and utilization investigati- ons. Among other things, future events with influence on the quality can be controlled in an improved way. In quality management, decision-making
298 Mayer and Jochem
processes are based on extensive data collection and analysis. Due to the lack of data integration of quality management in general data collection in manufacturing, univariate forecasting using autoregressive models is used to overcome time consuming data processing steps. Nonetheless, Predictive quality control should be seen as a supplement to conventional methods, e.g. SPC.
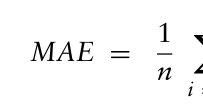
Since the Cpk-value evaluates process quality over time, the forecast of process qualification handles single product measurements and time series. Similar applications of univariate forecasting are wide spread across multi- ple industry sections like healthcare, gas or tourism (Lim & Zohren, 2020). However, due to the individualized case adaption, frameworks like automa- ted machine learning (AutoML) arose due to the last years (Hutter et al., 2019). Assessing the performance of self-learning applications like AutoML indicates no significant degradation (Paldino et al., 2021). Corresponding methodological applications create individualized ML pipelines and make use of autoregression. Autoregressive models investigate relationships based on values coming from historical parametrics of a single dependent variable (Kumar Soother et al., 2021). The evaluation criterion Mean Absolute Error (MAE) is calculated to decide which predictive algorithm setting contains least deviation to historical observations. Hence, the MAE forms the mean of all deviations with regard to the prognosis and the underlying basic truth according to the following formula:
n X (3) bYi −Yi
Equation reproduced from the original PDF.
Designing univariate forecasting procedures are dealing with less adjustment parameters than usual ML approaches. Nonetheless, predicting quality mea- surements is mainly influenced by the human factors interpreting the output (Joiner, 2007). In addition, the lead time of the manufacturing equipment is of great importance, as it defines the length of the forecast window. Therefore, short-, medium- and long-term forecast windows are assessed within the case studies and predictions outside the quality range are shown. Real and forecast Cpk values from the last 130 produced outputs indicate if a process intervention was truly recommended assuming the process is normally distributed.
The first application of the forecasting approach is examined with a high variance in the input data coming from a semiconductor manufacturer. The quality control takes place after 176 processing steps each representing a processing time of 1 second. The design of the autoregressive model is chosen to forecast the output of the next quality control ahead, once another product is manufactured. The true Cpk value refers to 0.106073. As can be seen in table 1, the forecasts which have been made are all within the specification limits of the quality range. Due to the low limit of the Cpk value, a process intervention would have been recommended in any case. However, the model is biased into the direction of predicting failures which can be seen from the decreasing Cpk value and the increasing MAE. This development is affected
Quality Forecasts in Manufacturing Using Autoregressive Models 299
Table 1. Results from the semiconductor case study.
Table available in the original PDF paper.
Forecast Window Forecast within Quality Range Forecast Cpk MAE Short-term (1 Step) 100% True 0.105892 0.016 Medium-term (5 Step) 100% True 0.103495 0.048 Long-term (10 Step) 100% True 0.099043 0.078
Table 2. Results from the milling case study.
Table available in the original PDF paper.
Forecast Window Forecast within Quality Range Forecast Cpk MAE Short-term (1 Step) 100% True 0.593069 10.247 Medium-term (5 Step) 100% True 0.575222 6.943 Long-term (10 Step) 100% True 0.602623 5.804
by the large amount of failures within the input data characterized in 971 observations.
As second case study, a data set from a mining operator is evaluated. On the contrary to the semiconductor process, this process is more stable and displays the percentage of silica which represents the quality measurement. As synthetic specification limits the quality range can be between 5% and 30%. One observation represents a sample drawn hourly from the produ- ction machine. The true Cpk value refers to a number of 0.595090. According to the quality prediction, similar results can be seen in Table 2. All predicted results were predicted within the specification limits. Analogous to the first case study, the Cpk value is decreasing. This is caused by the single time step prediction, which is not as accurate as the other scenarios. In spite of the outlier prediction, the model is improving with larger time frames as forecasting window.
CONCLUSION
Forecasting of quality measurements in manufacturing is providing domain experts valuable knowledge about future events of production machinery. The extension of established quality control procedures associated to Six Sigma can be accomplished by higher data volumes and faster data processing steps. The results of two real world case studies indicate the broad applica- tion potential of autoregressive models in quality control. Furthermore, other performance indicators can be derived by the prediction of single quality measurements, i.e. the Cpk value.
Nonetheless, there are limitations connected to the accuracy of the data collection and the necessity to predict as accurate as possible. There might be dependencies to the distinct applications decreasing the benefit of qua- lity forecasts in manufacturing. In addition, the input into the autoregressive models do not include additional sensor data, which can make the analysis less biased, but also less flexible in its application.
300 Mayer and Jochem
ACKNOWLEDGMENT
The research leading to this work has received funding from the Euro- pean Union’s Horizon 2020 research and innovation program under Grant Agreement No: 958205.
REFERENCES
Bahria, N., Chelbi, A., Bouchriha, H., & Dridi, I. H. (2019). Integrated production, statistical process control, and maintenance policy for unreliable manufactu- ring systems. International Journal of Production Research, 57(8), 2548–2570. https://doi.org/10.1080/00207543.2018.1530472 Cano, E. L., Moguerza, J. M., & Corcoba, M. P. (2020). Quality Control with R.
https://www.qualitycontrolwithr.com/package.html Goshime, Y., Kitaw, D., & Jilcha, K. (2019). Lean manufacturing as a vehicle for improving productivity and customer satisfaction. International Journal of Lean Six Sigma, 10(2), 691–714. https://doi.org/10.1108/IJLSS-06-2017-0063 Herrmann, C., Schmidt, C., Kurle, D., Blume, S., & Thiede, S. (2014). Sustai-
nability in manufacturing and factories of the future. International Journal of Precision Engineering and Manufacturing-Green Technology, 1(4), 283–292. https://doi.org/10.1007/s40684-014-0034-z Hutter, F., Kotthoff, L., & Vanschoren, J. (2019). Automated Machine Learning.
Springer International Publishing. https://doi.org/10.1007/978-3-030-05318-5 Hyun Park, S., Seon Shin, W., Hyun Park, Y., & Lee, Y. (2017). Building a new culture for quality management in the era of the Fourth Industrial Revolu- tion. Total Quality Management & Business Excellence, 28(9-10), 934–945. https://doi.org/10.1080/14783363.2017.1310703 Joiner, T. A. (2007). Total quality management and performance. Interna- tional Journal of Quality & Reliability Management, 24(6), 617–627. https://doi.org/10.1108/02656710710757808 Kane, V. E. (1986). Process Capability Indices. Journal of Quality Technology, 18(1),
41–52. https://doi.org/10.1080/00224065.1986.11978984 Kumar Soother, D., Hussain Kalwar, I., Hussain, T., Shankar Chowdhry, B., Mehran Ujjan, S., & Din Memon, T. (2021). A Novel Method Based on UNET for Bearing Fault Diagnosis. Computers, Materials & Continua, 69(1), 393–408. https://doi.org/10.32604/cmc.2021.014941 Lim, B., & Zohren, S. (2020). Time Series Forecasting With Deep Learning: A Survey.
Advance online publication. https://doi.org/10.48550/arXiv.2004.13408 MacGregor, J. F., & Kourti, T. (1995). Statistical process control of multivariate processes. Control Engineering Practice, 3(3), 403–414. https://doi.org/10.1016/0967-0661(95)00014-L Möhring, H.-C., Nguyen, Q. P., Kuhlmann, A., Lerez, C., Nguyen, L. T., & Misch, S.
(2016). Intelligent Tools for Predictive Process Control. Procedia CIRP, 57, 539–544. https://doi.org/10.1016/j.procir.2016.11.093 Nikzad, E., Amiri, A., & Amirkhani, F. (2018). Estimating total and spe- cific process capability indices in three-stage processes with measurement errors. Journal of Statistical Computation and Simulation, 88(15), 3033–3064. https://doi.org/10.1080/00949655.2018.1498096 Paldino, G. M., Stefani, J. de, Caro, F. de, & Bontempi, G. (2021). Does AutoML Outperform Naive Forecasting? In The 7th International conference on Time Series and Forecasting (p. 36). MDPI. https://doi.org/10.3390/engproc2021005036
Quality Forecasts in Manufacturing Using Autoregressive Models 301
Teinemaa, I., Dumas, M., La Rosa, M., & Maggi, F. M. (2019). Outcome-Oriented Predictive Process Monitoring. ACM Transactions on Knowledge Discovery from Data, 13(2), 1–57. https://doi.org/10.1145/3301300 Tsung, F., Li, Y., & Jin, M. (2008). Statistical process control for multistage
manufacturing and service operations: a review and some extensions. Interna- tional Journal of Services Operations and Informatics, 3(2), Article 19333, 191. https://doi.org/10.1504/IJSOI.2008.019333 Viharos, Z. J., & Jakab, R. (2021). Reinforcement Learning for Stati- stical Process Control in Manufacturing. Measurement, 182, 109616. https://doi.org/10.1016/j.measurement.2021.109616 Wuest, T., Irgens, C., & Thoben, K.-D. (2014). An approach to monitoring quality in manufacturing using supervised machine learning on product state data. Journal of Intelligent Manufacturing, 25(5), 1167–1180. https://doi.org/10.1007/s10845- 013-0761-y Wuest, T., Weimer, D., Irgens, C., & Thoben, K.-D. (2016). Machine learning in
manufacturing: advantages, challenges, and applications. Production & Manufa- cturing Research, 4(1), 23–45. https://doi.org/10.1080/21693277.2016.1192517
LISTED IN THE AHFE DIGITAL BOOKSTORE CATALOGUE
Explore the complete digital volume
Intelligent Human Systems Integration (IHSI 2023): Integrating People and Intelligent Systems
Read this individual research paper free through the original publisher, or explore the full digital proceedings book.
ISBN 978-1-958651-45-2
Explore this ISBN in the AHFE Bookstore ↗Listed in the July 2026 bookstore catalogue; search by ISBN to confirm current availability · Digital book purchase optional