Eusébio Conceição, Maria Inês Conceição, Maria Manuela Lúcio, João Gomes, Hazim Awbi (2022). Human Design, Comfort and Discomfort Evaluation. In: Human Interaction & Emerging Technologies (IHIET 2022): Artificial Intelligence & Future Applications. AHFE Open Access, vol. 68, pp. 54–60. https://doi.org/10.54941/ahfe1002712
In this work the human design, the thermal comfort and the local thermal discomfort are evaluated. In the design the human geometry is developed for a standard seating occupant. In the thermal comfort the PMV and the PPD indexes are calculated. In the local thermal discomfort, the Draught Risk is evaluated. The study, that considers the Human Thermal Modelling, calculates the evolution of the temperature in the body, namely in the skin and cold and warm thermo-receptors. The thermal comfort is dependent of the heat exchange between the body and the environment and the draught risk is dependent of the air temperature, air velocity and air turbulence intensity. The Human Thermal Modelling, that works in steady state and transient conditions, is based not only on the energy balance integral equations for the human body tissue, arterial and venous blood, but also on mass balance integral equations for the blood and transpired water in the skin surface. The clothing thermal system is based not only on the energy balance integral equations for the clothing, but also on mass balance integral equations for the transpired water in the clothing. In the thermal comfort, a mean air velocity is considered in steady state conditions, while in the Draught Risk two different air velocities Root Mean Square are considered in transient conditions.
The human body thermal response, subjected to a mean air velocity field in steady state conditions and a turbulent air velocity field in transient conditi- ons inside a ventilated space, is evaluated in this work. The human body can be used to assess the thermal comfort, Draught Risk and other human body variables.
The Human Thermal Modelling numerical model considers the human body divided in cylinders and spheres and the Computational Fluid Dynamics numerical model considers the human body divided in boxes.
The Human Thermal Modelling numerical model evaluates the tempera- ture distribution in the human body and in the clothing. The Human Thermal
Human Design, Comfort and Discomfort Evaluation 55
Modelling uses as input of the Computational Fluid Dynamics numerical model. This software is used to evaluate the thermal comfort and the Drau- ght Risk level of each occupant. The Human Thermal Modelling numerical model considers energy balance integral equation (Conceição et al. 2000) and mass balance integral equation, based in natural, forced or mixed conve- ction between the skin and the environment and between the clothing and the environment, the conduction between skin and the clothing and between the clothing and the seats, evaporation between the skin and the clothing and between the clothing and the environment, radiation between the skin and the clothing and between the skin and the surrounding surfaces, and the respi- ration between the body and the environment. Examples of the application of this numerical model can be seen in the works of (Conceição and Lúcio 2001) in an experimental and numerical methodology in an experimental data were used as input data and (Conceição et al. 2010) in the application of the adaptive comfort concepts.
Other studies about Human Thermal Modelling numerical models can be analyzed in (Ferreira and Yanagihara 2009), (Zhang et al. 2010), (Tanabe et al. 2002), and others.
The Computational Fluid Dynamics numerical model calculates the envi- ronmental variables around the occupants and the parameters that the occupants are subjected. As variables, the numerical model evaluates the air velocity, air temperature, carbon dioxide concentration, as example, and as parameters the numerical model evaluate the as airflow rate, air exchange rate and Draught Risk, as example. The Computational Fluid Dynamics numerical model considers differential equations, as Navier-stokes, energy and others. The Computational Fluid Dynamics numerical model uses as input of the Human Thermal Modelling numerical model. Examples of the application of this numerical model can be seen in the works of (Conceição, Vicente, and Lúcio 2008) in the calculation of the airflow inside the spaces and (Conceição and Lúcio 2010) in the airflow around the occupants.
Other examples of the application of the Computational Fluid Dynamics numerical model can be analyzed in (Xing, Hatton, and Awbi 2001), (Awbi 1998) and (Aslam Bhutta et al. 2012). The Computational Fluid Dynamics numerical model and the Human Thermal Modelling numerical model work as a coupling methodology. Both numerical models use as input the values calculated in the Building Thermal Modelling numerical model. This numerical model calculate the airflow rate exchanged between spaces and between spaces and the external environment (Conceiçäo, Silva, and Viegas 1997) and the spaces Heating, Ventilating and Air Conditioning (HVAC) system.
The thermal comfort level depends on the environmental variables, as air temperature, air relative humidity, air velocity and Mean Radiant Tempe- rature, and the personal variables, as clothing level and activity level. The thermal comfort used the PMV (Predicted Mean Vote) and the PPD (Predi- cted Percentage of Dissatisfied people) (see (Ole Fanger 1970), (ISO 2005) and (ASHRAE-55 2017)). Measurements in laboratory conditions around the occupants, in order to evaluate the air velocity around the occupants can be analyzed in (Conceição, Silva, and Viegas 1997).
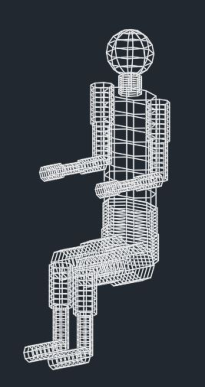
Figure 1: Human body geometry considered in this work.
The Draught Risk level depends on the air velocity, air temperature and tur- bulence air temperature around the occupants (see (ISO 2005)). More details can be seen in (Fanger et al. 1988).
NUMERICAL METHODOLOGY In the thermal comfort a mean air velocity is considered in steady state con- ditions, while in the Draught Risk two different air velocities Root Mean Square is considered in transient conditions, mainly in the neck.
The study is made in winter conditions, using a winter typical personal levels, namely:
The clothing level is 1 Clo;
The activity level 1 Met.
Figure 1 show the human body geometry considered in this study. The environmental variables that the occupant is subjected, in steady state conditions, are the following:
Mean air temperature is 20°C;
Mean air relative humidity is 50 %;
Mean air velocity is 0.2 m/s;
Mean Radiant Temperature is 20 °C.
In transient conditions, for a mean air velocity is 0.2 m/s, the following air velocity Root Mean Square (RMS) are considered:
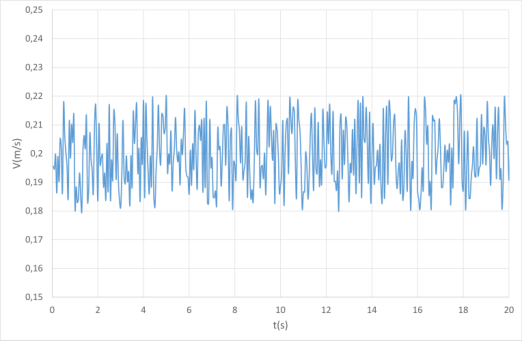
In the Case A the RMS is 0.011 m/s;
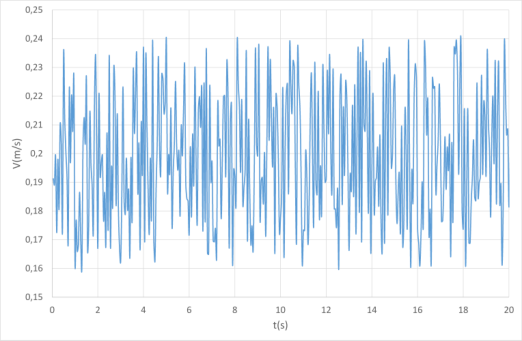
In the Case B the RMS is 0,022 m/s.
In the first part, steady-state conditions, is simulated the human thermal response subjected to a mean airflow. In the second part, transient conditions, is simulated the human thermal response subjected to a random airflow.
Human Design, Comfort and Discomfort Evaluation 57
Figure 2: Air velocity random signal used in the human thermal response numerical simulation in the Case A.Figure 3: Air velocity random signal used in the human thermal response numerical simulation in the Case B.
The airflow fluctuation is characterized by a random signal is presented in the figure 2, for the Case A, and in the figure 3, for the Case B. The numerical simulation was performed for 20 s.
RESULTS AND DISCUSSION
In this section, the results obtained in steady state and transient regime are presented, for the human thermal response.
In table 1 the thermal comfort level values are presented, when the steady state regime is considered.
In accordance with the results, the occupant, in the present thermal con- ditions, are thermal comfortable, in accordance with the category C of the international standards, by negative PMV values.
Table 1. Thermal comfort, PMV and PPD level values, when the steady state regime is considered.
Table available in the original PDF paper.
Values PMV −0.66 PPD (%) 13.97
Table 2. Draught Risk values, when the transient regime is considered (neck).
Table available in the original PDF paper.
T (°C) V (m/s) RMS (m/s) TI (%) PD (static) (%) PD (dynamic) (%) PD (%)
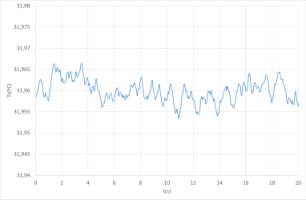
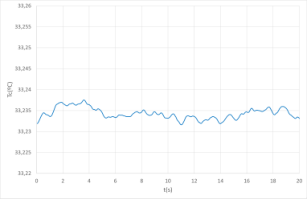
Figure 4: Evolution of the temperatures of the skin surface (Ts), for an air velocity random in the occupant’s neck area. Figure a) is associated to the Case A and figure b) is associated with the Case B.
In table 2 the local thermal discomfort level values, namely the Draught Risk, are presented, when the transient regime is considered. In this study only the neck results are presented. In this table the T, V, RMS and TI are associated, respectively, with the air temperature, air velocity, Root Mean Square and air turbulence intensity, while the PD (static), PD (dynamic) and PD are associated, respectively, the static Draught Risk, dynamic Draught Risk and Draught Risk.
The Draught Risk, in accordance with the obtained results, are in accor- dance with the Category A of the international standards. The static Draught Risk, in the Case A and B present similar values, however, the dynamic Drau- ght Risk present higher values in the Case A than in the Case B. The air turbulence intensity is higher in the Case A than in the Case B.
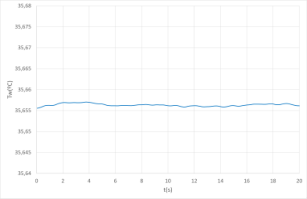
Figure 4, 5 and 6 shows, respectively, the evolution of temperatures verified on the skin surface (Ts), on the cold (Tc) thermoreceptor and on the heat (Tw) thermoreceptor obtained for an airflow random occurred in the neck area of a seated person.
In accordance with the skin temperature evolution is verify that the flu- ctuation verified in the Case A is lower than the Case B. The evolution of temperature fluctuations of the cold and warm thermoreceptors are in accordance with the results obtained in the skin temperature. However, the fluctuations verified in the skin temperature are highest and the fluctuations verified in the warm temperature are lowest.
Human Design, Comfort and Discomfort Evaluation 59
a) b)
Figure 5: Evolution of the temperatures of the cold thermoreceptor (Tc), for an air velocity random in the occupant’s neck area. Figure a) is associated to the Case A and figure b) is associated with the Case B.
a) b)
Figure 6: Evolution of the temperatures of the warm thermoreceptor (Tw), for an air velocity random in the occupant’s neck area. Figure a) is associated to the Case A and figure b) is associated with the Case B.
CONCLUSION
In this work the human design, the thermal comfort and the local thermal discomfort are evaluated.
The design, used in this work, present a posture of a typical occupant. The grid generation, in accordance with the previous results, guarantee acceptable view factors and acceptable radiant heat exchanges between the occupant and the surrounding environments.
The thermal comfort are acceptable in accordance with the category C, by negative PMV values, of the international standards.
Finally, the Draught Risk, for the Cases A and B, in the neck, are accepta- ble in accordance with the category A for the international standards. When the RMS increase the fluctuation of the temperature in the skin, cold termo- receptor and warm termoreceptor increase. However, the fluctuations in the Skin are higher than the fluctuation in the warm termoreceptors.
Im future works the response of the cold and warm termoreceptores will be evaluated and the obtained results correlated with the Draught Risk values will also be evaluated.
ACKNOWLEDGMENT
The authors would like to acknowledge the support of the project (SAICT- ALG/39586/2018) supported by Algarve Regional Operational Program (CRESC Algarve 2020), under the Portugal 2020 partnership agreement,
through the European Regional Development Fund (ERDF) and the National Science and Technology Foundation (FCT).
REFERENCES
ASHRAE-55. 2017. “Thermal Environmental Conditions for Human Occupancy.”
ANSI/ASHRAE Standard - 55. Aslam Bhutta, Muhammad Mahmood et al. 2012. “CFD Applications in Various Heat Exchangers Design: A Review.” Applied Thermal Engineering. Awbi, H. B. 1998. “Energy Efficient Room Air Distribution.” Renewable Energy. Conceição, E.Z.E., and M.M.J.R. Lúcio. 2010. “Numerical Study of the Influence
of Opaque External Trees with Pyramidal Shape on the Thermal Behaviour of a School Building in Summer Conditions.” Indoor and Built Environment 19(6). Conceição, E.Z.E., A.R.L. Nunes, J.M.M. Gomes, and M.J.R. Lúcio. 2010. “Application of a School Building Thermal Response Numerical Model in the Evolution of the Adaptive Thermal Comfort Level in the Mediterranean Environment.” International Journal of Ventilation 9(3). Conceição, E.Z.E., M.C.G. Da Silva, J.C.S. André, and D.X. Viegas. 2000. “Thermal
Behaviour Simulation of the Passenger Compartment of Vehicles.” International Journal of Vehicle Design 24(4). Conceiçäo, E.Z.E., M.C.G. Silva, and D.X. Viegas. 1997. “Air Quality inside the Passenger Compartment of a Bus.” Journal of Exposure Analysis and Environmental Epidemiology 7(4). Conceição, E.Z.E., M.C.G. Silva, and D.X. Viegas. 1997. “Airflow around a
Passenger Seated in a Bus.” HVAC and R Research 3(4). Conceição, E.Z.E., V.D.S.R. Vicente, and M.M.J.R. Lúcio. 2008. “Airflow inside School Building Office Compartments with Moderate Environments.” HVAC and R Research 14(2). Conceição, E Z E, and MMJR Lúcio. 2001. “Numerical and Subjective Responses
of Human Thermal Sensation.” Proceedings of the BioEng. Fanger, P. O., A. K. Melikov, H. Hanzawa, and J. Ring. 1988. “Air Turbulence and Sensation of Draught.” Energy and Buildings. Ferreira, M. S., and J. I. Yanagihara. 2009. “A Transient Three-Dimensional Heat
Transfer Model of the Human Body.” International Communications in Heat and Mass Transfer. ISO. 2005. “ISO 7730: Ergonomics of the Thermal Environment Analytical Determination and Interpretation of Thermal Comfort Using Calculation of the PMV and PPD Indices and Local Thermal Comfort Criteria.” Management. Ole Fanger, P. 1970. “Thermal Comfort. Analysis and Applications in Environmental
Engineering.” Copenhagen: Danish Technical Press. Tanabe, Shin Ichi et al. 2002. “Evaluation of Thermal Comfort Using Combined Multi-Node Thermoregulation (65MN) and Radiation Models and Computatio- nal Fluid Dynamics (CFD).” In Energy and Buildings,. Xing, H., A. Hatton, and H. B. Awbi. 2001. “A Study of the Air Quality in
the Breathing Zone in a Room with Displacement Ventilation.” Building and Environment. Zhang, Hui, Edward Arens, Charlie Huizenga, and Taeyoung Han. 2010. “Thermal Sensation and Comfort Models for Non-Uniform and Transient Environments, Part II: Local Comfort of Individual Body Parts.” Building and Environment.
Read this individual research paper free through the original publisher, or explore the full digital proceedings book.
ISBN 978-1-958651-44-5
Explore this ISBN in the AHFE Bookstore ↗Listed in the July 2026 bookstore catalogue; search by ISBN to confirm current availability · Digital book purchase optional