One of the key aspects for an efficient cooperation between human driver and automated vehicle lies in the accurate interpretation of the driver state by the automated system. Flawless driver monitoring and consequently successful driver-vehicle interaction can increase safety of the traffic in the future when automated agents are one of the involved road users. Driver activity recognition is an important component of driver monitoring, as drivers in automated vehicles drivers are allowed to engage in driving irrelevant activities. Detecting these activities during driver monitoring can improve assessment of automated system about driver’s readiness to react in critical driving situation. However, the confined space hinders the in-vehicle activity detection by sensors such as cameras, which require a complete overview of the driver’s body movements within the frames. On the other hand, utilizing other sensors such as accelerometers, placed on the driver’s body is obtrusive and undesirable in the driving context. In this contribution, two pressure sensor mats are used as sensors that are placed on the seat and the back of the driver seat. This type of sensor is non-intrusive and can be easily applied in vehicles. To gather the necessary data for training the models, an experiment is conducted using a static driving simulator whose cockpit layout is comparable to that of a real vehicle. The experiment is executed with eight sparsely selected participants based on the fractional factorial criteria. During the designed scenario, several activities are expected from the participants, either directly through the given instructions or indirectly through the arranged driving situation. A total of 20 activities are selected for the classification task based on the result of a previously carried out survey on the non-driving related activities that are most demanded by drivers in an automated vehicle. To model the driver activity, three neural networks from the RNN family are chosen, namely LSTM, stacked LSTM, and CNN-LSTM. Since the data obtained from the activities are time series, the criterion for selecting the networks is their capability to handle the temporal aspect of the data. Another emphasis in training the networks is to create a generalized model that can deal with the data from all drivers, rather than creating an individualized model for each driver.The results show that the pressure distribution from seat and back of drivers provides valuable information about the current activity of the driver. As expected, individual models achieve higher accuracy than generalized models built on data from all drivers. However, all generalized algorithms are able to recognize the selected activities with more than 70% accuracy. The generated models can be employed at lower automation levels to estimate the engagement of drivers in driving task, as well as at higher automation levels to predict readiness of drivers for potential takeover situations. In addition, accurate estimation of driver state helps the automated system to increase the comfort and improve driver state. Fusion of the seat pressure distribution and data from other unobtrusive in-vehicle sensors, in the next step, can further increase the accuracy of the models.
Flawless driver monitoring and consequently successful driver-vehicle intera- ction can increase safety of the traffic in the future when automated agents are one of the involved road users. Driver activity recognition is an important component of driver monitoring, as drivers in automated vehicles are allowed to engage in non-driving related tasks (NDRTs). According to SAE (J3016) identifying NDRTs is crucial in the design of takeover interface. Detecting these activities during driver monitoring can improve assessment of auto- mated system about driver’s readiness to react in critical driving situations. However, the confined space hinders the in-vehicle activity detection by sen- sors such as cameras, which require a complete overview of the driver’s body movements within the frames. On the other hand, utilizing other sensors such as accelerometers, placed on the driver’s body is obtrusive and undesirable in the driving context. The use of seat pressure sensors provides a non-intrusive data collection platform that can be applied to all vehicles. The collected data can be deployed to train the learning models. The generated models can be employed at lower automation levels to estimate the engagement of drivers in driving task, as well as at higher automation levels to predict readiness of drivers for potential takeover situations. In addition, accurate estimation of driver state helps the automated system to increase the comfort and improve driver state and sense of well-being. Fusion of the seat pressure distribution and data from other unobtrusive in-vehicle sensors, in the next step, can further increase the accuracy of the models.
RELATED WORKS Most studies on activity recognition related to drivers are based on data col- lected from cameras. Xing et al. 2019 use a Gaussian mixture model and convolutional neural network (CNN) to recognize seven driver behaviors, including driving normally, checking three mirrors, using an in-vehicle radio, texting, and answering mobile phone calls. Data are collected from ten par- ticipants using a low-cost camera during a natural driving situation. The achieved average accuracy of the recognition task after network improvement by transfer learning on AlexNet (Krizhevsky et al. 2012) is 81.6%. In a study by Walocha et al. 2022, video data are fed into OpenPose (Cao et al. 2017) to recognize the position of hands and head orientation. A Gaussian mixture model is then used to quantify the distance between the hands and the regions of interest, and a linear support vector machine (Cortes and Vapnik, 1995) is trained to classify the driver activity. To collect data, a study is conducted with 32 participants in a driving simulator with dynamic lighting conditions. A total of three activities, consisting of manual driving, mobile office activi- ties with different levels of exertion, and relaxation, are labeled. The results show the average accuracy for the three classes to be 85.0%.
Assuming that drivers look at what they are performing, Yang et al. 2021 classify driver activities based on the gaze direction. For this purpose, two cameras are mounted, one pointed at the driver to capture facial data and the other at the instruments in the cabin to capture the scene. Images at 25 frames
Generalized Model for Driver Activity Recognition in Automated Vehicles 205
per second (fps) are collected from six participants, and eight markers are pla- ced in the camera’s field of view on the windshield, dashboard, steering wheel, mirrors, and center console. The facial features are extracted using OpenFace (Baltrusaitis et al. 2018) and the gaze is mapped by adding images from the scene camera. Then, the images and mapped gaze data are fed into a Mask R-CNN model (He et al. 2017) to classify five activities that require visual attention: reading a book, playing on a phone, working on a laptop, playing on a tablet, and interacting with the center console. The average success rate is 86.2%. In another study (Pan et al. 2021), data are collected from seven drivers during natural driving on a predefined route and in a stopped vehicle while mimicking non-driving related tasks (NDRTs) through a monocular camera on the driver’s right side attached to the vehicle. Classified activities include normal driving, turning left or right, texting, talking on the phone, using media, drinking, and picking up objects. Three distinguished classes of long short-term memory (LSTM) are trained and compared for the reco- gnition task, and the highest recognition rate of 88.8% is achieved with the spatial-temporal graph convolutional LSTM (ST-GCLSTM), which consists of a graph convolutional network and a single-layer LSTM with 128 units and attention mechanism.
Wharton et al. 2021 propose coarse temporal attention network (CTA- Net), a trainable glimpse network with attention mechanism, to detect driver activities from RGB video data. The network is trained and tested on two datasets. The achieved accuracy is 84.1% in the AUC Distracted Driver Dataset (Abouelnaga et al. 2017), which contains video recordings of dri- vers during a naturalistic drive in a real vehicle, and 92.5% in the Distracted Driver V2 dataset (Eraqi et al. 2019), which contains videos of participants in a driving simulator where the drivers’ entire bodies are captured by a camera. Both datasets contain ten activity classes, e.g., safe driving, texting. It can be concluded that the inclusion of whole-body motion in the camera image increases the performance of the classifiers, which is not possible in real vehicles due to the limited space in the driver’s cabin. Nel and Ngxande, 2021 use residual neural networks (ResNet, He et al. 2016) with spatial- temporal three-dimensional kernels for activity recognition and compare the performance of different depths of the same network. To increase accuracy, the networks are pre-trained on the Kinetics-400 human activity recognition video dataset (Kay et al. 2017). The pre-trained networks are trained and tested on two datasets, the Kaggle State Farm Distraction Dataset (Kaggle, 2016) and the AUC Distracted Driver Dataset, and the accuracies achieved are 92.9% and 94.0%, respectively. A total of ten in-vehicle activities such as reaching behind, talking on the phone, and drinking are classified.
The use of infrared or thermal cameras can overcome the vulnerability of camera-based approaches to lighting changes and darkness. However, there are limitations in camera placement that cause the lower body to be out of the camera’s field of view and body parts to be occluded by objects or other body parts. To avoid the limitations of camera-based approaches, Duan et al. 2018 propose WiDriver, an activity detection system based on WiFi channel state information (CSI) that requires only a commodity WiFi device. WiDriver is based on the Fresnel zone model (Zhang et al. 2017) with 2.4 GHz WiFi
206 Dargahi Nobari and Bertram
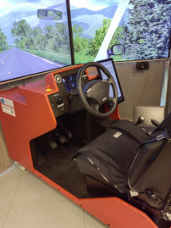
Figure 1: The experimental setup for acquisition of driver activity data.
signal frequency and 12 cm wavelength. The network receives CSI amplitude variation data as input and is able to detect the time course of driver postures. In Duan et al. 2018, eight actions are detected, including driving straight, changing lanes to the right or left, turning right or left, turning, making phone calls, and sending messages, and a detection rate of 90.8% is achieved.
The contribution at hand is based on a previous pilot study (Dargahi Nobari and Bertram, 2022) that investigates the feasibility of subject- dependent activity recognition based on pressure distribution captured by pressure sensor mats placed on the driver’s seat and backrest. The results of the previous pilot study with four participants showed a maximum subject-dependent accuracy of 86% for the detection of twelve activities. The subject-dependent network consisted of a layer of LSTM with 200 units fol- lowed by a dense layer. In the present contribution, the same sensors are used to collect data from more participants with extended activities on a driving simulator, and the goal is to train a generalized activity detection model that is subject-independent and can recognize 21 activity classes.
CREATION OF DATASET To evaluate the proposed method, the activity data of the participants should, first, be collected using the pressure sensor mats. Therefore, an experiment is conducted on a driving simulator with a limited number of participants performing different activities during manual and automated driving. In the following subsections, the experiment and the data collection procedure are explained in detail.
Apparatus The experiment in performed in a static driving simulator. The hardware of the simulator consists of a driver mockup, three displays in front of the mockup to visualize the driving scene and the cockpit mirrors, a display beh- ind the steering wheel that acts as a dashboard, and a display on the right side of the driver that acts as a center console. There is also a platform on the right side of the driver’s seat that imitates the passenger seats and glo- vebox. The experimental setup is shown in Figure 1. The SCANeR studio1
1https://www.avsimulation.com/solutions/
Generalized Model for Driver Activity Recognition in Automated Vehicles 207
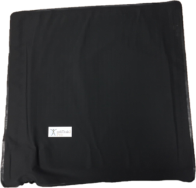
Figure 2: BodiTrak2 Pro pressure sensor mat with 32 × 32 sensor matrix.
2021 software is utilized as virtual platform of the experiment. To capture the pressure distribution, the simulator is equipped with two BodiTrak2 Pro2 mats placed on the seat and the backrest of the driver seat. Each mat consists of 32 × 32 pressure sensors (Figure 2) with a total measurement area of 46 cm × 46 cm.
Sample Subjects are selected based on four characteristics: height, body mass index (BMI), age, and gender. To determine the joint effect of the factors, facto- rial designs can generally be used that consider the combination of all levels of all factors. In this experiment, the four characteristics are assumed to be factors with two levels each. When all factors have two levels, the factorial design is called a two-level factorial design, where an increase in the num- ber of factors means an exponential increase in the number of combinations and, consequently, an exponential increase in the number of participants required (Montgomery, 2017). In this case, the fractional factorial design can be applied, where unlike the factorial design, some of the combinations that consider the joint effect of a higher number of factors are neglected to keep the number of factor combinations in the feasible range. In the designed trial, eight participants are selected based on the two-level fractional facto- rial design to collect training data, and two random participants are selected to test the trained models. Participants’ characteristics and the levels of each characteristic are listed in Table 1.
Experiment Procedure The entire experiment takes less than one hour for each attendee. At the beginning, the participants receive information about the experiment and its goals. Then, the driving simulator and sensors are explained to the subjects. After signing the consent form, drivers are asked to practice driving in the simulator to get used to the virtual environment. Once drivers are comfor- table with driving in the simulator, the main part of the experiment begins with two driving scenarios. The driving scenarios include manual driving to record driving-related activities and automated mode to record data when drivers are engaged in NDRTs. Drivers are always given auditory instructions on when and how to perform the next NDRT.
P: participants, F: female, M: male, - : between two levels
Data Collection, Labeling and Preprocessing The sampling time for data acquisition is set to 0.06 s (sampling rate of 16.7 Hz). The pressure data of all pressure sensors in the two mats (32 × 32 × 2 pressure values for each frame) are recorded. The simulation software (SCANeR) is programmed to record the labels as well. Each frame can have more than one label, depending on what the driver is doing. For example, the driver may steer to the right and accelerate at the same time, so the data will have two labels at the same time. After recording, the multi-label data are divided into sliding windows of 3 s (50 frames) and with an overlap of 2 s. To determine the final labels of each window, the mean value for each label in the window is calculated and rounded to a binary value.
ACTIVITY RECOGNITION APPROACH In this study, both driving-related activities and NDRTs are taken into account. The driving simulator is set to automatic mode, so driving-related activities are limited to accelerating, braking, right and left steering. Engaging the clutch and gearbox are not considered. The NDRTs are selected based on a previously conducted survey (Yang et al. 2018) that reveals the most com- mon secondary activities performed by drivers when driving manually and the most desired NDRTs that drivers would like to perform during automated driving. A total of 20 activity classes are labeled. The times when the drivers do not perform any of the mentioned activities are labeled as “no action”. Table 2 shows the included activities, their description, and the total num- ber of samples for each activity used to build the driver activity recognition models.
Since the data obtained from the activities has temporal aspect, the crite- rion for selecting the networks is their ability to process sequential data and 3https://www.kiloo.com/subway-surfers/
Generalized Model for Driver Activity Recognition in Automated Vehicles 209
Table 2. Applied activity classes.
Table available in the original PDF paper.
No. Activity Description and variations Samples 1 Enter Get in the simulator and fasten the seatbelt 250 2 Gas Press the accelerator pedal with varying intensities 250 3 Brake Press brake pedal with various intensities 185 4 Steer right Steer right - from large radius to U curves 215 5 Steer left Steer left – from large radius to U curve 223 6 Eat Open the cookie bag and eat cookies 250 7 Drink Take a water bottle, open it and drink water 239 8 Call Take the mobile phone and answer the call 182 9 Message Take the mobile phone and check the notifications 214 10 Infotainment Interact with the center console 172 11 Laptop Take the laptop and fill out a form 205 12 Tablet Take the tablet and play the game Subway Surfers3 184 13 Read Read a text on the center console 231 14 Write Take a notebook and write in it 250 15 Movie Watch a movie on the center console 238 16 Glovebox Pick up an object from the glovebox 159 17 Pick up front Pick up an object from the front seat 78 18 Pick up back Pick up an object from the back seat 75 19 Relax Slide forward on the seat, close the eyes and relax 204 20 Leave Get out of the simulator 235 21 No action Do none of the above activities, observe the surrounding 250
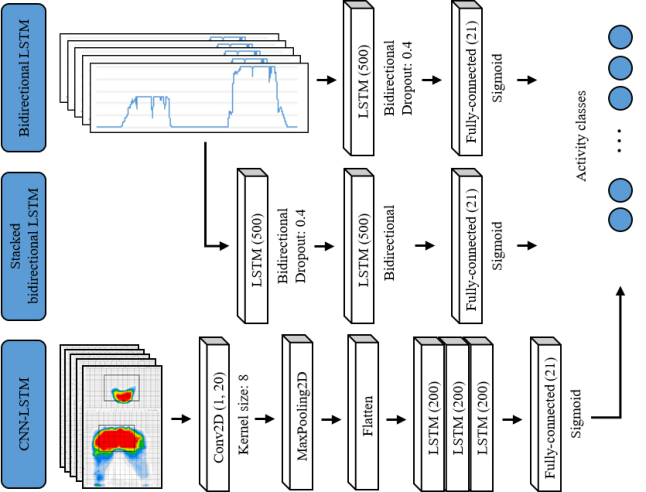
time series. In this contribution, three models from the recurrent neural netw- ork (RNN) family, namely bidirectional LSTM (Hochreiter and Schmidhuber, 1997, Graves et al. 2013), stacked bidirectional LSTM, and CNN-LSTM (Donahue et al. 2015), are trained with the collected data. Figure 3 shows the detailed structure of the networks. The data collected from the eight sparsely selected participants are used to build a generalized subject-dependent model. Depending on the number of trainable parameters, a dropout layer is added after the LSTM layer during the training process to reduce the overfitting effect.
EVALUATION AND FUTURE WORK Specifically, the networks are trained with the data from eight sparsely sele- cted participants, and the data gathered from two random participants are applied for evaluation of the networks. The accuracies of the proposed models are reported in Table 3.
Due to the GPU limitation, the trainable parameters of the CNN-LSTM were kept low, resulting in relative underfit. Nevertheless, all models reach an accuracy of more than 90%. According to the obtained results, with an appropriate selection of data points, it is possible to train a generalized acti- vity recognition model with a limited number of participants. In addition to the performance of the three trained networks, Table 3 also presents a com- parison with the state-of-the-art in driver activity recognition. Although in
210 Dargahi Nobari and Bertram
Figure 3: Architecture of the networks used for the driver activity recognition task.Table 3. Assessment of the recognition models.
Table available in the original PDF paper.
Source Method NC Sensor Dataset Acc[%]
From 6 drivers 86.1
Xing et al. 2019 CNN 7 Camera From 10 drivers 81.6 Pan et al. 2021 Vanilla LSTM 8 Camera From 7 drivers 82.1 Wharton et al. 2021 CTA-Net 10 Camera AUC distraction 84.0 Walocha et al. 2022 Linear SVC 3 Camera From 32 drivers 85.0 Yang et al. 2021 Mask R-CNN 5 Dual cameras 8 Camera From 7 drivers 88.8 Pan et al. 2021 ST-GCLSTM 8 Camera From 7 drivers 87.9 Pan et al. 2021 SC-GCLSTM attention
Duan et al. 2018 WiDrive 8 WiFi From 5 drivers 90.7 Wharton et al. 2021 CTA-Net 10 Camera Eraqi et al. 2019 92.5 Nel et al. 2021 ResNet-3D 10 Camera State farm driver 92.9 Nel et al. 2021 ResNet-3D 10 Camera AUC distraction 94.0 Ours Bidirectional 21 Pressure From 8 drivers 90.2 Ours Stacked 21 Pressure From 8 drivers 91.3 Ours CNN-LSTM 21 Pressure From 8 drivers 90.8 NC: number of classes
the present study the number of activity classes is significantly higher compa- red to previous works and only the data from seat pressure sensors are used, the achieved accuracy is comparable to the state-of-the-art.
In the present study, the proof of generality concept is done based on data collected from two randomly selected drivers. In the next step, the activity
Generalized Model for Driver Activity Recognition in Automated Vehicles 211
recognition algorithms should be tested with more drivers with diverse chara- cteristics. Moreover, the addition of other data sources such as other sensors or vehicle driving dynamics should be taken into account to further improve the performance of the classifiers.
REFERENCES
Abouelnaga, Y., Eraqi, H.M. and Moustafa, M.N., (2017). Real-time distracted driver posture classification. arXiv preprint arXiv:1706.09498. Baltrusaitis, T., Zadeh, A., Lim, Y.C. and Morency, L.P., (2018), May. Openface 2.0:
Facial behavior analysis toolkit. In 2018 13th IEEE international conference on automatic face & gesture recognition (FG 2018) (pp. 59–66). IEEE. Cao, Z., Simon, T., Wei, S.E. and Sheikh, Y., (2017). Realtime multi-person 2d pose estimation using part affinity fields. In Proceedings of the IEEE conference on computer vision and pattern recognition (pp. 7291–7299). Cortes, C. and Vapnik, V., (1995). Support-vector networks. Machine learning,
20(3), pp. 273–297. Dargahi Nobari, K. and Bertram, T., (accepted). Position classification and invehicle activity detection using seat-pressure-sensor in automated driving, AmE- Automotive meets Electronics. Donahue, J., Anne Hendricks, L., Guadarrama, S., Rohrbach, M., Venugopalan, S.,
Saenko, K. and Darrell, T., (2015). Long-term recurrent convolutional networks for visual recognition and description. In Proceedings of the IEEE conference on computer vision and pattern recognition (pp. 2625–2634). Duan, S., Yu, T. and He, J., (2018). Widriver: Driver activity recognition system based on wifi csi. International Journal of Wireless Information Networks, 25(2), pp. 146–156. Eraqi, H.M., Abouelnaga, Y., Saad, M.H.and Moustafa, M.N., (2019). Driver distra-
ction identification with an ensemble of convolutional neural networks. Journal of Advanced Transportation. Graves, A., Mohamed, A.R. and Hinton, G., (2013), May. Speech recognition with deep recurrent neural networks. In 2013 IEEE international conference on acoustics, speech and signal processing (pp. 6645-6649). IEEE. He, K., Zhang, X., Ren, S. and Sun, J., (2016). Deep residual learning for image
recognition. In Proceedings of the IEEE conference on computer vision and pattern recognition (pp. 770–778). He, K., Gkioxari, G., Dollár, P. and Girshick, R., (2017). Mask r-cnn. In Proceedings of the IEEE international conference on computer vision (pp. 2961–2969). Hochreiter, S. and Schmidhuber, J., (1997). Long short-term memory. Neural
computation, 9(8), pp. 1735–1780. Kaggle. (2016). State farm distracted driver detection. Available at: https://www.
kaggle.com/competitions/state-farm-distracted-driver-detection/overview (Acces- sed: 04.04.2022). Kay, W., Carreira, J., Simonyan, K., Zhang, B., Hillier, C., Vijayanarasimhan, S., Viola, F., Green, T., Back, T., Natsev, P. and Suleyman, M., (2017). The kinetics human action video dataset. arXiv preprint arXiv:1705.06950. Krizhevsky, A., Sutskever, I. and Hinton, G.E., (2012). Imagenet classification with
deep convolutional neural networks. Advances in neural information processing systems, 25. Montgomery, D.C., (2017). Design and analysis of experiments. John wiley & sons.
212 Dargahi Nobari and Bertram
Nel, F. and Ngxande, M., (2021), January. Driver Activity Recognition Through Deep Learning. In 2021 Southern African Universities Power Engineering Con- ference/Robotics and Mechatronics/Pattern Recognition Association of South Africa (SAUPEC/RobMech/PRASA) (pp. 1–6). IEEE. Pan, C., Cao, H., Zhang, W., Song, X. and Li, M., (2021). Driver activity recogni-
tion using spatial-temporal graph convolutional LSTM networks with attention mechanism. IET Intelligent Transport Systems, 15(2), pp. 297–307. Walocha, F., Drewitz, U. and Ihme, K., (2022). Activity and Stress Estimation Based on OpenPose and Electrocardiogram for User-Focused Level-4-Vehicles. IEEE Transactions on Human-Machine Systems. Wharton, Z., Behera, A., Liu, Y. and Bessis, N., (2021). Coarse temporal attention
network (cta-net) for driver’s activity recognition. In Proceedings of the IEEE/CVF Winter Conference on Applications of Computer Vision (pp. 1279–1289). Xing, Y., Lv, C., Wang, H., Cao, D., Velenis, E. and Wang, F.Y., (2019). Driver activity recognition for intelligent vehicles: A deep learning approach. IEEE transactions on Vehicular Technology, 68(6), pp. 5379–5390. Yang, L., Dong, K., Ding, Y., Brighton, J., Zhan, Z. and Zhao, Y., (2021). Recognition
of visual-related non-driving activities using a dual-camera monitoring system. Pattern Recognition, 116, p. 107955. Yang, Y., Klinkner, J.N. and Bengler, K., (2018), August. How will the driver sit in an automated vehicle?–The qualitative and quantitative descriptions of non- driving postures (NDPs) when non-driving-related-tasks (NDRTs) are conducted. In Congress of the International Ergonomics Association (pp. 409–420). Springer, Cham. Zhang, D., Wang, H. and Wu, D., (2017). Toward centimeter-scale human activity
sensing with Wi-Fi signals. Computer, 50(1), pp. 48–57.
Read this individual research paper free through the original publisher, or explore the full digital proceedings book.
ISBN 978-1-958651-44-5
Explore this ISBN in the AHFE Bookstore ↗Listed in the July 2026 bookstore catalogue; search by ISBN to confirm current availability · Digital book purchase optional