Cannan Yi, Hong Hu, Jiayuan He, Fan Tang, Kaiway Li, Yanfang Zheng, Huali Zuo (2022). Evaluation models of muscle fatigue recovery for manual demolishing tasks. In: Social and Occupational Ergonomics. AHFE Open Access, vol. 65, pp. 82–90. https://doi.org/10.54941/ahfe1002662
Manual demolition tasks are heavy physical demanding tasks that may cause muscle fatigue accumulation and lead to work-related musculoskeletal injuries (WMSDs). Asking the operators to have a rest is a vital way to reduce muscle fatigue. How long the rest time would be fine for operators to recover becomes important. This study aims to establish muscle fatigue recovery evaluation models for manual demolition tasks to determine the recovery time of the operators. A muscle fatigue recovery test of manual demolition tasks was designed and organized. A total of 12 male college students were recruited. Their muscle force and ratings of perceived exertion (RPE) were measured at 0, 1, 2, 3, 4, 5, and 6 min. ANOVA analysis was done to show the effects of the time period on the force and RPE. Correlation analysis was performed to show the relationship between measured parameters. Regression analysis was carried out to establish models. The study showed that time significantly influenced F(t) and RPE. With the progressing of the muscle fatigue recovery, the F(t) went up and the RPE went down. The time, F(t), and RPE were significantly related. Both F(t) and RPE models were established and assessed. The constructed models were reasonable and able to describe the characteristics of muscle fatigue recovery in manual demolishing tasks.
Manual demolition tasks are common in construction projects, municipal projects, road and bridge projects, post-disaster demolition, rescue activities, etc. In such worksites, operators hold tools to demolish or crush, which can easily lead to muscle fatigue accumulation and work-related musculoskele- tal disorders (WMSDs) because of high load, long working time, awkward posture, and vibration. The risk of getting WMSDs are high (Nordmand, 2013; Pratig et al. 2010). Reasonable arrangement of rest time for manual demolition operators can effectively reduce the accumulation of muscle fati- gue and thus reduce the risk of WMSDs. If the characteristics of muscle force and ratings of perceived exertion (RPE) with rest time can be clarified, it can provide effective theoretical support for rational work scheduling.
Evaluation Models of Muscle Fatigue Recovery for Manual Demolishing Tasks 83
Muscle fatigue recovery refers to the increase in the functional capacity of a body organ or organism caused by fatigue (Rohmert,1973). It has been found that muscle fatigue or muscle fatigue recovery characterization para- meters have a good agreement (Koppelaar and Wells, 2005; A. Grant et al. 1994). Therefore, muscle fatigue recovery is generally measured using subje- ctive ratings (e.g., Borg CR-10 scaling (Borg, 1982)) and objective data such as heart rate (Nelson et al. 2017), muscle force (Foulis et al. 2017; Ma et al. 2015), biochemical indices (Kang and Min, 2017), and surface EMG (Shin and Kim, 2007; Duong et al. 2001). In the literature, we found that existing muscle fatigue recovery evaluation models included heart rate model, surface EMG model, and muscle force model (Ma et al. 2015; Wood et al. 1997). The difference in building these models lay in the parameters they monitored and obtained. Generally, subjective ratings and objective data were measured to understand muscle fatigue. RPE models were usually constructed by analy- zing the relationship between RPE and surface EMG and muscle force during muscle fatigue in the literature (Zhou et al. 2011; Wang et al. 2004; Ge et al. 2008; Hu et al. 2018a; Hu et al. 2018b). By those models, RPE values under specific conditions were easily obtained. Compared with traditional muscle fatigue models, those RPE models are easier to understand and accepted by engineering practice than other models. For muscle fatigue recovery models, Tang et al. did a simulated demolition task and measured grip forces at times 0, 1, 2, 3, 4, and 5 min at demolition heights of 40, 90, and 165 cm. They pro- posed a grip force prediction model. In manual demolition tasks, operators hold a hammer and push. Grip force only indicates the hold behavior of the operators. Operators may make some effort in pushing in manual demolition tasks.
Therefore, this study focuses on muscle fatigue recovery for manual demo- lition tasks, records muscle force and RPE during muscle fatigue recovery, and tries to construct muscle force and RPE models to determine the appropriate recovery time for demolishing operators.
MUSCLE FATIGUE RECOVERY MODEL FOR MANUAL DEMOLITION TASKS During muscle fatigue recovery, muscle force production capacity rises with recovery time, which means that muscle force is a function of time and can be denoted as F(t). We normalized F(t) as NF(t) to eliminate the effect of individual differences as follows.
Equation reproduced from the original PDF.
Where: MVC is Maximum Voluntary Contraction (MVC), N; t is time in min; F(t) is the value of muscle force at time t; NF(t) is in %.
It was found that RPE was a function of normalization of force decrease (NFD) during muscle fatigue (Hu et al. 2018a; Hu et al. 2018b). We hypothe- sized that this relationship also existed between RPE and NFD during muscle fatigue recovery in manual demolition tasks.
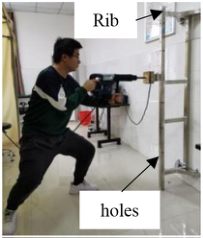
Figure 1: Demolishing task.Equation reproduced from the original PDF.
Where: NFD is in %.
Therefore, this study intends to construct NF(t) and RPE models descri- bing the muscle fatigue recovery process of manual demolition tasks. Those models will provide theoretical support for muscle fatigue prevention in demolition tasks.
METHOD
In the process of muscle fatigue recovery, the physiological and biochemical indexes of the operators varied with the recovery time, so we took the muscle fatigue induced by demolition operation to a certain degree. We measured the values of muscle fatigue-related indexes at different recovery time points in turn and then tried to construct evaluation models. In this experiment, the operator held the tool for simulated demolition operation and then had their F(t) and RPE measured at each recovery time period 1, 2, 3, 4, 5, and 6 min. The test was completed in the laboratory. The temperature and humidity are 24.08 (±0.58) °C and 46.29 (±6.93) %, respectively.
Participants A total of 12 male college students were recruited to participate in the expe- riment. They were right-handed, in good health, and with no history of WMSDs within one year. The participants were informed about the pur- pose and procedure of the experiment before the formal experiment. They were asked to hold a hammer and push on the rig (see Figure 1). They were demanded to find their best force exertion posture under the guide of an expe- rimenter. During the following test, they were encouraged to maintain the posture the same as their best force exertion posture. They signed the consent form and had their anthropometrical parameters measured. Their age, height, body mass, body mass index, shoulder height, elbow height, and knee height were (19.58±0.58) yrs, (173.42±4.54) cm, (69.52±11.33) kg, (23.05±3.19) kg/m2, (142.19±3.02) cm, (106.51±2.54) cm, (51.59±2.27) cm.
Evaluation Models of Muscle Fatigue Recovery for Manual Demolishing Tasks 85
Apparatus We made a demolition bracket (see Figure 1). There are some small holes in the rib of the bracket. A muscle force measure module including a wooden target, a stainless-steel container and a 3-axis force sensor (FH3D-45, Shen- zhen Netn Technology Co., Ltd.) was fixed in the hole of the rib. The data of the sensor can be transmitted to a computer in a real-time manner. A demo- lition tool, BOSCH GSH500 (5.6kg), was used to push. A stopwatch was adopted to control the recovery time. A computer was used to display the force.
Procedure There were 3 steps in the experiment, preparation phase, fatigue-induced test, and fatigue recovery test. In the preparation phase, the participants followed the video for 5 min of aerobic training at first. They then rested for 10 min to eliminate fatigue. Finally, they held a hammer and pushed the wooden target which was set at 115cm in this experiment with their maximum force (see Figure 1). They pushed at least three times with an interval of 2 min, taking the maximum value as MVC. In the fatigue-induced test, the participants held a hammer and pushed at 20 N as they were demolishing under a median load as long as they could. If they were exhausted, they stopped and reported their RPE which was recorded as RPE0 and then pushed again with their maximum effort under the order of an experiment. This force was recorded as F(0). The ending of the fatigue-induced test was the beginning of the fatigue recovery test. During the fatigue recovery test, the participants rested for 6 min, and measured their maximum force again every minute and were recorded as F(1), F(2), F(3), F(4), F(5), and F(6). Also, they reported their RPE and were recorded as RPE1, RPE2, RPE3, RPE4, RPE5, and PRE6.
Data processing A total of 96 (12 participants × 8 measurements) F(t) data and 84 (12 parti- cipants × 7 measurements) RPE data were recorded in the experiment. The data were summarized and organized using Microsoft® Excel (Microsoft, Redmond, WA, USA), and statistical analysis was performed using SAS® 9.0 (SAS Institute Inc., Cary, NC, USA).
RESULTS AND DISCUSSION
Statistical Analysis The change of F(t) and RPE over recovery time was shown in Table 1. Similar to the results in the literature (Hu et al. 2018a; Hu et al. 2018b), a larger recovery of muscle force and a bigger drop of RPE occurred during 0-1 min. Although the measured force exertion in this study (push force) was different from that in Tang et al. (grip force), the same recovery characteristics was found. It may be assumed that although there are grip and push in demolition tasks, both the decline or recovery of grip or push can be used to indicate muscle fatigue. During the experiment, we can monitor any of them.
Table 1. Duncan grouping results.
Table available in the original PDF paper.
Items Time 0min 1min 2min 3min 4min 5min 6min
F(t) * (61.2±15.4) a (68.3±15.8)ab (70.1±15.1)ab (75.9±14.9)abc (80.3±17.9)bc (83.5±20.2)bc (86.7±21.0)c NF(t) * * (57.3±9.3) a (64.1±8.9) ab (65.8±7.7) b (71.3±6.3) bc (75.2±7.8) cd (78.0±9.8) cd (80.9±10.0) d NFD * * (42.7±9.3) a (36.0±8.9) ab (34.2±7.7) b (28.7±6.3) bc (24.8±7.8) cd (22.0±9.8) cd (19.1±10.0) d
RPE * * (8.1±0.3) a (4.8±1.7) b (3.8±1.4) c (3.3±1.3) cd (2.6±1.1) de (1.9±0.9) ef (1.5±0.7) f Note: Same letter indicates not significant, different letters indicate significant, α=0.05; *p<0.01; **p<0.001.
To construct NF(t) and RPE models, ANOVA was done for time on F(t), NF(t), NFD, and RPE. The results showed that time significantly affected F(t) (F=3.30, p<0.01), NF(t) and NFD (F=11.45, p<0.0001) and RPE values (F=44.17, p<0.0001), respectively. Duncan grouping results were shown in Table 1. The results of correlation analysis showed that NF(t) and t (r=0.68, p<0.0001), RPE and NFD (r=0.61, p<0.0001) were significantly and positively correlated.
Model Construction NF(t) and RPE were significantly and positively linearly correlated with t and NFD, respectively. We tried to construct NF(t)-t model (abbreviated as NF(t) model in the following) and RPE-NFD model (abbreviated as RPE model in the following). One-dimensional linear regressions of NF(t) versus t were done to construct NF(t) model and Equation (4) was obtained.
NF(t) = 3.864t + 58.777(p < 0.0001, R2 = 0.98) (4) A large drop during 0-1 in RPE can be observed in Table 1. One- dimensional regression may not be appropriate to fit the RPE model as those in the literature (Hu et al. 2018a; Hu et al. 2018b). Therefore, we adopted a binomial equation to fit our RPE model. When constructing RPE model, we should notice that F(t)=MVC and RPE = 0 when NFD = 0. Therefore, an intercept-free regression was performed to determine the form of the RPE regression equation. Thus, we got RPE model:
Equation reproduced from the original PDF.
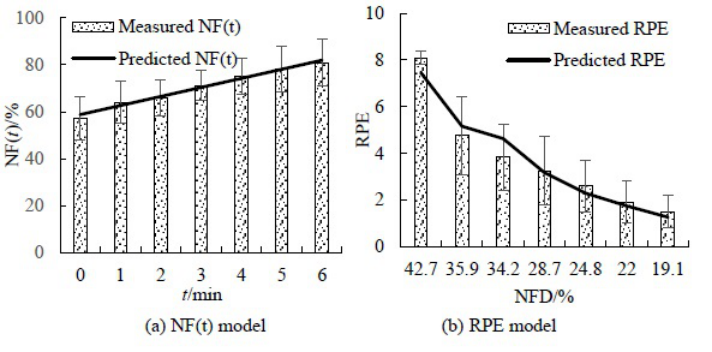
To assess the validity of the model, we calculated the Pearson coefficient of measured and predicted NF(t) and RPE data and found them to be r=0.97 (p<0.0001) and r=0.89 (p<0.0001), respectively. We plotted NF(t) and RPE model as shown in Figure 2. The NF(t) model well described the NF(t) vari- ation with time (Figure 2(a)), while the RPE model had a relatively larger deviation (Figure 2(b)). As shown in Table 1, NFD values of 42.7, 36.0, 34.2, 28.7, 24.8, 22.0 and 19.1 indicated the decline of muscle force at times 0, 1, 2, 3, 4, 5, and 6 min, respectively. To further analyze the reasons for the deviations, we listed the measured and predicted RPE at times 0, 1, 2, 3, 4, 5, and 6 min in Table 2. It was found that the predicted RPE0 was a little
Evaluation Models of Muscle Fatigue Recovery for Manual Demolishing Tasks 87
Figure 2: Histograms of measured data and curves of prediction models.Table 2. Comparison of measured and predicted RPE.
Table available in the original PDF paper.
Items Time 0min 1min 2min 3min 4min 5min 6min Measured RPE Ratings 8.1 4.8 3.8 3.3 2.6 1.9 1.5 Description VS M M M W VW VW Predicted RPE Ratings 7.5 5.2 4.6 3.2 2.3 1.7 1.3 Description VS S M M W VW VW
Note: VS: very strong, S: strong, M: moderate, W: weak, VW: very weak.
bit lower than the measured one, and the predicted RPE1 was higher than the measured one. The deviation between predicted and measured RPE may be related to the design of the test and the biochemical mechanisms during muscle fatigue and recovery. To improve the accuracy of RPE0 data, the par- ticipant reported RPE0 1-2 s before the end of the muscle fatigue-induced test in which they couldn’t push anymore. The RPE score was high, reaching (8.1 ± 0.3). And then the participant stopped and an experiment took over the hammer. The muscle force test was then performed under an experimenter’s command. Therefore, there was a little gap between the time reporting RPE0 and the time measuring the F(0). According to the time of recovery of energy substances and lactate elimination after forceful exercise (Wang, 2002), oxy- genated myoglobin recovers quickly, taking only about 1 min to complete recovery and elimination, while the complete recovery of phosphagen (ATP, PC) takes about 2 min, but the depleted phosphagen is synthesized in half within 20-30 s. Therefore, it was possible that this time gap and the rapid recovery of oxygenated myoglobin and phosphagen (ATP, PC) together led to a larger difference in RPE at times 0 and 1 min.
Based on NF(t) model and RPE model, the operator’s muscle fatigue gra- dually recovers with time. As shown in Table 2, the measured and predicted RPE is 1.5 and 1.3 at time 6 min. It can be anticipated that a full recovery level could be achieved several minutes later. The RPE model further verified the consistency between objective data and subjective data (Zhou et al. 2011;
Wang et al. 2004; Ge et al. 2008; Hu et al. 2018a; Hu et al. 2018b). Although the deviation of the model was relatively large, the RPE itself was subjective data, which was within the acceptable range. A combination of NF(t) model and RPE model may be employed to assess the process of muscle fatigue recovery in manual demolition tasks.
Limitations This study has some limitations. Firstly, the NF(t) and RPE models were con- structed under demolition posture as shown in Figure 1. Those models may only be suitable for demolishing tasks similar to our study. Since posture was a key factor affecting the development of muscle fatigue in muscles (Yi et al. 2016), more postures will be considered and a posture parameter may be introduced to NF(t) and RPE models in the future. Secondly, a comparative large deviation in RPE prediction was observed in our study (see Figure 2(b)). Although RPE has been widely used in muscle fatigue by asking their feelings about force exertion (Li and Chiu, 2015). An RPE training and calibration was normally used (Rashedi, 2016) and the consistency of RPE and force application data was greatly improved. We consider using RPE training and calibration in the future experiments and try to construct better models. At last, the operation was static and without vibration. It is somewhat different from the real operating conditions. We consider doing a more real demolition experiment in which participants hold a hammer and demolish a concrete solid in the future.
CONCLUSION
In the process of muscle fatigue recovery of manual demolition tasks, muscle force gradually recovered with time and RPE gradually decreased with time. Time significantly affected NF(t), NFD, and RPE. RPE and NFD showed a significant linear positive correlation. We constructed NF(t) model and RPE model which showed the change of muscle force with recovery time. Those two models described the recovery of muscle force and the decline of RPE during manual demolition tasks and can be used to assess muscle fatigue. The models were constructed based on static manual demolition tasks without considering the effects caused by equipment vibration and dynamic opera- ting conditions under real operating conditions, and without considering the introduction of operating task parameters, posture parameters, etc. The par- ticipants were not trained and calibrated for RPE, therefore, the model still needs more experimental verification and optimization.
ACKNOWLEDGMENT
The authors would like to acknowledge that this research was fun- ded by National Natural Science Foundation of China, grant number 71801089; Natural Science Foundation of Hunan Province, grant num- ber 2020JJ4263; Educational Department of Hunan Province, China, grant Number 21C0801; Domestic Visiting Scholars Program of Educational
Evaluation Models of Muscle Fatigue Recovery for Manual Demolishing Tasks 89
Department of Hunan Province, China, grant number 43. Hengyang Scie- nce and Technology Bureau Guiding project, China, grant number 23, 24, and 26.
REFERENCES
A. Grant, Katharyn. J. Habes, Daniel and Putz-Anderson, Vern. (1994). Psychophysical and EMG Correlates of Force Exertion in Manual work, International Journal of Industrial ErgonomicS Volume 13 No. 1. Borg, Gunnar A.V. (1982). Psychophysical Bases of Perceived Exertion, Medicine
and Science in Sports and Exercise Volume 14 No. 5. Duong, Barbara. Low, Millie. Moseley, Anne M. Lee, Raymond Y.W. and Herbert, Robert D. (2001). Time Course of Stress Relaxation and Recovery in Human Ankles, Clinical Biomechanics Volume 16 No. 7. Foulis, Stephen A. Jones, Stephanie L. van Emmerik, Richard E. and Kent, Jane A.
(2017). Post-fatigue Recovery of Power, Postural Control and Physical Function in Older Women, PLOS ONE Volume 12 No. 9. Ge, Shuwang. Chen, Songlin. Fu, Shengling. Zhu, Hongyu. Song, Yu and Yang, Lei.
(2008). Experimental Electromyography Estimation of Intramuscular Load of the Upper Limb in Static Postures, Industrial Health & Occupational Disease Volume 34 No. 4. Hu, Hong. Yi, Cannan. Li, Kaiway. Tang, Fan. Zuo, Huali and Pi, Kaiwen. (2018 a). Evaluation Model of Muscular Fatigue for Force Exertion Task, China Safety Science Journal Volume 28 No. 10. Hu, Hong. Yi, Cannan. Li, Kaiway. Tang, Fan. Zuo, Huali and Chen, Chengfeng.
(2018 b). Evaluation model of muscular fatigue of upper extremity for pulling task, China Safety Science Journal Volume 28 No. 8. Kang, Seung Roka. Min, Jin-Young. Yu, Changho and Kwon, Tae-Kyud. (2017).
Effect of Whole Body Vibration on Lactate Level Recovery and Heart Rate Reco- very in Rest after Intense Exercise, Technology and Health Care Volume 25 No. S1. Koppelaar, Elin and Wells, Richard. (2005). Comparison of Measurement Methods for Quantifying Hand Force, Ergonomics Volume 48 No. 8. Li, Kaiway and Chiu, Wen-sheng. (2015). Isometric Arm Strength and Subjective
Rating of Upper Limb Fatigue in Two-Handed Carrying Tasks, ploS ONE Volume 10 No. 3. Ma, Liang. Zhang, Wei. Wu, Su and Zhang, Zhanwu. (2015). A new simple local muscle recovery model and its theoretical and experimental validation, International Journal of Occupational Safety and Ergonomics Volume 21 No. 1. Nelson, Maximillian J. Bellenger, Clint R. Thomson, Rebecca L. Robertson, Eileen Y.
Davison, Kade. Daniela Schäfer, Olstad and Buckley, Jonathan, D. (2017). Maxi- mal rate of heart rate increase correlates with fatigue/recovery status in female cyclists, European journal of applied physiology Volume 117 No. 12. Nordmand Andersen, Philip. (2013). Breaking smart: The future of hand-held demolition. Sweden: Umeå college. Prati, Gabriele. Pietrantoni, Luca and Cicognani, Elvira. (2010). Self-efficacy Mode-
rates the Relationship between Stress Appraisal and Quality of Life among Rescue Workers, Anxiety Stress & Coping Volume 23 No. 4. Rashedi, Ehsan and Nussbaum, Maury A. (2016). Cycle Time Influences the Development of Muscle Fatigue at Low to Moderate Levels of Intermittent Muscle Contraction, Journal of Electromyography and Kinesiology Volume 28.
Rohmert, Walter. (1973). Problems in Determining Rest Allowances: Part 1: Use of Modern Methods to Evaluate Stress and Strain in Static Muscular Work, ApplIED ErgonOMICS Volume 42 No. 2. Shin, Hyun-Joo and Kim, Jung-Yong. (2007). Measurement of Trunk Muscle Fatigue
during Dynamic Lifting and Lowering as Recovery Time Changes, International Journal of Industrial Ergonomics Volume 37 No. 6. Tang, Fan. Yi, Cannan. Li, Kaiway. Zheng, Yanfang. He, Jiayuan and Peng, Hong.
(2021). Study of Muscle Fatigue Recovery for Simulated Demolishing Task, Chinese Journal of Ergonomics Volume 27 No. 4. Wang, Ruiyuan, ed. (2002). Exercise physiology. Beijing: People’s Sports Publishing House. Wang, Duming. Wang, Jian and Ge, Liezhong. (2004). Relationship between surface
electromyographic signal (sEMG) changes and subjective assessment of muscle fatigue isometric contractions, Space Medicine & Medical Engineering Volume 17 No. 3. Wood, David D. Fisher, Donald L. and Andres, Robert O. (1997). Minimizing Fatigue during Repetitive Jobs: Optimal Work-Rest Schedules, Human Factors: The Journal of Human Factors and Ergonomics Society Volume 39 No. 1. Yi, Cannan. Xie, Zejun. Li, Kaiway. Tang, Fan. Hu, Hong and Hu, Qiling. (2016).
Effects of Posture on Muscular Fatigue in a Pallet Truck Pulling Task with Single Arm, China Safety Science Journal Volume 26 No. 7. Zhou, Qianxiang. Shen, Yuhong. Ma, Chao and Zheng, Xiaohui. (2011). Evaluation Model for Muscle Fatigue of Upper Limb based on sEMG Analysis, SCIENCE CHINA-LIFE SCIENCES Volume 41 No. 8.
LISTED IN THE AHFE DIGITAL BOOKSTORE CATALOGUE
Explore the complete digital volume
Social and Occupational Ergonomics
Read this individual research paper free through the original publisher, or explore the full digital proceedings book.
ISBN 978-1-958651-41-4
Explore this ISBN in the AHFE Bookstore ↗Listed in the July 2026 bookstore catalogue; search by ISBN to confirm current availability · Digital book purchase optional