Yori Pusparani, Ben-Yi Liau, Yih-Kuen Jan, Hsu-Tang Cheng, Peter Ardhianto, Fityanul Akhyar, Chi-Wen Lung, Chih-Yang Lin (2022). Plantar Soft Tissue Stiffness Automatic Estimation in Ultrasound Imaging using Deep learning. In: Physical Ergonomics and Human Factors. AHFE Open Access, vol. 63, pp. 187–195. https://doi.org/10.54941/ahfe1002612
Preventing diabetic foot ulcers (DFU) is critical for diabetes mellitus (DM) patients. Increased stiffness of plantar foot may cause higher plantar pressure leading to a higher risk of DFU. Soft tissue stiffness can be determined by measuring the soft tissue thickness with indentation depth and stress. Therefore, we hypothesized that the deep learning model could detect the ultrasound image pixel change under soft tissue compression. This study aimed to apply the deep learning model to analyze the ultrasound image pixel thickness of plantar foot, then predict the soft tissue indentation depth and loading force for estimating the stiffness. This study has developed a motor-driven ultrasound indentation system to apply programmable compression and simultaneously assess soft tissue mechanical properties and responses in indentation depth and loading force. In addition, the effective Young's modulus was calculated to characterize mechanical properties of soft tissues in the first metatarsal head. The deep learning method employed the YOLOv5x model to train and detect the small object in the indentation depth, such as ultrasound image pixel changes. Finally, the dataset images were processed with labeling annotation from the soft tissue indentation depth and loading force. The deep learning results showed 0.995 in mean Average Precision (mAP), 0.999 in precision, 1.000 in Recall, and 0.013 in Loss. A significant correlation was found between the ultrasound image pixel changes and soft tissue indentation depth (r = 0.98, p < 0.05). Furthermore, a significant correlation was observed between the ultrasound image pixel changes and the loading force in the first metatarsal head (r = 0.85, p < 0.05). The validation and prediction models were lower than the training models in the effective Young's modulus results. However, the results of the initial modulus were similar between the three models. Our findings recommend that applying deep learning in the ultrasound image can predict soft tissue indentation depth and loading force to calculate the stiffness of the plantar foot.
One of the most severe diabetes mellitus (DM) issues is diabetic foot ulcers (DFU). (Zhang et al., 2017). For people with DM, the prevention of DFU is a critical issue. The lower stiffness and higher plantar soft tissue thickness in the metatarsal head have an increased risk of DFU (Naemi et al., 2017). Furthermore, the index for evaluating soft tissue relates to indentation depth and pressure loading force (Li et al., 2006). Therefore, soft tissue stiffness can be determined by measuring the soft tissue indentation depth and pres- sure loading force (Makhsous et al., 2008). Ultrasound has become one of the most regularly used imaging modalities in clinical practice (Liu et al., 2019). Jan et al. also used an ultrasound indentation system to measure pressure loading force and indentation depth in plantar soft tissues (Jan et al., 2012). In addition, previous studies detect and locate the myocar- dial wall based on ultrasound images using a deep learning model with an accuracy of 0.900 (Zhuang et al., 2020). Thus, real-time deep learning can assist the measurement of soft tissue thickness based on B-mode ultrasound images (Ardhianto et al., 2021). Therefore, we hypothesized that the deep learning model could detect the ultrasound image pixel change under soft tissue compression. This study aimed to apply the deep learning model to detect the ultrasound image soft tissue pixel thickness, then predict soft tis- sue indentation depth and pressure loading force for calculating the stiffness. Understanding soft tissue stiffness may be beneficial for preventing the risk of DFU.
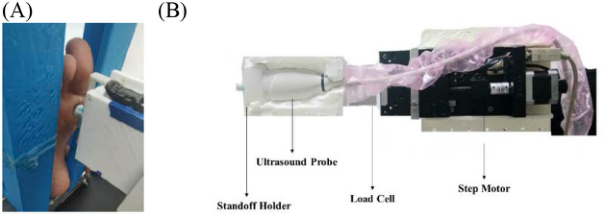
MATERIAL AND METHODS This study is a pilot study, and we choose one healthy subject as a sample. The subject was a 28-years-old female with a body mass index of 17.7 kg/m2. Our previous studies conducted the examination (Shen et al., 2021, Liau et al., 2018, Lung et al., 2016). The room temperature was maintained at 24 ± 2°C. Subject lying in supine position with an ultrasound probe position under the first metatarsal head (Figure 1A). The ultrasound images represent soft tissue under the first metatarsal head because DFU frequently occurs at pressure-sensitive sites (Perry et al., 1995).
This study has developed a motor-driven ultrasound indentation system to apply programmable compression and simultaneously assess soft tissue mechanical properties and responses in indentation depth and pressure loa- ding force. We used the motor-driven ultrasound indentation system for the indentation tests. The motor-driven ultrasound indentation system mainly consists of four parts: stepper motor, load cell, ultrasound system, and stan- doff holder. In detail, a linear ultrasound probe set to 12 MHz to analyze soft tissue (5-12 MHz, 128 elements, 39 mm Array footprint, Telemed, Vilnius, Lithuania) attached to a PC-based ultrasound system (sampling rate 1000 Hz, ArtUs EXT-1H scanner, Telemed, Vilnius, Lithuania). The ultrasound probe was mounted on the stepper motor (Model TL-SL1010-X, Tanlian Electro Optics Co., Ltd., Taoyuan, Taiwan), and 49-N load cell (sampling rate 100 Hz, Model UKA-E-005, Li-Chen Measure Co., Ltd., Kaohsiung, Taiwan) (Figure 1B). Soft tissue thickness was measured using ultrasound images in
Plantar Soft Tissue Stiffness Automatic Estimation in Ultrasound Imaging 189
Figure 1: Soft tissue indentation measurements. (A) Ultrasound probe position in the first metatarsal head. (B) Ultrasound indentation system.
soft tissue strain ratio. Soft tissue has loading and unloading in each cycle. Therefore, indentation depth and pressure loading force are obtained simul- taneously in five cycles. Additionally, we divided into two cycles become 12 sections. The 6 sections for the train data of deep learning, and another 6 sections for validation.
YOLO is a real-time object detection model that reformulates the object into a single regression issue (Redmon et al., 2016). Furthermore, YOLO employs a single neural network architecture to predict bounding boxes from dataset ultrasound images and provide faster detection (Goyal et al., 2018). Therefore, YOLO detects faster, especially for medical images (Ardh- ianto et al., 2021). This study built the detection with PyTorch 1.7.0 and YOLOv5x on Windows 10. The model parameters were: the batch size was 8, the momentum and weight decay rates were 0.937 and 0.0005, respectively, the learning rate was 0.01, and the epoch was 100. The tests were performed on a machine with the following specifications: Core I7 10700 CPU, 32 GB RAM, and an NVIDIA RTX 3080 10GB graphics card.
This study used 360 raw ultrasound images from 6 sections dataset con- taining various indentation depth. The selected images in 781 × 1563 pixels. We use the roboflow labeling platform to annotate the object and category with annotating name “thickness.” The labeled pictures are divided into the training and validation sets; we used 50% (180 images) from 3 sections for training and 50% (180 images) for validation. The training section labeled the soft tissue thickness between skin and bone using the 360 bounding box in the dataset. Furthermore, we input datasets labeled to YOLOv5x models to predict soft tissue thickness.
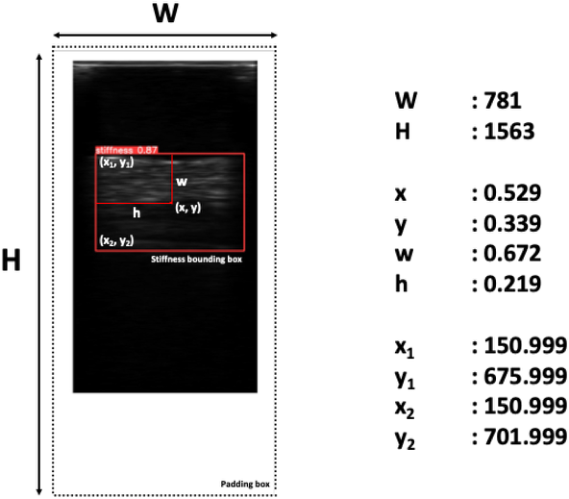
Classifier modification for the ultrasound dataset has one object category, namely thickness. The dimension of the output tensor is 3 × (5 + 1) = 18, where 3 represents the three template boxes for each grid prediction, and 5 illustrates each prediction box coordinates (x, y, w, h) and confidence (confidence, c). Each anchor box is calculated with confidence values of dif- ferent classes and four coordinate values (x, y, w, h), which can predict the thickness location. The prediction result of each image must be converted into an annotation with the format x1, y1, x2, y2 to calculate the original coordinates.
190 Pusparani
Figure 2: The example of converting YOLOv5x coordinates into pixel coordinates. YOLOv5x coordinates are x, y, w, h, W, and H. Pixel coordinates x1, y1, x2, y2; x and y, coordinates were presenting the center of the box; w, the width of the bounding box; h, the height of the bounding box; W, the width of the image; H, the height of the image.
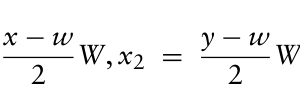
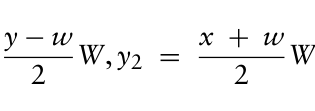
The YOLOv5x records four 180 corner coordinates of the bounding box prediction by converting the YOLOv5x coordinates as equation (1): x1 = y −w 2 W), y1 = x −w
Equation reproduced from the original PDF.Equation reproduced from the original PDF.
2 W (1)
Where x1, y1 represents the bounding box coordinates of soft tissue thi- ckness and x2, y2 represents the bottom of the bounding box coordinates (Figure 2). The center of the soft tissue thickness bounding box is x and y, the width and height of the bounding box area are w and h, and the width and height of the images are W and H. In detail, x1 and y1 are the top-left corner coordinates, and the below-left corner soft tissue thickness bounding box is x2 and y2.
The distance between skin and bone was measured using the distance for- mula. After getting the distance result, we calculated the section average of 180 steps in 12 sections, loading and unloading into 6 sections. Equation (2) shows the distance formula:
Equation reproduced from the original PDF.
2 (2)
(x2 −x1)2 +
y2 −y1
where d is the symbol of distance to calculate the distance between the skin and bone of soft tissue for measurements.
Plantar Soft Tissue Stiffness Automatic Estimation in Ultrasound Imaging 191
Regression analysis was performed to determine the correlation between soft tissue thickness pixel, indentation depth, and pressure loading force. The effective Young’s modulus (E) is a traditional material constant to quan- tify elastic properties of soft tissues (Hayes et al., 1972, Zheng and Mak, 1999). The equation used to extract effective Young’s modulus E is defined as equation (3): E = (1 −v2) 2a
k(v, a/h)
P w (3)
where v is the Poisson’s ratio, a is the indenter radius, k is a scaling factor dependent on the Poisson’s ratio, indenter radius, and tissue thickness, h is the soft tissue thickness, P is the loading force, and w is the indentation depth. Generally, 0.45 has been used as the Poisson’s ratio for biological soft tissues (Zheng and Mak, 1999). The k value was obtained from the information extracted from the publication of Hayes and colleagues (Hayes et al., 1972).
The correlations between soft tissue indentation depth of YOLOv5x pre- diction and soft tissue indentation depth and soft tissue pressure loading force were determined using a Pearson product-moment correlation analy- sis. All statistical tests were performed using SPSS 25 (IBM, NY, USA) at the significance level of 0.05.
RESULT
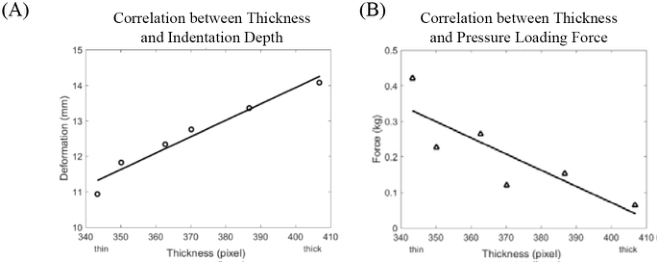
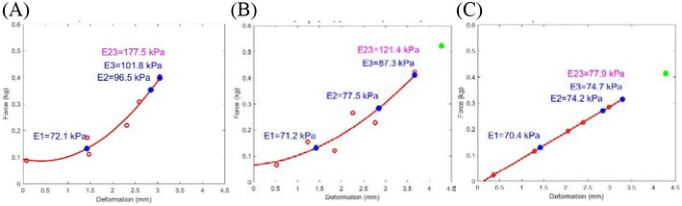
The accuracy of bounding box detecting ultrasound images in soft tissue thickness was shown 0.995 in mean Average Precision (mAP), 0.999 in pre- cision, 1.000 in Recall, and 0.013 in Loss. The accuracy has become the most popular metric to evaluate object detection models (Nasirahmadi et al., 2019). A high mAP means that the trained model performs well (Kumar and Punitha, 2020). Significant correlations between the soft tissue image pixel thickness and indentation depth (r = 0.98, p < 0.05) and the soft tissue image pixel thickness and pressure loading force (r = 0.85, p < 0.05) in the first metatarsal head as shown in Figure 3. The percentage of effective Young’s modulus (E1, E2, and E3) was 1%, 4%, and 14% between the validation model and prediction model (Figure 4).
DISCUSSION
This study demonstrated that the YOLOv5x model detected soft tissue thi- ckness to predict the indentation depth and pressure loading force under the first metatarsal head. Therefore, we hypothesized that YOLOv5x could detect soft tissue thickness, consistent with the hypothesis of this study. The accuracy of the YOLOv5x model is based on our prediction using the boun- ding box. Besides that, we also have significant correlations between the thickness detection of YOLOv5x with soft tissue loading indentation depth and pressure loading force. The r-value has shown a good result.
This study was compared with other studies to measure thickness using deep learning. However, other studies use different methods, such as
192 Pusparani
Figure 3: The scatter plots show the relationship between the image pixel thickness detection of Yolo with soft tissue loading property changes. (A) Correlation between pixel thickness and the indentation depth. (B) Correlation between pixel thickness and pressure loading force. (*, p < 0.05; **, p < 0.01).Figure 4: The effective Young’s modulus. (A) Training data. (B) Validation data. (C) Regression prediction data. (E1, Initial modulus; E2, nonlinear modulus; E3, effective Young’s modulus).Table 1. The comparison of detection performance with the related literature study.
Table available in the original PDF paper.
References Study Case Method Accuracy Yen et al. 2008 Tissue Thickness ANN 0.920 Foersch et al. 2021 Soft Tissue Sarcoma DenseNet121 0.871 This study Soft Tissue Thickness YOLOv5x 0.995
Note: ANN, Artificial Neural Network; DenseNet121, Densely Connected Convolutional Network; YOLO, You Only Look Once.
Yen et al. using the ANN model to predict tissue thickness has 0.920 accura- cies (Yen et al., 2008). Foersch et al. used the DenseNet12 model to predict soft tissue sarcoma with 0.871 accuracies (Foersch et al., 2021). According to the results of Guo et al., ultrasound images with YOLO have better accuracy (Guo et al., 2021). The detection performance comparison with the related literature study is in Table 1.
A model for soft tissues to be represented in the hysteresis loop of dyna- mic systems in loading and unloading conditions (Safadi and Rubin, 2014). We choose the middle in two cycles; one section is for the training, another section is for validation. The value can be presented as improving indentation
Plantar Soft Tissue Stiffness Automatic Estimation in Ultrasound Imaging 193
depth and pressure loading force of soft tissue. As proposed by Fung et al., a commonly used model to characterize hysteresis loops of tissue can be mode- led by characterizing the loading curve and the unloading curve (Fung, 1993). Soft tissue exhibits hysteresis in a loading-unloading test. Hence, we used hysteresis to predict soft tissue indentation depth and pressure loading force. Therefore, for training validation were used polynomial to get the value of soft tissue thickness correlation with indentation depth and pressure loading force (Brody et al., 1981).
In this study, we have two limitations. First, we use the deep learning model to train and detect the thickness using the bounding box. This paper only uses one box for each image to measure the image pixel thickness. In con- trast, machine learning refers to Scikit learning that may be more efficient and fast to get the regression result (Raschka and Mirjalili, 2019). Future studies may consider applying machine learning to get the regression result directly. Second, the limitation in this study used combined data between loading and unloading to predict soft tissue thickness. Predicting the soft tis- sue thickness separately during loading and unloading would provide a more detailed measurement of soft tissue stiffness change in future studies.
CONCLUSION
A significant correlation was found between the ultrasound image pixel changes and the soft tissue indentation depth. Furthermore, a significant cor- relation was also getting between the ultrasound image pixel changes and the soft tissue pressure loading force in the first metatarsal head. The vali- dation and prediction models were lower than the training models in the effective Young’s modulus results. However, the results of the initial modu- lus are similar between the three models. Our findings suggest that applying deep learning in the ultrasound image can be predicted soft tissue indentation depth and pressure loading force to calculate the initial stiffness.
ACKNOWLEDGMENT
The authors wish to express gratitude to Mr. Fahni Haris, Mr. Wei-Cheng Shen, and Mr. Jifeng Wang for their assistance. This study was supported by a grant from the Ministry of Science and Technology of the Republic of China (MOST 110-2221-E-468-005 and MOST 110-2221-E- 155-039-MY3). The funding agency did not have any involvement in data collection, data analysis, and data interpretation.
(2021). “A Review of the Challenges in Deep Learning for Skeletal and Smooth Muscle Ultrasound Images”. Applied Sciences, Vol. 11, no. 9, p. 4021. Brody, W.R., Butt, G., Hall, A. and Macovski, A. (1981). “A method for selective tissue and bone visualization using dual energy scanned projection radiography”. Medical physics, Vol. 8, no. 3, pp. 353-57.
194 Pusparani
Foersch, S., Eckstein, M., Wagner, D.-C., Gach, F., Woerl, A.-C., Geiger, J.
et al. (2021). “Deep learning for diagnosis and survival prediction in soft tissue sarcoma”. Annals of Oncology, Vol. 32, no. 9, pp. 1178–87. Fung, Y.-C. (1993). Mechanical properties and active remodeling of blood vessels.
Biomechanics. Springer. Goyal, M., Reeves, N.D., Davison, A.K., Rajbhandari, S., Spragg, J. and Yap, M.H.
(2018). “Dfunet: Convolutional neural networks for diabetic foot ulcer classifi- cation”. IEEE Transactions on Emerging Topics in Computational Intelligence, Vol. 4, no. 5, pp. 728–39. Guo, D., Zhang, G., Peng, H., Yuan, J., Paul, P., Fu, K. et al. (2021). “Segmentation and Measurements of Carotid Intima-Media Thickness in Ultrasound Images Using the Improved Convolutional Neural Network and Support Vector Machine”. Journal of Medical Imaging and Health Informatics, Vol. 11, no. 1, pp. 15–24. Hayes, W.C., Keer, L.M., Herrmann, G. and Mockros, L.F. (1972). “A mathemati-
cal analysis for indentation tests of articular cartilage”. Journal of Biomechanics, Vol. 5, no. 5, pp. 541–51. Jan, Y.-K., Lung, C.-W., Cuaderes, E., Rong, D. and Boyce, K. (2012). “Effect of viscoelastic properties of plantar soft tissues on plantar pressures at the first meta- tarsal head in diabetics with peripheral neuropathy”. Physiological Measurement, Vol. 34, no. 1, p. 53. Kumar, C. and Punitha, R. “Yolov3 and yolov4: Multiple object detection for surveil-
lance applications”. 2020 Third International Conference on Smart Systems and Inventive Technology (ICSSIT)2020, IEEE. Li, X., Wang, G., Huang, L. and Zhang, G. (2006). “Young’s modulus extraction methods for soft tissue from ultrasound measurement system”. Instrumentation Science and Technology, Vol. 34, no. 4, pp. 393-404. Liau, B.-Y., Chen, C.-L., Jan, Y.-K., Chiu, H.-Y., He, P.-S. and Lung, C.-W. “A com-
parative study of the effects of electrical stimulation and intermittent compressive forces on soft tissue mechanical properties”. AHFE 2017 International Confere- nce on Physical Ergonomics and Human Factors, 2017, July 17, 2017 - July 21, 20172018, Los Angeles, CA, United states. Springer Verlag. Liu, S., Wang, Y., Yang, X., Lei, B., Liu, L., Li, S.X. et al. (2019). “Deep Learning in Medical Ultrasound Analysis: A Review”. Engineering, Vol. 5, no. 2, pp. 261–75. Lung, C.W., Cheng, T.Y., Li, Y.J., Liau, B.Y. and Jan, Y.K. (2016). “Development
of an intermittent pneumatic compression system to manage soft tissue mech- anical properties”. Advances in Intelligent Systems and Computing, Vol. 482, pp. 317–25. Makhsous, M., Venkatasubramanian, G., Chawla, A., Pathak, Y., Priebe, M., Rymer, W.Z. et al. (2008). “Investigation of soft-tissue stiffness alteration in dene- rvated human tissue using an ultrasound indentation system”. The journal of spinal cord medicine, Vol. 31, no. 1, pp. 88–96. Naemi, R., Chatzistergos, P., Suresh, S., Sundar, L., Chockalingam, N. and Rama-
chandran, A. (2017). “Can plantar soft tissue mechanics enhance prognosis of diabetic foot ulcer?”. Diabetes research and clinical practice, Vol. 126, pp. 182–91. Nasirahmadi, A., Sturm, B., Edwards, S., Jeppsson, K.-H., Olsson, A.-C., Müller, S. et al. (2019). “Deep learning and machine vision approaches for posture detection of individual pigs”. Sensors, Vol. 19, no. 17, p. 3738. Perry, J.E., Ulbrecht, J.S., Derr, J.A. and Cavanagh, P.R. (1995). “The use of running
shoes to reduce plantar pressures in patients who have diabetes”. The Journal of bone and joint surgery. American volume, Vol. 77, no. 12, pp. 1819–28.
Plantar Soft Tissue Stiffness Automatic Estimation in Ultrasound Imaging 195
Raschka, S. and Mirjalili, V. (2019). Python machine learning: Machine learning and deep learning with Python, scikit-learn, and TensorFlow 2. Packt Publishing Ltd. Redmon, J., Divvala, S., Girshick, R. and Farhadi, A. “You only look once: Uni-
fied, real-time object detection”. Proceedings of the IEEE conference on computer vision and pattern recognition2016. Safadi, M. and Rubin, M. (2014). “Modeling rate-independent hysteresis in large deformations of preconditioned soft tissues”. International Journal of Solids and Structures, Vol. 51, no. 18, pp. 3265–72. Shen, W.-C., Jan, Y.-K., Lung, C.-W., Chen, H.-C., Li, C.-T., Bau, J.-G. et al. “Using
Ultrasound to Assess Microchambers and Macrochambers Tissue Properties After Walking at Different Speeds and Durations”. 2021, Cham. Springer International Publishing. Yen, P.-L., Chen, D.-R., Yeh, K.-T. and Chu, P.-Y. (2008). “Lateral exploration strategy for differentiating the stiffness ratio of an inclusion in soft tissue”. Medical engineering & physics, Vol. 30, no. 8, pp. 1013–19. Zhang, P., Lu, J., Jing, Y., Tang, S., Zhu, D. and Bi, Y. (2017). “Global epidemiology
of diabetic foot ulceration: a systematic review and meta-analysis”. Annals of medicine, Vol. 49, no. 2, pp. 106-16. Zheng, Y. and Mak, A.F. (1999). “Effective elastic properties for lower limb soft tissues from manual indentation experiment”. IEEE Transactions on Rehabilitation Engineering, Vol. 7, no. 3, pp. 257–67. Zhuang, Z., Liu, G., Ding, W., Raj, A.N.J., Qiu, S., Guo, J. et al. (2020). “Cardiac
VFM visualization and analysis based on YOLO deep learning model and modi- fied 2D continuity equation”. Computerized Medical Imaging and Graphics, Vol. 82, p. 101732.
LISTED IN THE AHFE DIGITAL BOOKSTORE CATALOGUE
Explore the complete digital volume
Physical Ergonomics and Human Factors
Read this individual research paper free through the original publisher, or explore the full digital proceedings book.
ISBN 978-1-958651-39-1
Explore this ISBN in the AHFE Bookstore ↗Listed in the July 2026 bookstore catalogue; search by ISBN to confirm current availability · Digital book purchase optional