Seong Geun Ahn, Dokshin Lim (2022). Comparison and Evaluation of Visual and Auditory Signals According to Different Levels of Information for Multimodal eHMI Design. In: Human Factors in Transportation. AHFE Open Access, vol. 60, pp. 559–567. https://doi.org/10.54941/ahfe1002490
Autonomous vehicles are rapidly evolving, but it is obvious that they need to be partially fused and adapted to the current road conditions. In this process, the newly proposed eHMI to replace human drivers presents various possibilities beyond simple communication. In this study, we confirmed that eHMI contributes to road safety and conducted a comparison and evaluation of complex combinations of visual and auditory signals. As a scenario for the experiment, a pedestrian accident with the driver’s limited view was set. This was produced in a 360-degree VR video so that participants could be more immersed in the risk of accident situations and eHMI signals. Participants conducted paired comparison, evaluations of intuitiveness and warning, and open discussion was also recorded in the process. Rather than providing an excessive amount of information via both auditory and visual channels, a combination of visual and auditory signals that complemented each other performed better from the pedestrians’ point of view.
It is expected that numerous traffic accidents caused by driver carelessness will disappear when the era of fully autonomous driving comes (Fagnant and Kockelman, 2015), but in the process, autonomous vehicles (AV) will gradu- ally be incorporated into the current manual driving conditions and will share space with other road users (ORU), including human drivers and pedestrians (Cui et al., 2017). However, the most important part of the evolution of AV is safety issues, which are also directly related to the potential benefits of AV and social acceptance by the general public (Jardim et al., 2013). Therefore, in such a mixed road environment, it is necessary to think about the dri- ving safety of the AV itself, as well as the role and technology for preventing accidents between ORUs.
AVs are replacing existing drivers, and the external human-machine inter- face (eHMI) is emerging as a new communication method, and accordingly many studies are being conducted and many patents and concepts are also appearing. eHMI systems have been designed for various purposes, but in
the majority of cases are related to pedestrian safety, specifically crossing (Dey et al., 2020), (Bazilinskyy et al., 2019). In order to create a safe road, effective communication with pedestrians is as indispensable as in the exi- sting road conditions before AVs were included. The goal of this study was to focus on evaluating eHMI signals from various perspectives such as signal type, information level, and driving experience from the perspective of pede- strians. Therefore, an experimental video was produced from the perspective of a pedestrian, and according to the level of information, not only visual signals but also auditory signals were combined to evaluate complex signal combinations.
In the process of selecting scenarios to be applied to the experiment, the following two conditions were considered: 1) Pedestrians and AVs must be close to each other to effectively apply auditory signals, and 2) an AV plays a role in preventing accidents between ORUs from the viewpoint of observers who are not involved in the accident. A pedestrian accident with the driver’s limited view was selected the accident situation that met these two conditions. A pedestrian accident with the driver’s limited view refers to an accident that occurs because the movement of the pedestrian is obscured by an object and the driver cannot predict the pedestrian’s approach (Samsung Traffic Safety Research Institute, 2015).
Due to the problem of participant safety, the experiment could not be con- ducted by implementing the actual situation. In this situation, inspired by the design of experiments using VR in existing studies related to pedestrian crossing (Lee et al., 2019a), the experiment was planned to be carried out by filming a video reproducing the accident situation in 360 degrees. This method completely excludes the risks of the experimental environment and helped participants make appropriate evaluations in situations where they were as immersed as possible in the risk of accidents.
METHOD
Participants A total of 36 participants (19 males, 17 females) were recruited for the expe- riment. Participants were undergraduate and graduate students of various majors, mainly engineering or design majors (mean age = 25, range = 20 to 31). Excluding five participants, the remaining 31 were driver’s license holders. The participants’ driving frequency was investigated in the pre- questionnaire, and it was separated into three levels of driving proficie- ncy according to the driving frequency surveyed (if a participant did not have a driver’s license, the driving proficiency was included in “poor” as not applicable). Each participant spent about 40 minutes, including a 25- minute experiment, for this study. After completing all experiments normally, compensation of about $10 was paid.
Experimental Design and Procedure This experiment was designed with two tasks (Lee et al., 2019b) to analyze the comparison and evaluation of various signal combinations sent to pede- strians by AV (that limits the view) parked in a pedestrian accidents with
Comparison and Evaluation of Visual and Auditory Signals 561
Table 1. Signals based on level of information.
Table available in the original PDF paper.
Visual signal Auditory signal
Level of information
0 None None 1 Light band Beep 2 Text (stop) Voice (stop)
Table 2. Signal combinations.
Table available in the original PDF paper.
Visual signal Auditory signal
Signal combination No.
1 Light band None 2 None Beep 3 Text (stop) None 4 None Voice (stop) 5 Light band Beep 6 Light band Voice (stop) 7 Text (stop) Beep 8 Text (stop) Voice (stop)
the driver’s limited view scenario, and all participants carried out both tasks. Three visual and auditory signals were used depending on the amount of information (see Table 1), and eight samples were used except that there was no combination of both signals (see Table 2).
Task 1: Paired comparison forced choice task This experiment was designed with two tasks to analyze the comparison and evaluation of various signal combinations sent to pedestrians by AV (that limits the view) parked in a pedestrian accident with the driver’s limited view scenario, and all participants carried out both tasks. Three visual and audi- tory signals were used depending on the amount of information (including none), and eight were used except that there was no combination of both signals. Each signal and combination can be found in detail in the tables.
By comparing a pair of randomly set signal combinations, we asked the participants to choose what they thought was better for accident prevention and appropriate, and all signals were experienced as 360-degree VR videos.
A total of 28 (8C2) cases can be paired in eight signal combinations, but seven pairs per participant were set to be compared in consideration of time, cost, and participant fatigue. Therefore, four participants were grou- ped together, and pairs were randomly distributed so that duplicate signal combinations were not evaluated, and the total number of participants was also adjusted to quadruple accordingly.
Task 2: 5-point rating task and open discussion It was conducted immediately after task 1, and the headgear was removed and proceeded with writing. Recalling the eight signal combinations, each intuitiveness and warning was evaluated. If the participant wanted to experi- ence the signal combination once again, it was played again on a PC monitor in front of the participant.
562 Ahn and Lim
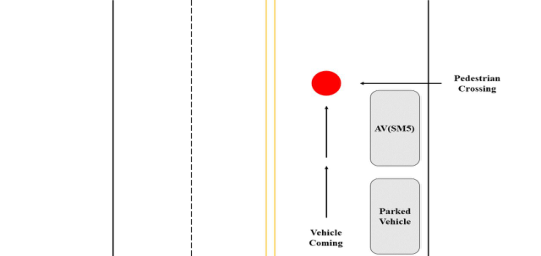
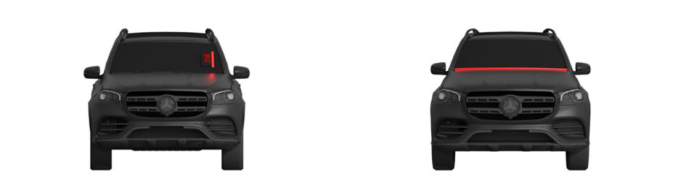
Figure 1: Arrangement and movement of vehicle.Figure 2: Visual signal on the eHMI.
Participants’ comment data, such as pros and cons, differences, and grounds for evaluation, were requested to freely talk about the experiment during the evaluation, and all of the participants’ comment data were also collected by the experimenter.
Equipment In the experimental video, two vehicles were used: a Renault Samsung SM5 and Kia Pride. The arrangement and movement of the vehicles are shown in detail in Figure 1. Light bands and rectangular displays were used as visual signals. The light bands wrapped between the hood and the windshield. The rectangular display was attached with double-sided tape on the top so that the A pillar and the windshield overlapped, and a prosthesis can be placed between the vehicle and the display in consideration of the angle viewed by the pedestrian. In Figure 2, it can be seen that the visual signal is attached. Both signals were controlled in the vehicle by wire, the light band used alone and the rectangular display used Arduino. The technician was not exposed to the video. The 360-degree VR video was filmed using an Insta360 ONE X2 from Insta360. In order to exclude the problem of visibility of display, it was filmed at night when the sun had completely set, and it was judged to be suitable for setting up a scenario where the view was limited at the crossing. Oculus’ Quest 2 was the headgear used in the experiment to reproduce the 360-degree VR video. Participants used a right-handed controller together to manipulate the playback and stop the video.
Comparison and Evaluation of Visual and Auditory Signals 563
Table 3. Estimated worth and chosen time for signal combinations.
Measurements In task 1, comparative selection data for pairs randomly assigned to each participant were collected. In task 2, intuitiveness and warning evaluations for all eight signal combinations were collected. In the case of intuitiveness, it was asked how easily and clearly the meaning was conveyed, and in the case of warning, it was asked how strongly and urgently the meaning was conveyed. In addition, free comments of participants during task 2 evaluation were also recorded in writing by the experimenter.
RESULTS
Paired Comparison Participants’ comparative selection results were analyzed by the log-linear Bradley-Terry method using the prefmod package (Hatzinger and Dittrich, 2012) in R (version 4.1.2). Using this method, the results of paired compari- son could be analyzed. Estimated worth is an indicator calculated from the results of participants evaluating how much each signal combination is better at preventing accidents. The results suggested that Nos. 5 to 8, which com- bine both auditory and visual signals, received relatively better reviews and No. 6 is the best design to prevent accidents. Detailed values are shown in Table 3.
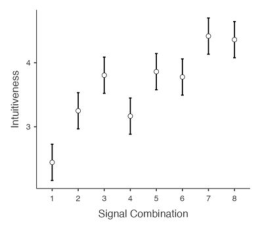
Intuitiveness ANOVA suggested that there was a significant difference between the eight signal combinations for intuitiveness evaluation (p<.001). Overall data sho- wed a tendency for intuitiveness to increase as the levels of information increased, but No. 4 was evaluated lower on average than No. 3 with the same level of information and No. 2 with the lower level of information. The combination with the highest score was No. 7, which was slightly higher on average than No. 8, the combination of the highest level of information. In addition, an interaction effect between visual and auditory signals was shown (p = 0.019). Results are shown in Figures 3.
564 Ahn and Lim
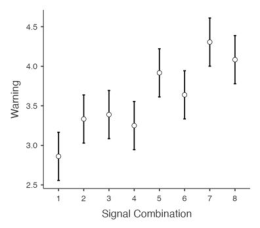
Figure 3: Intuitiveness evaluation for signal combinations & interaction effect between visual and auditory signals.Figure 4: Warning evaluation for signal combinations.
Warning ANOVA suggested that there was a significant difference between the eight signal combinations for warning evaluation (p<.001). Overall, the data ten- ded to be similar to the intuitiveness evaluation, but the difference in scores of No. 1 to No. 4, which had a low level of information due to the signal being used alone, was smaller than that of the intuitiveness evaluation. In addition, when No. 6 and No. 8, that is, voice (stop) and visual signals were combined, the score dropped relatively significantly. The combination with the highest score was also No. 7. There was no interaction between visual and auditory signals (see Figure 4).
Qualitative Feedback The comments collected in task 2 were recorded in one sentence summarized by the experimenter. After listing all of these sentences, we classified the repe- ated features in an inductive way. If the same content was repeated more than three times in the entire comment, it was used as the criterion for classifica- tion. Mainly, the characteristics and advantages and disadvantages of each signal have been mentioned a lot. The contents are detailed in the Table 4.
DISCUSSION
The first thing to look at was the relationship between the level of informa- tion in the signal combination and the evaluation results. In all indicators,
Comparison and Evaluation of Visual and Auditory Signals 565
Table 4. Qualitative feedback by number of times mentioned.
Table available in the original PDF paper.
Feedback Mentioned Times
14
The meaning of the light band is unclear. 18 The meaning of beep is unclear. 15 The combined form is the best. It can be complemented with each other.
6
Text (stop) is intuitive and clear. 9 Beep is familiar with the warning sound of the vehicle. 9 Voice (stop) is scary and unpleasant. 7 The light band catches my eyes more. 7 Voice (stop) is intuitive and clear. 7 The light band stands out more because it is large/long. 6 Auditory signals are advantageous because they are visually careless.
5
Voice (stop) is soft, so there is a lack of urgency. 5 The position of the Text (stop) is good for the direction in which the car approaches.
3
It would be more efficient if the signal was learned. 5 Visual signals will be recognized faster/are more efficient. 5 Beep is repetitive, so it is highly alert/intuitive/efficient. 5 Sound may not be heard or distorted in noisy environments. 4 The cause of the signal is unknown. 4 The word stop makes/read for now. 4 The display may not be visible. 3 It is embarrassing/difficult to know where the sound comes from and why.
3
The combination of light band + beep has very poor meaning transfer power.
it could be seen that the higher the amount of information (or when the two signals were combined), the higher the evaluation of participants, but it was not exactly proportional. In order to interpret the cause of these results, it is necessary to connect each signal with the evaluation received and the participants’ comments.
In the evaluation of light band and beep, where the information level was the lowest, beep tended to be a little dominant. Both were caused by low scores because their meaning was unclear, but participants gave higher scores to beep, a more familiar warning sound from existing vehicles. There was also an opinion that a high score was given because the beep sounded repeatedly.
Text (stop) and voice (stop) with a higher level of information showed a noticeable difference in task 1. Text (stop) received 20 choices, while voice (stop) only had half with 10 choices, and this difference is also seen in esti- mated worth. In addition, text (stop) received a better evaluation than light band, a one-step lower visual signal, while voice (stop) received a slightly lower evaluation than beep, a one-step lower auditory signal. This can be found in the participants’ open discovery, both of which increased in cla- rity as the level of information increased, but the sudden human voice felt somewhat unpleasant or the gentle voice did not convey urgency.
566 Ahn and Lim
As described above, when the two signals were combined, the evaluation of the participants increased significantly. This was prominent in task 1, and can also be confirmed in task 2. In addition, it can be seen that these evaluations reflect individual evaluations when signals are given alone. The combination with the low-rated light band or voice (stop) received a low score, and the combination with the high-rated text (stop) received a high score.
This shows that not only the difference in information level but also the harmony of the overall design is important. When the two signals are combined, the disadvantages of being used alone are supplemented and the advantages are strengthened. This appeared steadily in the participants’ open discussion (mentioned 14 times), and also in the interaction effect between visual and auditory signals in the intuitiveness evaluation.
Lastly, the analysis was conducted on other conditions investigated, such as participants’ driving experience and gender, but no significant difference was found.
CONCLUSION
In this study, we conducted a comparison and evaluation of eight combina- tions of visual and auditory signals. A pedestrian accident with the driver’s limited view was set to produce a movie file in a 360-degree VR video so that participants could be more immersed in the risk of accident situations and eHMI signals. Participants evaluated both intuitiveness and warning as well as gave feedback on the communication. The results showed that a combina- tion of visual and auditory signals that complemented each other performed well. Rather than providing an excessive amount of information via both auditory and visual channels, putting an emphasis on a channel (e.g. text ‘STOP’ or voice ‘STOP’) accompanied by the other supporting information (e.g. red light or beep sound respectively) would be modest for pedestrians in the urban environment.
ACKNOWLEDGMENT
This research was supported by Basic Science Research Program through the National Research Foundation of Korea (NRF) funded by the Ministry of Education (2021R1F1A1047870).
REFERENCES
Bazilinskyy, B., Dodou, D., & de Winter, J. (2019). Survey on eHMI concepts: The effect of text, color, and perspective. Transportation Research Part F: Traffic Psychology and Behaviour, Volume 67, 175–194. Cui, S., Seibold, B., Stern, R. and Work., D. B. (2017). Stabilizing traffic flow via a
single autonomous vehicle: Possibilities and limitations. IEEE Intelligent Vehicles Symposium (IV), 2017, 1336–1341. Dey, D., Habibovic, A., Löcken, A., Wintersberger, P., Pfleging, B., Riener, A., Martens, M., & Terken, J. (2020). Taming the eHMI jungle: A classification taxo- nomy to guide, compare, and assess the design principles of automated vehicles’ external human-machine interfaces. Transportation Research Interdisciplinary Perspectives, Volume 7.
Comparison and Evaluation of Visual and Auditory Signals 567
Fagnant, D. J., & Kockelman, K. (2015). Preparing a nation for autonomous vehicles: opportunities, barriers and policy recommendations. Transportation Research Part A: Policy and Practice, Volume 77, 167–181. Hatzinger, R., & Dittrich, R. (2012). Prefmod: An R package for modeling prefe-
rences based on paired comparisons, rankings, or ratings. Journal of Statistical Software, 48(10), 1–31. Jardim, A., Casley, S., & Quartulli, A. (2013). A Study of Public Acceptance of Autonomous Cars. Worcester: Worcester Polytechnic Institute. Lee, Y. M., Uttley, J., Solernou, A., Giles, O., Romano, R., Markkula, G., & Merat, N.
(2019a). Investigating Pedestrians’ Crossing Behaviour During Car Deceleration Using Wireless Head Mounted Display: An Application Towards the Evaluation of eHMI of Automated Vehicles. Driving Assessment 2019: Proceedings of the 10th International Driving Symposium on Human Factors in Driver Assessment, Training and Vehicle Design, 252–258. Lee, Y. M., Madigan, R., Garcia, J., Tomlinson, A., Solernou, A., Romano, R., Markkula, G., Merat, N., & Uttley, J. (2019b). Understanding the Messages Conveyed by Automated Vehicles. AutomotiveUI ‘19: Proceedings of the 11th International Conference on Automotive User Interfaces and Interactive Vehicular Applications, 134–143. Samsung Traffic Safety Research Institute. (2015). Characteristics and Countermea-
sure on Pedestrian Accidents with Limited Drivers’ View.
LISTED IN THE AHFE DIGITAL BOOKSTORE CATALOGUE
Explore the complete digital volume
Human Factors in Transportation
Read this individual research paper free through the original publisher, or explore the full digital proceedings book.
ISBN 978-1-958651-36-0
Explore this ISBN in the AHFE Bookstore ↗Listed in the July 2026 bookstore catalogue; search by ISBN to confirm current availability · Digital book purchase optional