Ying Shu, Wenyu Yang, Xin He (2022). The impact of different interaction methods of virtual objects on mobile AR experience. In: Human Factors and Systems Interaction. AHFE Open Access, vol. 52, pp. 290–297. https://doi.org/10.54941/ahfe1002168
Currently, immersive experience is the main highlight of mobile AR applications, but the impact of different interaction methods of virtual objects, which are the main experience content, is less studied.The purpose of this study is to investigate the impact of different interaction methods of virtual objects on the immersive experience, usability and satisfaction of mobile AR applications.In this study, 30 users experienced two different AR model presentation methods by customizing the independent variables (two different model interaction viewing methods, steering viewing Demo1 and free viewing Demo2), using a one-way within-group experimental design, and the data were processed by repeated measures ANOVA.The experimental report showed that Demo1 outperformed Demo2 in terms of spatial sense of immersion experience and ease of learning in usability; Demo2 outperformed Demo1 in terms of realism of immersion experience and efficiency of interaction with virtual objects; and Demo1/2 differed less in terms of fluency of the experiment.Our conclusion is that the interaction method of turning to view Demo1 is more immersive and spatial, and can be used in exhibition AR applications, and the interaction method of free view Demo2 is more novel and efficient in operation, and can be used in new AR games to improve user satisfaction. In general, AR applications should consider the age range of audience users when designing the viewing method of virtual objects, and choose the operation method that is more suitable for most people, easier to learn and more convenient.
Augmented Reality (AR) is a technology that calculates the position and angle of camera images in real time and adds corresponding images.In mobile AR applications, users go through a two-dimensional screen to feel the three- dimensional model and even manipulate the three-dimensional model, which is not the same as the way people move the object itself or turn their bodies to view the real object in reality. While AR connects the real world with the virtual world, the immersive experience is especially important for the actual effect of AR products. Therefore, virtual models need to help users experience a more realistic AR world through effective interaction.
The Impact of Different Interaction Methods of Virtual Objects 291
We found that most of the evaluations of AR applications in app stores are based on words such as novelty and newness, without mentioning the immersive experience. In researching how to make the immersive experie- nce of mobile AR improved, we found the difference between the viewing methods of virtual objects and real objects, and then we wanted to study the impact of different interaction methods of virtual objects on the immersive experience of mobile AR applications.
In the formal experiments, we define two interaction styles, focus the user experience on the immersive experience and usability with AR characteristics, and use satisfaction as an overall indicator to explore the impact of different interaction styles of virtual objects on the immersive experience, usability and satisfaction.
RESEARCH METHODS A one-factor within-group design was used for this experiment. The within- group factors are different interaction methods of virtual objects. For the presentation of virtual models in cell phone AR applications, to understand the impact of different interaction viewing methods on user experience.
Subjects A total of 30 participants were recruited for this study, 63% of whom were between the ages of 18 - 25 years, Eleven of them had never used mobile AR applications and 19 of them had used mobile AR applications. All subjects had normal or corrected visual acuity.
Experimental Design and Variables A one-factor within-group design was used for this experiment. The within- group factors are the different ways of interaction with virtual objects. Based on the difference in the way of viewing objects in virtual and real and the existing interaction operation of virtual objects, we conducted several rounds of pre-experimental corrections before the formal experiment, and distilled the following main aspects related to the degree of environmental immersion:
1. Rotation: Wrap-around viewing / Single finger rotation; 2. Zoom: close to the object / two-finger zoom; 3. Whether to interact with the screen: fixed in the environment does not follow the interactive operation change / follow the interactive operation to make the corresponding adjustment.
The final operationalized definition of each interaction method was deter- mined by combining the above three design factors.
1. Turn to view when users pick up the phone to view AR objects, users move through themselves to fully view the AR objects from all angles 2. Free view when the user holds the phone to view AR objects, the user can control the phone screen by finger to view AR objects from all angles.
For the immersive experience in the dependent variable, Jennett et al. and Georgiou and Kyza use Presence as an important metric when measuring
Table 1. Meaning of each index.
Table available in the original PDF paper.
Variable Definitions
Dependent variable dimenslons
Measurement indexes
lmmersion Experience
Sense of reality
The model display just now allows me to better substitute for the real enwironment Sense of space l can easily learn how to operate
The display model just now can help me build a better sense of space Usability Efficiency the operation just now is efficient Ease of learning Fluency The process just now was smooth and hassle-free Satisfaction Satisfaction l was satisfied with the whole experience
immersive experience. Presence refers to the degree to which the user feels like they are actually in the virtual environment, and Witmer and Singer found that the degree to which interaction with the virtual environment is natural and simulates the real world affects presence. The more realistic the design element, the stronger the connection the user feels to the real world, and the better the immersion and presence experience will be.
In addition, Pendit et al., evaluating an informal lexical AR application for visiting historical sites, concluded that the framework for evaluating AR applications should include a good sense of space as a metric to help guide users to find locations quickly using maps.Therefore, in this study, we divided the immersion experience into two dimensions: realism and spatiality.
Traditional usability measurements have placed more emphasis on ease of learning and ease of use. Irshad et al. argue that for AR on mobile devices, efficiency and fluency are important in the overall experience. Based on this, we divide usability into three dimensions of efficiency, ease of learning, and fluency, and the specific variables are explained in Table 1.
The experimental measures are immersion (realism and spatiality), usabi- lity (efficiency, ease of learning and fluency) and satisfaction(“I am satisfied with the whole experience”). The immersion experience includes realism (“The display model can help me better immerse myself in the real environ- ment”) and spatiality (“The display model can help me establish a better sense of space”), and usability includes efficiency (“I think The usability includes efficiency (“I think the operation was efficient”), ease of learning (“I can easily learn how to operate”), and fluency (“The operation was smooth and hassle-free”). All indicators were measured on a 10-point scale.
Experimental Procedure The experiment was conducted using a program demo developed specifically for the experiment, and the test device was Xiaomi 11. Subjects experienced the two interaction methods in a random order. For the formal experiment, users were required to experience the task of viewing the model under each
The Impact of Different Interaction Methods of Virtual Objects 293
Figure 1: Demo screen of Demo 1.
Figure available in the original PDF paper.
Figure 2: Demo screen of Demo 2.
Figure available in the original PDF paper.
interaction mode, and view the four angles of the virtual model: front view, left view, top view and top view in turn.
Experimental Materials For the different ways of viewing virtual objects, the design turns to view demo1 (all of the following are referred to as demo1) and free view demo2 (all of the following are referred to as demo2), and the details are shown in Figure 1 and Figure 2.
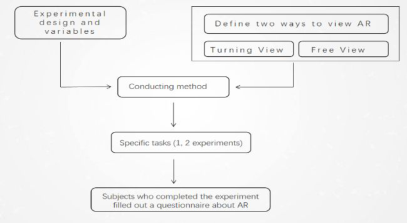
The subjects were asked to complete the task independently, focusing on the immersion experience and ignoring the effects of the model itself, response speed, and other performance aspects. If difficulties were encountered in the process, the subjects should explore on their own as much as possible, and they could ask for help from the main testers if they were unable to com- plete the task. After the experience, the subjects were required to complete a questionnaire to rate the experience, which included a total of immersion experience, usability and satisfaction. After the scoring, a short qualitative interview with the user was conducted by the main subject. The complete experiment took about 15minutes. The main flow chart of the experiment is shown in Figure 3.
Figure 3: The main flow chart of the experiment.Table 2. Results of descriptive statistics for each dependent variable.
Table available in the original PDF paper.
Immersion experience Availability Satisfaction M(SD) Reality M Sense of
The data collected were analyzed with descriptive statistics using SPSS 26.0 and the results are shown in the following Table 2.
According to the results of descriptive statistics, the subjects’ spatial sense and fluency in experience were higher for the virtual object viewing method of Demo1, and the subjects’ sense of reality, ease of learning and efficiency in experience, and satisfaction were higher for the virtual object viewing method of Demo2 And there is a significant difference in immersion experience and satisfaction between the two viewing methods.
One-Way Analysis of Variance (ANOVA) A one-way analysis of variance (ANOVA) was used to investigate the effect of the two interaction methods on the satisfaction of AR experience in terms of immersion experience and usability.
The Impact of Demo1 on Immersion Experience, Usability, and Satisfaction With AR Experience Descriptive statistics, chi-square test, and one-way ANOVA were performed on the experiments, and the specific analysis process is shown in Table 3.
Analysis of results: The results of the chi-square test, since the significance is all > 0.05, therefore, the chi-square is equal and in general, enables the analysis of variance.
Since this sample group is less than three, it is not possible to conduct mul- tiple sample comparison. From the results of the “one-way ANOVA”analysis, only demo1 availability3 was significant at 0.005, and since 0.005<0.05, it
The Impact of Different Interaction Methods of Virtual Objects 295
Table 3. The one-way ANOVA of the Demo2 experiment.
Table available in the original PDF paper.
Freedom Mean F Significance Sum of squares square
17.408 5 3.482 1.846 .142
Demo2 Immersion experience1
Inter group
45.258 24 1.886
Intra group
17.933 5 3.587 1.738 .164
Total 62.667 29 Demo2 Immersion Experience2
Inter group
67.210 24 2.064
Intra group
21.083 5 4.217 4.576 .005
Total 67.467 29 Demo2 Availability1 Inter group
22.117 24 .922
Intra group
12.092 5 2.418 1.737 .164
Total 43.200 29 Demo2 Availability2 Inter group
33.408 24 1.392
Intra group
34.975 5 6.995 6.337 .001
Total 45.500 29 Demo2 Availability3 Inter group
26.492 24 1.104
Intra group Total 61.467 29
can be concluded that: the experience satisfaction of demo1 is significantly influenced by the fluency of the experiment.
The Impact of Demo2 on Immersion Experience, Usability, and Satisfaction With AR Experience Descriptive statistics, chi-square test, and one-way ANOVA were performed on the experiments, and the specific analysis process is shown in Table 4.
Analysis of results: The results of the chi-square test, as the significance are >0.05 so the chi-square are equal and in general, enable the analysis of variance.
Since this sample group is less than three, it is not possible to conduct mul- tiple sample comparison. From the results of the “one-way ANOVA”analysis, there is a significance of 0.001 for demo2 usability3 and 10.005 for demo2 usability, and since 0.001<0.005<0.05, it can be concluded that: Demo2 experience satisfaction is significantly influenced by the ease of learning and fluency of the experiment.
Table 4. The one-way ANOVA of the Demo1 experiment.
Table available in the original PDF paper.
Freedom Mean F Significance Sum of squares square
8.738 5 1.748 1.618 .194
Demo1 Immersion experience1
Inter group
25.929 24 1.080
Intra group
14.790 5 2.958 1.056 .409
Total 34.667 29 Demo1 Immersion Experience2
Inter group
67.210 24 2.800
Intra group
21.671 5 4.334 2.588 .052
Total 82.000 29 Demo1 Availability1 Inter group
40.195 24 1.675
Intra group
11.186 5 2.237 1.285 .303
Total 61.867 29 Demo1 Availability2 Inter group
41.781 24 1.741
Intra group
16.829 5 3.366 4.528 .005
Total 52.967 29 Demo1 Availability3 Inter group
17.838 24 .743
Intra group Total 34.667 29
Comprehensive Questionnaire Results and SPSS Analysis
1. The overall satisfaction of the participants with the free view was higher than that of the steered view. 2. In terms of the realism of the experiment, the free view was better than the steered view; in terms of the creation of space, the steered view was better at creating space; in terms of the efficiency of the interactive view model, the free view was better than the steered view; in terms of the ease of learning the experiment, the steered view was better than the free view; in terms of the fluency of the experiment, the difference between the two was small. 3. There is a significant difference between the two interactive viewing models in terms of experience satisfaction, the experience satisfaction of steered viewing is significantly influenced by the fluency of the expe- riment, and the experience satisfaction of free viewing is significantly influenced by the ease of learning and fluency of the experiment.
EXPERIMENTAL CONCLUSION According to the experimental results and the results of data analysis, for AR products, the view of the virtual model is the focus, and the way to view the
The Impact of Different Interaction Methods of Virtual Objects 297
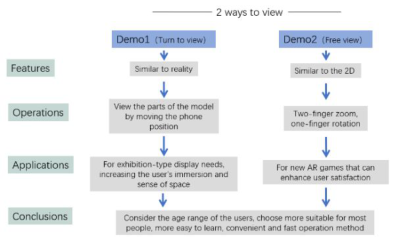
Figure 4: The research results.
virtual model is particularly important.The research results are organized as follows in Figure 4.
Result: AR applications should consider the age range of the people using them in designing the virtual object viewing method, and choose the opera- tion method that is more suitable for most people, more easy to learn and convenient.
ACKNOWLEDGMENT
A special thanks to all the volunteers who participated in the experiment and the questionnaire during the writing of the paper.
REFERENCES
Dillman KR, Mok TTH, Tang A, et al. A Visual Interaction Cue Framework from Video Game Environments for Augmented Reality[C].Proceedings of the 2018 CHI Conference on Human Factors in Computing Systems, 2018:1–12. Georgiou Y, Kyza EA. The Development and Validation of the ARI Questionnaire:
An Instrument for Measuring Immersion in Location – based Augmented Rea- lity Settings [J]. International Journal of Human – Computer Studies, 2017, 98( 2):24–37. Jennett C, Cox AL, Cairns P, et al. Measuring and Defining the Experience of Immersion in Games[J] . International Journal of Human – computer Studies, 2008, 66(9):641–661. Liu, Xing-Tong, Li, Wei-Ying. A study on the impact of visual design of guide ele-
ments on the experience of mobile AR interaction [j] Human Ergonomics Vol. 26, No. 5, October 2020.
LISTED IN THE AHFE DIGITAL BOOKSTORE CATALOGUE
Explore the complete digital volume
Human Factors and Systems Interaction
Read this individual research paper free through the original publisher, or explore the full digital proceedings book.
ISBN 978-1-958651-28-5
Explore this ISBN in the AHFE Bookstore ↗Listed in the July 2026 bookstore catalogue; search by ISBN to confirm current availability · Digital book purchase optional