Edwin Marte Zorrilla, Idalis Villanueva, Jenefer Husman, Matthew Graham (2022). Generating a Multimodal Dataset Using a Feature Extraction Toolkit for Wearable and Machine Learning: A pilot study. In: Artificial Intelligence and Social Computing. AHFE Open Access, vol. 28, pp. 67–76. https://doi.org/10.54941/ahfe1001448
Studies for stress and student performance with multimodal sensor measurements have been a recent topic of discussion among research educators. With the advances in computational hardware and the use of Machine learning strategies, scholars can now deal with data of high dimensionality and provide a way to predict new estimates for future research designs. In this paper, the process to generate and obtain a multimodal dataset including physiological measurements (e.g., electrodermal activity- EDA) from wearable devices is presented. Through the use of a Feature Generation Toolkit for Wearable Data, the time to extract clean and generate the data was reduced. A machine learning model from an openly available multimodal dataset was developed and results were compared against previous studies to evaluate the utility of these approaches and tools. Keywords: Engineering Education, Physiological Sensing, Student Performance, Machine Learning, Multimodal, FLIRT, WESAD
Since the engineering discipline was first taught at universities, its curriculum has included math and physics principles, which makes its teaching and lear- ning difficult and stressful (Bigotte et al., 2012; Kausar, 2010; Morgan,1990). Concerning the latter, few studies have been conducted connecting student performance and stress in engineering (e.g., Husman et al., 2015; Villanueva et al., 2018; Villanueva Alarcón et al., 2021).
Studies for stress and student performance with multimodal sensor measu- rement have recently gained momentum, especially using high computational hardware (Schmidt et al, 2018; Villanueva Alarcón et al, 2021) and mach- ine learning (ML). Machine learning strategies are helpful to deal with data of high dimensionality (a large number of inputs or variables) and provide
a way to predict new estimates for possible research designs in the future. In this work, we evaluate two paths, one being the statistical analysis and the other being the data processing and feature generation (inputs or varia- bles fed to the process or algorithm) using a third-party toolkit for wearable data. Data from our experiment, cleaning, organization and processing are presented. In the first path, the statistical analysis, we aim to find possible or better variables for posterior application in prediction or classification algo- rithms. The second path, using a third-party toolkit, consists of two steps: one being the generation of features in both the time and frequency domain, to be fed to the statistical analysis process making the data larger and robust. This step speeds up the process of generating variables removing the need for hand calculations or custom script programming. The second step of this path consists of the evaluation of the toolkit reliability by comparing several ML algorithms’ performances on known wearable sensor datasets (Föll et al., 2021; Schmidt et al., 2018). We used a combination of proprietary and free openly available tools, sof- tware, and scripts. For statistical analysis, we used the IBM SPSS Statistics version 26 software package. For generating data features we used a com- bination of customized scripts developed in Matlab Version 2019b and an open-source Python package, FLIRT, that focuses on processing physiologi- cal data for getting the features from sensors (Föll et al., 2021). For the ML processing, we used Scikit-learn, a machine learning library for the Python programming language. Also, we made use of WESAD (Wearable Stress and Affect Detection) which is a free and openly available dataset that consists of measurements of multiple sensors including EDA from 15 subjects, which serve as baselines for stress levels (Schmidt et al, 2018). We trained several ML models using features generated with FLIRT on the WESAD data and compared results with those reported by Föll et al. (2021) and Schmidt et al. (2018). By exploiting the two paths, the statistical analysis and the use and evaluation of a wearable toolkit, we first expect to get a better understanding of new possible predictors for further exploration in predictive models. Also by using the tools proposed, reducing the time to process and generate a new trusty data set.
METHODS
Research Design The data of this study is a subset of a larger National Science Foundation- funded research (EEC-1661100, 1661117, and 2120451). The research was a quasi-experimental design that integrated electrodermal activity (EDA) sensor measurements with self-reports and salivary biomarkers of stress (e.g., salivary alpha-amylase (sAA)) for triangulation. Participants were engi- neering students who were enrolled in a Statics Engineering course at a midwestern institution in the U.S. In coordination with the instructor, a pra- ctice exam of equivalent format and content was used for the experimental study (Villanueva et al., 2019). Self-reports and salivary analysis are not reported in this study although their onset and offset timestamps for each
Generating a Multimodal Dataset Using a Feature Extraction Toolkit 69
exam event (e.g., item-level questions) were used to match and synchro- nize to specified salivary data collection points for subsequent analysis and triangulation.
One hundred and sixty-one students took the practice Statics exam either in Fall 2018 or Spring 2019. Three practice exams, one for each midterm, were designed and approved by the class instructor and labeled as midterm 1 (M1), midterm 2 (M2), and midterm 3 (M3), respectively. For this study, we focused on M2 as it included a more comprehensive data set compared to the other mid-terms. M2 had 15 questions; the first 6 questions were conceptual and the remaining analytical (Villanueva Alarcón et al., 2021). The data col- lection process and protocol are described in several studies (Villanueva et al., 2018; Villanueva et al., 2019; Villanueva Alarcón et al, 2021). Participants took the practice exam on a laptop computer that purposely had a web browser already opened. The browser was pointing to a local web-server page that was hosting a custom-developed web interface for the practice exam. The exam application was programmed using PHP and Java- Script custom-developed by our team. The web interface for the practice exam was designed so that participants had to answer questions sequenti- ally. One exam question had to be answered before going to the next one. Once a question was answered, participants did not have the option to go back to the previous one. In-between questions the web application introdu- ced both, dummy questions, to allow for any lag in EDA data collection to be captured and surveys questions were prefaced at the onset of each question although these surveys were not used for the analysis presented. The dum- mies questions were introduced for recovery in-between questions and were not used for grading thus did not affect students’ exam performance results.
EDA measurements consisted of two types of signals that might be affected skin conductance. The tonic skin conductance level and phasic skin condu- ctance response. The tonic values changes are slow and smooth through time and the phasic peak values change rapidly with a stimulus (Empatica, 2022).
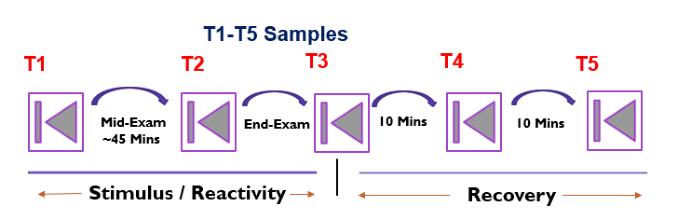
During the experiment, five salivary samples were collected, one at the beginning, the second at mid-exam (approximately 45 minutes into the exam), one at the end of the exam, and twice during recovery time every 10 minutes. The first three samples are considered to be the stimulus or reacti- vity in the experiment, and the following two are the recovery. We labeled the time samples for each time stamp collection as T1, T2, T3, T4, and T5 respe- ctively, see Figure 1. A note in stimulus and recovery time: we followed Vrijen et al. (2018) to calculate reactivity as they suggest that there are indications that reactivity is related to stress. Reactivity and recovery can be estimated by using equations 1 and 2, Vrijen et al. (2018). While participants are taking the exam time between T1 to T3 represents the stimulus, see figure 1. The same for the recovery from T3-T5, respectively.
Equation reproduced from the original PDF.
The web interface was designed to prompt participants for time marker data collection at set times. It is important to note that before the study
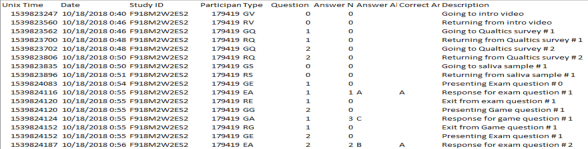
Figure 1: Data collection time stamp labeling during stimulus/reactivity and recovery. T1: practice exam begins, T2: 45 minutes into the exam, T3: end of the exam, T4: first 10 minutes of recovery, T5: 20 minutes of recovery. T1-T3 stimulus time while taking the practice exam, T3-T5 recovery time after the practice exam.Figure 2: Sample screen of an event file generated by the web exam.
began, all participants were trained through a short 3-5 minute video on how to properly provide the salivary sample and all participants swished their mouths with clean, distilled water 10 minutes before the study began per recommended company guidelines (Salimetrics, n.d.). Data collection and measurements were timestamped automatically in the web interface along with several other measurements, such as indicators of performance as described by Villanueva Alarcón et al (2021). At the end of the exam, a comma-separated value (CSV) file with a list of events was generated auto- matically for each participant. Each line in this file has 10 columns that provided timestamped information of the participant activities during the exam (Figure 2).
Data Curing and Pre-Processing We created a single folder for each participant’s data set. In each folder, we placed the previously generated event file, plus unzipped files from the weara- ble Empatica sensor, which provided EDA measurements. Empatica sensors contain six types of measurements in the CSV files such as accelerometer, blood volume pressure, EDA, heart rate, inter-beat interval, and temperature EDA Measurements are sampled at 4Hz, the other might be sampled at ano- ther rate as specified by Empatica (2021). In this work, we only focused on the EDA measurements.
All survey and salivary data were compiled, cleaned, and synthesized into a single master file with participant identifiers replaced with study IDs to
Generating a Multimodal Dataset Using a Feature Extraction Toolkit 71
anonymize participant entries. We selected a reduced sample set of 69 par- ticipants from the M2 practice exam dataset. The selected sample files were complete and were less prone to errors. Files with any missing, undefined or unrepresentable values (Nan Values) were rejected to reduce the use of other techniques for dealing with such values and to avoid re-calculations when errors occur due to these kinds of values. We evaluated 28 parameters from the tonic and phasic EDA data related to the T1-T5 values.
From each participant’s folder, we used the EDA file from the Empatica sensor and the event file from the M2 practice exam to generate all the sta- tistical data for posterior analysis. First, we ran a custom script in Matlab 2019b to loop into each participant folder and read the CSV event file. We were interested to collect information about each time the participant fini- shed a time-stamped data sample collection during the exam. From there, we obtained timestamps for each salivary sample and labeled them as T1-T5 (see Figure 1). Tonic and phasic values from EDA data were processed and extra- cted with the FLIRT Python library (Föll et al., 2021) and later post-processed in Matlab to grab values at the previously time-stamped values at T1-T5. At the same time, we obtained features from the raw EDA data following the indications from Föll et al. (2021) for posterior ML algorithms processing. From the phasic and tonic EDA data alone, we obtained 82 columns of fea- tures such as mean, peaks, min, max, among others (Föll et al., 2021). We left out six features all related to entropy calculations. Some of their values had NaN as values which makes it difficult for the ML algorithm. In case these features are required any imputations techniques might be used (Yuan, 2000). For the statistical analysis, our dataset consisted of tonic and phasic mean EDA values for each of the T1-T5 time stamps. Normalized changes of these values were also estimated as done in other studies (Vrijen et al., 2018). We also estimated the area under the curve with respect to increase (AUCI), and the area under the curve with respect to ground (AUCG) (Pruessner et al., 2003) for both tonic and phasic values. Both AUCI and AUCG are methods to estimate the area under the curve and are frequently associated and used in studies with repeated measurements over time as indicated by Pruessner et al. (2003). These values were also added to the previously calculated features for posterior statical analysis.
ANALYSIS AND DISCUSSION We evaluated 28 parameters from the tonic. Table 1 shows results for stu- dents’ performance in the exam. As can be seen in the third row the mean value of questions answered by T2 was 10.551. That means that at a T2 point (after 45 mins) most of the students had answered over 10 questions. The par- tial performance until that point consisted of mixed responses to analytical and conceptual questions. For the rest of the exam T3, the remaining que- stions were from 10 to 15 which were all are analytical (only 0.37 of the exam). It can be seen that the performance for the T2 questions, which have 6 conceptual questions, have a larger mean of 0.655 (Mid-Exam) against the 0.37 for the rest of the exam (4th row). This is a clear indication that students
Table 1. Descriptive statistics for students’ performance at T2 and T3. Problems in an engineering statics practice exam; N = 69; data presented as mean ± standard error of mean.
Table available in the original PDF paper.
Measurement Time Mean ± SEM 65.5% ± 1.74% at T2 (45 minutes into the exam) Student Performance (conceptual and Analytical questions)
10.551 ± 1.510
Questions Answered by students at T2 (45 minutes into the exam)
37.0% ± 2.69%
Student Performance at T3 57.4% ± 1.54% Student performance for Analytical Questions only
past 45 minutes into the exam (after T2)
Table 2. Correlation for students’ performance for problems in an engineering statics practice exam; N = 69; statistical significance as calculated through correlation is p<0.05 unless noted.
Table available in the original PDF paper.
Student Performance at the End of Exam AUCi Tonic
0.844
Student Performance (conceptual and Analytical questions) at T2 (45 minutes into the exam)
0.508 −0.238
Student performance for Analytical Questions only (past 45 minutes into the exam)
performed better for the conceptual problems (against 0.574 for the rest of the exam which aligns with Villanueva et al. (2021) results where students’ performance results were 65% for conceptual problems and only 58% for analytical in a practice exam.
Additionally, a Pearson correlation analysis was conducted for all varia- bles, and we summarized results in Tables 2, 3, and 4 for those correlations which are statically significant only. From Table 2, we can distinguish that participants that perform well by the T2 had a strong positive correlation with the exam final performance. Also, those that performed well with the analytical questions (questions answered between T2-T3) also had a strong positive correlation with the final exam performance, 0.844 and 0.508 respe- ctively. This implies that students that start well on the exam, will perform better throughout the exam. We found a negative and low correlation of −0.238 between student performance for analytical questions (questions answered post 45 minutes into the exam), and the area under curve AUCi for tonic values of EDA measurements. This correlation says the better the performance students get for analytical questions the smaller the area under curve AUCi gets.
Results related to the stimulus between T1 and T3 are shown in Table 3. The stimulus has a strong correlation with the Normalized Change of the Mean Tonic values (MTD-NC) between T1-T3 (full stimulus). Normalized data is estimated following Vrijen et al., (2018) and it has a correlation value of 0.994. This correlation suggests that students who show changes in their
Generating a Multimodal Dataset Using a Feature Extraction Toolkit 73
Table 3. Correlation for stimulus time (T1-T3) for problems in an engineering statics practice exam; N = 69; statistical significance as calculated through correlation is p<0.05 unless noted.
Table available in the original PDF paper.
Normalized Change of the
Stimulus / Reactivity Correlations
Mean Tonic values at T2
Mean Tonic values At T1
Mean Tonic values At T2
0.994
Normalized Change of the Mean Tonic values (Full Stimulus T1-T3)
−0.277 −0.272
Normalized Change of the Mean Tonic values at T3
Table 4. Correlation for recovery time (T3-T5) for conceptual and analytical problems in an engineering statics practice exam; N = 69; statistical significance as calculated through correlation is p<0.05 unless noted.
Table available in the original PDF paper.
Mean Phasic
Recovery Correlations Normalized Change
Questions Answered
of the Mean Tonic
(at T2)
Values (at T3)
values (T4-T5)
Normalized Change of the Mean Tonic values (T3-T5)
−0.31 −0.748
Normalized Change of the Mean Tonic values (T3-T4)
−0.28
Normalized Change of the Mean Tonic values (T4-T5)
−0.246
Normalized Change of the Mean Tonic values (T3-T5)
tonic values from the wearable sensor at T2 will show similar changes in the tonic values throughout the stimulus period (T1-T3). The rest of the corre- lations are low and negative correlations for T2-T3 and the mean value of the tonic data at T1-T2 and T2-T3, −0.277 and -0.272 respectively. These correlations are statically significant and occur between the mean of the tonic value and the change of the mean of the tonic values for the end of the exam, T1 (Start of the exam) and T2 (45 minutes into the exam).
The correlations occurring in the recovery time between T3 and T5, T4 inclusive are summarized in Table 4. Only correlations among variables that are statistically significant are presented. The four resultant correlations between Normalized Change of the Mean Tonic values (for recovery time (T3-T4, T4-T5, and T3-T5)) and questions answered (at T2) and mean pha- sic values (at T3) are negative with only one having a strong correlation low to moderate for the rest. A strong negative correlation exists between the nor- malized change of the mean tonic values for recovery time T3-T5 and T3-T4. One interesting correlation is between Questions Answered and the change of the mean tonic EDA values at the last minutes of recovery (T4-T5). If the participant has not been able to submit many questions, likely the student has not had a good exam experience or time has not been enough. Another
Table 5. Classification Performance using FLIRT on the WESDA dataset. For WESAD and FLIRT F1-score are reported with standard deviation. No standard devia- tion is reported for LDA, which is a deterministic model. Our implementation reports weighted F1-Score with standard deviation for 5 randomly initialized runs. F1-Macro score is reported in parenthesis and bold below. *Extended Kalman Filter.
44.70 (0.45) Our Implementation FLIRT Modular on WESAD Dataset
46.0 (0.41) (25.0)
50.0 (0.35) (25.0)
option is that students were not as prepared as expected for the exam. This correlation was −0.28, negative, and moderate correlation. The last column includes the only value of phasic data, or the rapid change in EDA values, with a statically significant correlation. The mean phasic value at T3 and the normalized tonic mean change at T4-T5, has a moderate negative correlation of −0.246.
Machine Learning Training We used the FLIRT to generate the features using the WESAD dataset with the same parameters used in those studies (Föll et al., 2021; Schmidt et al., 2018). We used linear discriminant analysis (LDA), AdaBoost (AB), and decision tree (DT) classifiers for our tests. We found the information provided by Schmidt et al. (2018) to be limited regarding the classification algorithm parameter as did Föll et al. (2021). We followed Föll et al. (2021) configurations for parameters and window selection. We used a 60 secs window with a step size, and scored with a macro F1-score, see Table 5.
Results for F1-score are slightly similar between previous studies and our weighted F1-score (Föll et al., 2021; Schmidt et al., 2018). A considerable difference is noticed when comparing the F1-Macro score among the three implementations. In our case, we choose the same labeling scheme provided in the WESAD dataset which goes from 0 to 7. In the WESAD documentation Schmidt et al (2018) ask to ignore labels from 5 to 7. We are not sure how both these studies (Schmidt et al., 2018; Föll et al., 2021) handled those labels which we think might be the reason for the significant difference in the F1-Macro score.
CONCLUSION
In this paper, we presented the process to generate and obtain a multimodal dataset including EDA measurements from wearable devices. We made use of A Feature Generation Toolkit for Wearable Data, FLIRT, which reduced
Generating a Multimodal Dataset Using a Feature Extraction Toolkit 75
considerably the time to extract clean and generate the data. We found low to strong correlations in some possible predictors of stress that are worth exploring for future research. In our experiment, students were exposed to an engineering practice exam as a stressful situation or stimulus, also considered reactivity. After the exam, a recovery time was provided so the student could reset or go back to a baseline. As some studies suggest, reactivity is related to stress (Vrijen et al., 2018), we used equations to estimate reactivity and recovery values from the EDA measurements and used those values to explore any meaningful correlation. Meaningful correlations or possible variables to explore as predictors are area under the curve AUCi, which correlates with Performance for analytical negatively, the normalized change of the mean tonic values which correlates with questions answered by students, and also with the mean phasic value at T3. Lastly, we developed several algorithms among LDA, AB, and DT using the WESAD dataset and the FLIRT toolkit obtaining comparable results between our test and the previous studies for weighted scores. Future directions include applying these algorithms to our dataset and exploring applications in real-time to predict stress situations within real engineering education environments that ultimately lead us to understand a bit better what affects students learning or performance in the classroom.
ACKNOWLEDGMENT
This material is based upon work supported in part by the National Sci- ence Foundation (EEC 1661100, 1661117, and 2120451). Any opinions, findings, conclusions, or recommendations expressed in this material do not necessarily reflect those of NSF.
Author contributions in this paper: Marte (data collection, analysis, fea- ture extraction, coding, dataset preparation, writing, editing). Villanueva (research design, data collection, and analysis, writing, editing); Husman (research design), Graham (data collection and preparation); Darcie Chri- stensen (data collection and preparation); Paul Vicioso Osoria (web-exam interface programming, data collection)
REFERENCES
Bigotte, E., Fidalgo, C. & Rasteiro, D. (2012). Understanding the Difficulties in Mathematics of Engineering Students in the Transition from High School to Higher Education. Empatica. 2021. Data export and formatting from E4 connect. [online] Availa-
ble at: <https://support.empatica.com/hc/en-us/articles/201608896-Data-export- and-formatting-from-E4-connect-> [Accessed 15 February 2022]. Empatica, 2022. [online] Available at: <https://support.empatica.com/hc/en- us/articles/203621955-What-should-I-know-to-use-EDA-data-in-my- experiment-> [Accessed 15 February 2022]. Föll, S., Maritsch, M., Spinola, F., Mishra, V., Barata, F., Kowatsch, T., Fleisch, E., & Wortmann, F. (2021). FLIRT: A feature generation toolkit for wea- rable data. Computer Methods and Programs in Biomedicine, 212, 106461. https://doi.org/10.1016/j.cmpb.2021.106461
Husman, J. (2015). Understanding engineering students stress and emotions during an introductory engineering course. ASEE Annual Conference & Exposition, Seattle, Washington. https://doi.org/10.18260/p.24958. Kausar, R. (2010). Perceived Stress, Academic Workloads and Use of Coping
Strategies by University Students. Journal of Behavioural Sciences, 20, 31. Morgan , A. T., (1990) A study of the difficulties experienced with mathematics by engineering students in higher education, International Journal of Mathematical Education in Science and Technology, 21:6, 975–988, DOI: 10.1080/0020739900210616 Pruessner, J. C., Kirschbaum, C., Meinlschmid, G., & Hellhammer, D. H. (2003).
Two formulas for computation of the area under the curve represent measures of total hormone concentration versus time-dependent change. Psychoneuro- endocrinology, 28(7), 916–931. https://doi.org/10.1016/s0306-4530(02)00108- 7 Salimetrics. (n.d.). Alpha-Amylase Saliva Collection. Retrieved February 27, 2022, from https://salimetrics.com/analyte/salivary-alpha-amylase/alpha-amylase- saliva-collection/ Schmidt, P., Reiss, A., Duerichen, R., Marberger, C., & Van Laerhoven, K. (2018).
Introducing WESAD, a Multimodal Dataset for Wearable Stress and Affect Dete- ction. Proceedings of the 20th ACM International Conference on Multimodal Interaction. https://doi.org/10.1145/3242969.3242985 Villanueva, I., Campbell, B. D., Raikes, A. C., Jones, S. H., & Putney, L. G. (2018).
A Multimodal Exploration of Engineering Students’ Emotions and Electrodermal Activity in Design Activities. Journal of Engineering Education, 107(3), 414–441. https://doi.org/10.1002/jee.20225 Villanueva, I., Husman, J., Christensen, D., Youmans, K., Khan, M. T., Vicioso, P., Lampkins, S., Graham, M. C. A (2019).Cross-Disciplinary and Multi- Modal Experimental Design for Studying Near-Real-Time Authentic Examination Experiences. J. Vis. Exp. (151), e60037, doi:10.3791/60037 Villanueva Alarcón, I., Zorrilla, E. M., Husman, J., & Graham, M. (2021).
Human-Technology Frontier: Measuring Student Performance-Related Responses to Authentic Engineering Education Activities via Physiological Sensing. Advances in the Human Side of Service Engineering, 338–345. https://doi.org/10.1007/978- 3-030-80840-2_39 Vrijen, C., van Roekel, E., & Oldehinkel, A. J. (2018). Alpha-amylase reactivity and recovery patterns in anhedonic young adults performing a tandem skydive. PloS one, 13(9), e0204556. https://doi.org/10.1371/journal.pone.0204556 Yuan, Y. (2000). Multiple Imputation for Missing Data: Concepts and New
Development.
LISTED IN THE AHFE DIGITAL BOOKSTORE CATALOGUE
Explore the complete digital volume
Artificial Intelligence and Social Computing
Read this individual research paper free through the original publisher, or explore the full digital proceedings book.
ISBN 978-1-958651-04-9
Explore this ISBN in the AHFE Bookstore ↗Listed in the July 2026 bookstore catalogue; search by ISBN to confirm current availability · Digital book purchase optional