José Machado, Nicolas Lori, Ana Coimbra, Filipe Miranda, António Abelha (2022). Medical Diagnosis Classification Using WEKA. In: Human Interaction & Emerging Technologies (IHIET-AI 2022): Artificial Intelligence & Future Applications. AHFE Open Access, vol. 23. https://doi.org/10.54941/ahfe100881
The use of data mining techniques is not new—commonly it is used in various other industries, such as financial services, marketing and manufacturing. The main goal of data mining is to find patterns in a large dataset that yield insight and expertise. Thus, in terms of healthcare, data mining methods have a wide range of uses, including diagnosing cancers, pattern recognition and prognosti-cating patient health outcomes. Each patient's diagnosis at the University of Porto Hospital (Centro Hospitalar Universitário Universitário do Porto) has an ICD-10-CM code. This data can be used to build a predictive model to classify diag-nosis using secondary diagnosis. Three datasets were then created to be tested using data mining techniques. As a result, the algorithm that had the best perfor-mance was the Random Tree (99.8% corrected classified instances) using the third dataset with the five main diagnoses of each patient as parameters
In a medical environment, records are created on a massive scale; however, these records are frequently used primarily by health professionals to consult their patients' health records. This presents an opportunity to utilize this massive dataset to create support tools for health professionals. Thereby, data mining techniques have a diverse spectrum of applications (Sousa et al., 2021)(Ferreira et al., 2020), including diagnosing diseases, identifying patterns, and even predicting length of stay or state of health evolution of a patient (Kumar et al., 2017)(Koh et al., 2005)(Kaur et al., 2006)(Tomar et al., 2013)(Neto et al., 2021)(Neto et al., 2019).
The use of data mining techniques is not new; in fact, it is widely used in a variety of other fields, including financial institutions, marketing, manufacturing and others. The overriding objective of data mining is to uncover trends inside a massive data set that can be translated into relevant knowledge/information (Kumar et al., 2017), (Koh et al., 2005), (Sujata et al., 2015), (Martins et al., 2021).
At the Centro Hospitalar Universitário do Porto (CHUP) all discharge reports are coded in the terminology ICD-10-CM, therefore, there are diagnostic records for each episode translated into this terminology.
Upon normalizing the data, they can be used in the data mining process to construct diagnostic prediction models. This is the aim of the study presented in this paper, to develop classification models for primary diagnoses using secondary diagnoses via data mining algorithms.
RESEARCH METHODOLOGIES The Knowledge Discovery in Databases (KDD) process is often categorized in the following steps (Kumar et al., 2017), (Kaur et al., 2006):
1. Selection - analyzing the database, a selection is made of the data that are relevant for the outlined objective
2. Pre-processing - The previously selected data is evaluated, and contradictions and missing data values are removed.
3. Transformation - As the name suggests, this is the process by which data is transformed. That is, the data must be structured before it can be used in the Data Mining process and thus find patterns.
4. Data Mining - Application of Data Mining algorithms
5. Interpretation/Evaluation - This phase is used to conduct an analysis and make the interpretation of the results. Following that, the trained Data Mining model is put to the test, with its accuracy being determined by the patterns' correct classifications. If the accuracy is less than optimal, the Data Mining model should be modified.
With regards to data mining, some of the most frequently used techniques are (Kumar et al., 2017), (Jothi et al., 2015):
o Association - Data mining technique that is used to discover relationships between objects that are all present. These rules will assist you in forecasting one situation in relation to another. Behavioral modeling and market classification techniques are used to analyze and classify all of a customer's shopping habits and product selections. Each relationship contains laws that are multilevel, dimensional, and quantitative.
o Classification - Classification approaches are supervised learning methods for categorizing raw data, and supervised learning methods are used in data classification. There are three main classifications available to data scientists today: decision tree, Bayesian classification, neural network, and support vector machine classification.
o Clustering - Used to create clusters based on similarity and to create clusters based on dissimilarity and is an unsupervised learning technique that utilizes clusters of related objects to classify them. Clustering is a widely used technique in image processing, data analysis, and pattern recognition. Linear regression, multivariate linear regression, nonlinear regression, and multivariate nonlinear regression are all forms of prediction.
Classifiers used The classifiers used are:
o J48 - It is a simple decision tree algorithm and a supervised learning technique. The algorithm is commonly used for classification, it employs divide and conquer tactics. Reduces the entire dataset into a subset dependent on data that is already in the training dataset (Kumar et al., 2017), (Neto et al., 2021), (Patil et al.,
o Random Forest - Numerous classification trees are constructed using this approach on the basis of the dataset. Tree votes are prepared according to a tree classification and classified based on a vector classification that helps to describe the overall picture (Kumar et al., 2017).
o Support Vector Machine (SVM) - It is a technique that relies on the interpretation of decision boundaries. This works to identify distinct individual instance data as belonging to different classes member objects (Kumar et al., 2017).
o Naïve Bayes - A naive Bayesian class compares an algorithm or neural network to the tree, perceptron, and network learners using rules. It implies that an attribute has a unique impact on each class (Kumar et al., 2017), (Martins et al., 2021).
Metrics of performance Several parameters will be compared in order to determine the optimal model for classifying the chosen dataset: Correctly Classified Instances, Incorrectly Classified Instances, Kappa Statistics, Mean Absolute Error, Root Mean Squared Error and time (Kumar et al., 2017), (Sujata et al., 2015), (Yasodha et al., 2014), (Patil et al., 2009):
o Correctly Classified Instances - percentage of correctly categorized data; o Incorrectly Classified Instances - percentage of incorrect classification of data;
o Kappa Statistics - a calculation of the degree to which observers or measures of the same categorical variable agree in a nonrandom manner; o Mean Absolute Error - average prediction error, calculated by averaging the difference between the predicted and actual values;
o Root Mean Squared Error - standard deviation of the prediction errors; o Time – length of time taken to train or model a dataset completely (in seconds).
Tool Used The study presented in this paper was conducted using the Waikato Environment for Knowledge Analysis (WEKA) software. WEKA is a software package that contains
Human Interaction & Emerging Technologies (IHIET-AI 2022) Artificial Intelligence & Future Applications https://openaccess.cms-conferences.org/#/publications/book/978-1-7923-8989-4 a collection of machine learning algorithms for data mining tasks. Along with presenting a large collection of algorithms, it also has the advantage of making it simple to load the type of data intended for use, as these data do not have to be in a specific format, allowing for example, to load data in CSV or ARFF, among others. It also has the advantage of running on any operating system as it is written in Java (Sujata et al., 2015), (Yasodha et al., 2014).
Dataset Since this study's purpose is to develop a diagnostic forecast model based on other diagnoses, three similar datasets were created to determine the optimal diagnostic approach. The first dataset was obtained from the CHUP coding platform's records; the dataset's attributes are listed in Table 1, and it contains 4322 records.
Table 1. Attributes of the Dataset I
Table available in the original PDF paper.
Attribute Type Description 1 Type of episode Nominal Type of episode, internment and ambulatory 2 Provenance Numeric health institution from where patient comes from 3 Type provenance Numeric type of origin, urgent or scheduled
4 Destination of discharge Numeric destination of the patient after discharge (e.g. home or death) 5 Length of stay Numeric number of days the patient has been in the hospital 6 Gender Numeric Gender
7 Age Numeric Age
8 Diag1 Nominal main diagnosis
9 Diag2 Nominal secondary diagnosis associated with the patient
10 Diag3 Nominal other diagnosis associated with the patient
The ICD-10-CM terminology codes are composed of up to seven characters, the first three of which represent the classification to which the code belongs. As a consequence, the need emerged to create a second dataset with the same attributes as the first, but with the exception of diagnostic attributes; these will contain only the first three digits of each diagnostic code, effectively generalizing these.
Consider the codes S52.1, S52.2, and S52.3, which denote "Fracture of the upper end of the radius", "Fracture of the shaft of the ulna", and "Fracture of the shaft of the radius", respectively. These would be represented by S51, which corresponds to
"Fracture of forearm." While details are lost, the primary diagnosis remains, and instead of three distinct records, there are now three identical ones. This way, by lowering the degree of specificity, the percentage of the same type of diagnosis can be increased.
The purpose of this second dataset is to determine whether data mining models perform better when diagnoses are generalized.
Since the objective of the paper is to create a model for predicting a main diagnosis through secondary diagnoses, a third dataset was created, where instead of having only the three main diagnoses, there are five main diagnoses.
Each dataset is represented by an example in the Table 2.
RESULTS AND DISCUSSION
This section presents the results obtained from the data mining process for each of the algorithms chosen for each dataset.
The classification of dataset I is summarized in Table 3. The table demonstrates that the algorithm that produces the highest number of correctly categorized cases for dataset I is the Random Tree, which also produces the highest kappa. However, in terms of model construction time, it is not the quickest. But even so, we may consider 1.88 seconds to be quite fast.
Regarding dataset II, as represented in Table 4, the algorithm with the best results remains the Random Tree, however the proportion of correctly categorized cases is lower than the result for dataset I. With the exception of the SVM algorithm, almost all algorithms demonstrated a decline in the percentage of correctly classified cases. However, the percentage of correctly classified cases is very low.
The dataset III is the better performer (see Table 5) since it has a greater amount of correctly categorized cases and needs fewer model construction time than the other two datasets.
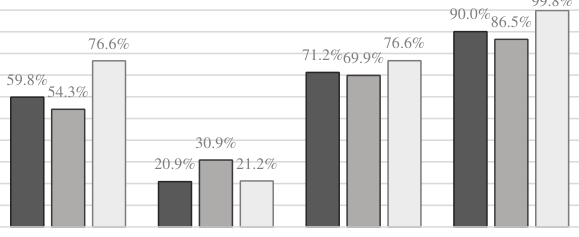
Fig. 1 compares the percentage of cases correctly classified by each algorithm with each dataset, allowing it simpler to understand each algorithm's efficiency. It is self-evident that the Random Tree algorithm is the best suited for the purpose of this article, having outperformed the other algorithms on all datasets.
Naïve Bayes SVM J48 Random Tree Dataset I Dataset II Dataset III
Figure 1. Correctly Classified Instances percentage of all algorithms for each dataset.
Figure available in the original PDF paper.
CONCLUSION AND FUTURE WORK Three similar datasets were used; datasets I, II and III; with the diagnostic parameters differentiated. The datasets I and II relied on only three primary diagnoses, whereas dataset III relied on five primary diagnoses. The distinction between datasets I and II is in the ICD-10-CM terminology; the dataset I included the entire diagnostic code, whereas dataset II only includes the first three characters.
Four algorithms were used to classify the three datasets: naive bayes, SVM, J48, and Random Tree. The Random Tree algorithm produced the best results across all parameters in all datasets.
At CHUP, for now, the medical records of each episode, with the exception of diagnoses, are in free text in reports. In the future, at CHUP these reports will be structured, allowing for the easy use of attributes such as medication used, symptoms, and even laboratory analysis results. With this change, it will be possible to incorporate this data into the dataset, resulting in even more precise predicting models.
ACKNOWLEDGMENTS
This work is funded by “FCT—Fundação para a Ciência e Tecnologia” within the R&D Units Project Scope: UIDB/00319/2020.
REFERENCES
Ferreira, D., Silva, S., Abelha, A., Machado, J. (2020) “Recommendation System Using Autoencoders,” in Applied Sciences. 10 (16). 5510. MDPI. Joshi, S., Shetty, S. R. P. (2015) “Performance Analysis of Different Classification
Methods in Data Mining for Diabetes Dataset Using WEKA Tool,” Int. J. Recent Innov. Trends Comput. Commun., vol. 3, no. 3, pp. 1168–1173. Jothi, N., Rashid, N. A., Husain, W. (2015) “Data Mining in Healthcare - A Review,” Procedia Comput. Sci., vol. 72, pp. 306–313. Kaur, H., Wasan, S. K. (2006) “Empirical Study on Applications of Data Mining
Techniques in Healthcare,” J. Comput. Sci., vol. 2, no. 2, pp. 194–200. Kumar, N., Khatri, S. (2017) “Implementing WEKA for medical data classification and early disease prediction,” 3rd IEEE Int. Conf. , pp. 1–6. Koh, H. C., Tan, G. (2005) “Data mining applications in healthcare,” J. Healthc. Inf.
Manag., vol. 19, no. 2, pp. 64–72. Martins, B., Ferreira, D., Neto, C., Abelha, A., Machado, J. (2021) “Data Mining for Cardiovascular Disease Prediction,” in Journal of Medical Systems. Volume 45(1). Springer. Neto, C., Brito, M., Lopes, V., Peixoto, H., Abelha, A., Machado, J. (2019)
“Application of Data Mining for the Prediction of Mortality and Occurrence of Complications for Gastric Cancer Patients,” in Entropy 21(12). 1163. MDPI. Neto, C., Senra, F., Leite, J., Rei, N., Rodrigues, R., Ferreira, D., Machado, J. (2021) “Different Scenarios for the Prediction of Hospital Readmission for Diabetic Patients,” in Journal of Medical Systems. Volume 45(1). Springer. 2021. Patil, B. M., Toshniwal, D., Joshi, R. C. (2009) “Predicting burn patient survivability
using decision tree in WEKA environment,” 2009 IEEE Int. Adv. Comput. Conf. IACC 2009, no. March, pp. 1353–136. Sousa, R., Lima, T., Abelha, A., Machado, J. (2021) “Hierarchical Temporal Memory theory approach to time series forecasting,” in Electronics 10(14). MDPI. Tomar, D., Agarwal, S. (2013) “A survey on data mining approaches for healthcare,”
Int. J. Bio-Science Bio-Technology, vol. 5, no. 5, pp. 241–266.
Yasodha P., Ananthanarayanan, N. R., (2014) “Comparative Study of Diabetic Patient Data’s Using Classification Algorithm in WEKA Tool,” Int. J. Comput. Appl. Technol. Res., vol. 3, no. 9, pp. 554–558.
Read this individual research paper free through the original publisher, or explore the full digital proceedings book.
ISBN 978-1-7923-8989-4
Explore this ISBN in the AHFE Bookstore ↗Listed in the July 2026 bookstore catalogue; search by ISBN to confirm current availability · Digital book purchase optional