Fabio Camposa, Dino Lincolna, Maria Nevesb, Walter Correiaa, Marcelo Soaresa (2022). Data Gathering for Ergonomic and Design Evaluations: Issues and Pitfalls. In: Advances in Ergonomics In Design, Usability & Special Populations: Part II. AHFE Open Access, vol. 19. https://doi.org/10.54941/ahfe1001257
There are moments within the process of creating an artifact, for instance at the initial requirements gathering or in the assessment phase, that input data is collected from users. There may be an impact directly on the results of the analysis of this data if, for some reason, this data input is not accurate. Another important matter when designing a new artifact is to find out the appropriate number of product reviewers that would better reflect the views of the target population to which the product is intended. In order to contribute to the strategy of increasing the accuracy of the evaluations and minimizing the chance of errors of judgment, this article identifies some case studies where the input from the users is not accurate because of the presence of a phenomenon known as Conjunction Fallacy and also where the number of product reviewers is not calculated properly. This article also presents a possible strategy to minimize errors of judgment caused by the fallacy and also presents a case study where the number of evaluators is calculated correctly by using statistical methods.
There are a number of data gathering techniques available to assist the designer or the ergonomist during the evaluation process of a product or the assessment of ergonomic conditions. Although such techniques are responsible for validating the whole process of artifact conception and ergonomic evaluation, it is possible to observe the presence of pervasive fallacies arising from randomness, and these deceits may lead the designer or the ergonomist to commit judgment errors.
No matter how good a team of designers or ergonomists may be, how well they known the methodologies chosen, or how complete is the assistive equipment used, if there were fallacies during the evaluation process it is not possible to reach a reliable outcome of the design process or the ergonomic assessments. But there are times when the designers, or the ergonomists, have to deal with probabilistic problems in their assessments. This kind of problems can characterize the outcome of an assessment as a random event.
Unlike a deterministic event where there is only one possible outcome, given a fixed set of values to its variables, in a random event there are multiple possible outcomes, each one with a probability associated to it. Therefore, a random event can be thought as an event with multiple probable outcomes, instead of a single predetermined one.
Considering the possibility of a non-reliable assessment endanger a whole design process or ergonomic evaluation, a possible strategy to increase the accuracy of the evaluations and minimize the chances of errors could begin with a greater understanding of the phenomena of randomness and its impact on the assessment process. Although evaluation of artifacts and ergonomic assessments were cited, it should be noted that an analogous issue could take place in any kind of evaluation process besides the ones found in design and ergonomics.
In order to contribute to the strategy of increasing the accuracy of the evaluations and minimizing the chance of errors, this article identifies some case studies of evaluation techniques where such random phenomena take place. In all of these case studies it is possible to find an example of how the phenomena of randomness were incorrectly considered, or in other words, how it was the cause of judgment errors.
In this sense, this paper presents, in Session 2, a description of two different kinds of randomness problems: conjunction fallacy and the representation of the sample space. This paper also presents, in Session 3, the results of experiments in which solutions were developed for these two problems. Finally, in Session 4, this paper presents the conclusions obtained in the process of conduction of this research and some final considerations about the subject.
SESSION 2: RANDOMNESS PROBLEMS In order to better understand the phenomena of randomness, this chapter describes briefly two potential problems arising from the randomness during the creation process of artifacts: conjunction fallacy and the representation of the sample space.
The Conjunction Fallacy
According to a basic principle of mathematics, the “rule of conjunction”, the probability that two events occur together cannot be higher than the smallest probability of each event happening isolated. For instance, considering two events "A" and "B", the probability of occurrence of a conjunctive event, the occurrence of "A" and "B" simultaneously, which we will denote as "A & B", can never be higher than the lowest probability of the event "A" or "B" isolated occurring.
For example, imagine that we have two dice, one black dice and one white dice. Considering that the event "A" happens when we throw the black dice resulting in number “5”, and the event "B" happens when we throw the white dice and the result is number “3”. If we throw the black and the white dice at the same time, then the probability of the event “A” happening is of 1/6 (since the dice has 6 faces and only one is a number “3”). The same way, the probability of the event “B” happening is of 1/6. However, the probability of these two events occurring together, “A & B" is 1/36 (since there are 36 possible outcomes and only one of them is “black dice = 5 and white dice = 3”).
Thus, when there is a judgment or evaluation of conjunctive events, and the user assigns a higher probability of occurrence to a conjunctive event than to any of the isolated events, we say a "conjunction fallacy" had occurred (Kahnneman,Tversky, 1973).
The importance of discussing the conjunction fallacy permeates many areas of knowledge where there is a need for users to choose from alternatives, especially when the answers present conjunctive events (Fox, Birke, 2002). In Design, these choices may happen at various points within the process of creating an artifact, either at the initial requirements gathering, in the assessment phase, or at any other moment (Baxter, 2011). An error of judgment arising from a possible conjunction fallacy would impact directly on the results of an analysis thus constituting itself as an important point to be studied (Figueiroa, Campos, Correia, 2012).
Representation of the Sample Space One point of decision when conducting research with users to determine their perception of a product is how many users should be chosen to be part of the evaluation phase so that data collected from this sample will indeed reflect the views of the target population of users.
In the Design field, there is a controversial debate over the definition of this quantity, more specifically in the field of interface design for websites. According to Nielsen & Landauer (1993), five trained users are enough to identify 70% of usability errors of a website. Some authors reaffirm this model of Nielsen, but others contest it (Figueiroa, Campos, 2012) An alternative approach to Nielsen´s would be to utilize a model to scientifically justify the amount of product reviewers, based on the use of a sample calculation model, widely used in statistics, to solve this problem. Through statistical procedures it is possible to verify how many evaluators should participate in the process and with what degree of confidence the opinion of the evaluators, or "sample" represents the opinion of the population of consumers of the product, or "sample space."
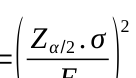
We may use the following equation to test the model proposed by Nielsen (2006) where the first 5 users would find approximately 75% of usability errors that affected the interaction with a website, to calculate the percentage of probability that these 5 users represents the sample space (Triola, 2008).
2
Equation reproduced from the original PDF.
Equation available in the original PDF paper.
σ=standard deviation of the sample .
∴{
Equation reproduced from the original PDF.Figure 1. Formula for the minimum number of participants representing the sample space
Figure available in the original PDF paper.
If we input all the correct numbers into this equation, then the results would be of 50% percent of probability, and therefore, 5 evaluators would not be enough to represent a population with a high degree of confidence.
SESSION 3: CASES STUDIES
This session presents the results of experiments in which solutions were developed for the two problems described earlier, the conjunction fallacy and the representation of the sample space. Although it is not possible to assure that the solutions proposed at the case studies solves all the problems arisen by the conjunction fallacy and the representation of the sample space, such knowledge contributes to the search for ways to minimize the error of probabilistic judgment arising out of such phenomenon and consequently to enhance the process of decision making.
Case Study One: Sample Space Based on the results obtained by the simulations done on the previous session, the number of 5 evaluators represents a low degree of confidence, less than 50% percentage, of probability to represent the sample space. Thus, considering the aforementioned rule of thumb, 5 evaluators would not be enough to get an acceptable representation of a population. The following case study aims to demonstrate how to find a number of evaluators that would represent, with a high degree of confidence (that is, higher than 92.5%), the sample space
The case study was conducted with a total of 40 design students attending the discipline of Human-Machine Interface from two Brazilian universities (Figueiroa, Campos, 2012). These students were presented during classes to the 10 usability heuristics of Nielsen (1993). Subsequently, these students evaluated the usability of the website a university.
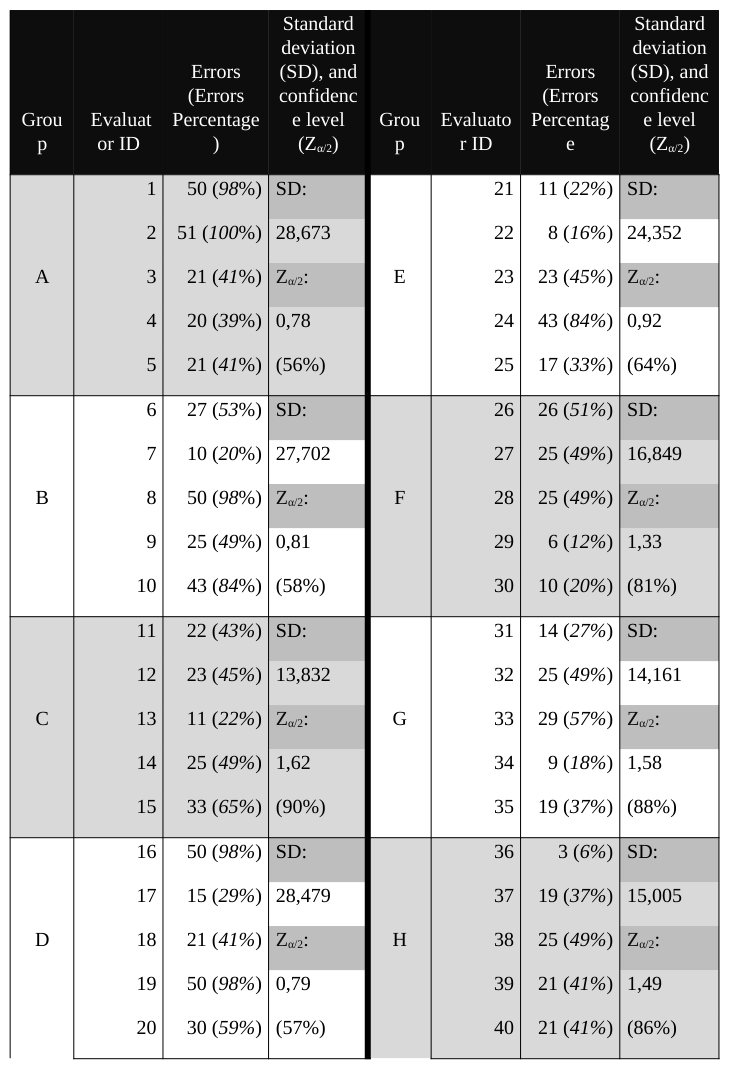
To make a parallel with the method used by Nielsen, these 40 evaluators were organized in groups of 5 evaluators each, as presented on Table 1. This table also shows the number of errors found by each user, along with the percentage relative to the “maximum number of errors to be found”, and the standard deviation and confidence level for each group.
The group "A", from Table 1, was composed by students considered by their teachers as “outstanding” in the area of usability. Therefore, the group “A” was chosen to be the control (reference) group for the other groups. The maximum number of errors found by the group “A”, was 51 errors; thus, since this is the “reference” group, the number 51 will represent the maximum number of errors to be potentially found by other evaluators in the analysis of the website.
It is worth noting that even with a high rate of errors found; the sampling group "A" returned a low degree of confidence, 56%.
Based in the statistical model of “infinite sample space” and “sampling groups”, it is possible to deduce the number of evaluators needed to get a high degree of confidence (Pocinho, Figueiredo, 2004). For this example, this number would be of 32.8, In other words, we can say that if there were 33 users evaluating the website then it would mean a sample that reflects the sample space of users of this product with a statistical confidence level of roughly 98%.
Table 1. Usability errors reported by users Standard deviation (SD), and confidenc Standard deviation (SD), and confidenc
Case Study Two: Conjunction Fallacy In order to verify that the occurrence of the conjunction fallacy is easily observed, a case study composed by two parts was developed (Figueiroa, Campos, 2012) .
In the first part of this case study, 50 of 92 undergraduate students, which we will designate "Group 1", received a description of a problem followed by five possible alternative solutions. They were asked to rank these alternatives from 1 to 5, in such way that the most likely alternative would receive the value of 1, the second most likely alternative would be assigned the value of 2, and so on. The question was intentionally designed to represent a usability problem easily identifiable by designers. The answers were designed to represent four different alternatives for the users to chose, were each alternative represented an isolated event, and one alternative represented a conjunctive event. The users assigned a higher probability to happen to the conjunctive event than to the isolated event that was part of this conjunctive event.
A similar situation happened with the second part of this case study, where another group, composed by 42 of 92 undergraduate students, which we will designate "Group 2", received a description of a new problem followed by another possible set of solution alternatives.
Again, it was expected the conjunctive event, that has less probability to occur than the isolated event, to be rated lower. However, according to the data collected, the conjunctive event received again a lower average value, meaning for the users as a higher probability to happen, than the isolated event that was part of this conjunctive event.
These two groups presented a higher percentage of conjunctive events were considered more likely to occur than isolated events. In the case of "Group 1", a total of 76% of respondents judged erroneously the conjunctive event as more likely to occur than some isolated event. In the "Group 2", the event conjunctive was chosen erroneously as more possible that some isolated event by 85.7% of the sample.
The analysis of the results of case studies one and two, presented a possible solution to minimize error in judgment caused by the propensity to belief in conjunctive events. This solution was to reshape the procedure so that all alternatives were conjunctive.
In order to verify this approach, a group of 93 new students, that were not part of neither “Group 1” nor “Group 2”, designated as “Group 3”, received the same description of the problem as in the case study one, however followed by alternatives arranged in such way that all the alternatives were conjunctive alternatives.
In contrast with the previous group 1 and group 2, the users chose the erroneous answer in only 17.2% of the cases. In other words, the users rated correctly, in 77 of the 93 interviews (82.8%).
CONCLUSIONS
By analyzing the procedure described by Nielsen in one of his works on the evaluation of interfaces (1993,b) , was possible to verify, based on basic statistical theory, that the degree of confidence of the results found by using his procedure was very low, as showed previously. The results of Case Study One indicated that it is possible to obtain a much higher degree of confidence of the results of a usability test of a website, if ones makes use of a number of evaluators calculated by statistical methods.
The statistical approach used in this case study did not intend to be exhaustive, in the sense that it represents only one of several statistical tools available to assist the designer in this task.
In short, despite the remarkable work done by Nielsen (1993), creating a set of heuristics to evaluate usability of websites, it is not useful to use the prescribed “5 users technique” described in his works (Nielsen, 2006) at least if one needs a level of confidence adequate to represent a population. It appears that the definition of the number of users must follow a scientifically proven statistical procedure to achieve significant levels of degree of confidence.
Regarding the Conjunction Fallacy, the idea of this paper was not to present a statistically valid demonstration but to verify if the occurrence of the conjunction fallacy is easily observed, also to indicate a possibility of a solution to it.
In fact, the results of the experiments of case study two were analyzed separately to verify the internal consistency of the experiment, and in both cases it was possible to find out that the fallacy had occurred. This was verified since a percentage of conjunctive events were considered more likely to occur than isolated events. In the case of "Group 1", a total of 76% of respondents judged erroneously the conjunctive event as more likely to occur than some isolated event. In the "Group 2", the event conjunctive was chosen erroneously as more possible that some isolated event by 85.7% of the sample.
The results of “Group 3" were that only 17,2% of the respondents incurred in an error of judgment when ranking the alternatives. It seems that there was a reduction in the percentage of choices misjudged when comparing with the results obtained previously with the "Group 2", of 85.7%, and also when comparing with the results of “Group 1”, of 76%.
In conclusion, although we may not assure that the solution proposed solves all the problems arisen by the conjunction fallacy, such knowledge contributes to the search for ways to minimize the error of probabilistic judgment arising out of such phenomenon and consequently to enhance the process of decision making.
REFERENCES
Baxter, M. (2011). “Projeto de Produto: Guia Prático para o Desenvolvimento de Novos Produtos “ 3ª Ed. São Paulo: Editora Edgard Blücher Ltda. Figueiroa, D. L., Campos, F., Correia, W. (2012) “A Falácia da Conjunção no Processo de Design”. In: P&D Design 2012 | 10º
Congresso Brasileiro de Pesquisa e Desenvolvimento em Design, 2012, São Luis. In: Anais do 10º Congresso Brasileiro de Pesquisa e Desenvolvimento em Design. São Luis Figueiroa, D. L., Campos, F. (2012): “A avaliação de artefatos em Design e os problemas decorrentes da aleatoriedade “ PhD Thesis. Universidade Federal de Pernambuco, Departamento de Design. Recife. Fox, C. R.; Birke, R. (2002) “ Forecasting trial outcomes: lawyers assign higher probabilities to possibilities that are described
in greater details. Law and Human Behavior", 26, n.2, p.159-73. Kahnneman, D.; Tversky, A. (1973) “ Extensional vs. intuitive reasoning: The conjunction fallacy in probability judgment.
Psychological Review”, 80 , No. 4, p.273-251. Nielsen, J. (2006) “Quantitative Studies: How Many Users to Test?.” Available at http://www.nngroup.com/articles/quantitative-studies-how-many-users/ Nielsen, J.; Landauer, T.K.(1993) . “ A mathematical model of the finding of usability problems”. In: Proceedings of ACM INTERCHI’93 Conference 1993, ACM Press, pp. 206-213. Nielsen, J. (1993) Usability Engineering. Academic Press, Boston. Pocinho, M.; Figueiredo, J.P. (2004) “Estatística e Bioestatística”. Lisboa, Madeira. Triola, M. F. (2008) . “Essentials of Statistics”. 3rd Ed. Prentice Hall. Boston
LISTED IN THE AHFE DIGITAL BOOKSTORE CATALOGUE
Explore the complete digital volume
Advances in Ergonomics In Design, Usability & Special Populations: Part II
Read this individual research paper free through the original publisher, or explore the full digital proceedings book.
ISBN 978-1-4951-2107-4
Explore this ISBN in the AHFE Bookstore ↗Listed in the July 2026 bookstore catalogue; search by ISBN to confirm current availability · Digital book purchase optional