Luximon Ameersing, Ganesan Balasankar, KaiWei Zhao, Lap Ki Chan (2018). 3D Functional Foot. In: Advances in Physical Ergonomics and Human Factors: Part II. AHFE Open Access, vol. 2. https://doi.org/10.54941/ahfe100080
The human foot is a complex biomechanical structure, which is consist of 26 bones, numerous muscles, ligaments, joints, nerves, arteries, veins and other soft tissues, is contributing the overall shape of the foot, and is mainly helping to bear the entire body weight, and static and dynamic motions of the foot. The foot has various dynamic motions such as dorsiflexion, plantar flexion, inversion, and eversion, abduction and adduction. The foot shape, structure, functions and motions will vary from one person to another person due to its own morphological structure. A footwear designer is necessary to know about these structures and functions of the foot to design and construct the footwear with comfort and fit. Conventional methods such as anthropometers, calipers, and tapes are used to get the anthropometric data to design the custom-made footwear. Recently, 3D scanning of the foot has been used to get the accurate anthropometric measurement foot data to design the good-fitting footwear. However, there are very few studies reported about Kinect for foot measurement. It is difficult to predict the changes of the foot inner structures during the various functional position of the foot. Therefore, this study tries to develop the 3D functional foot model with using different high heel position. It also considers the effect of land marking error. A result of this study is essential for the design of better fitting and comfortable footwear.
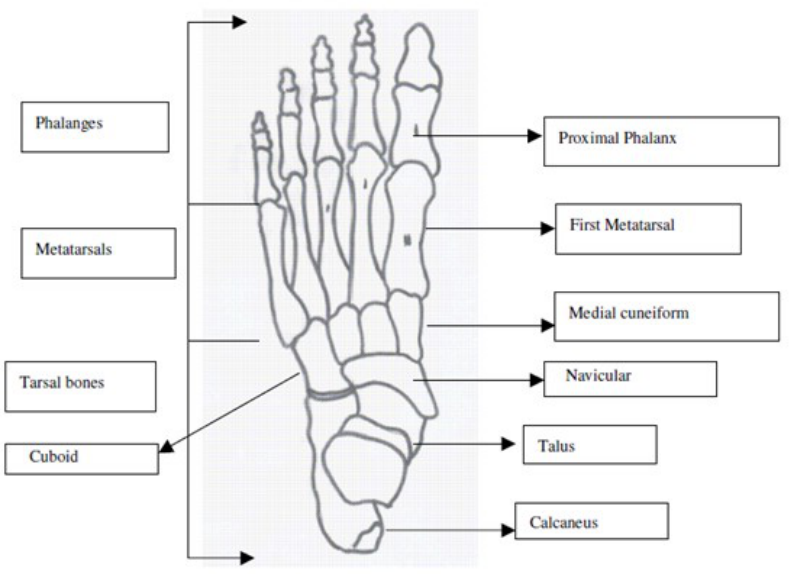
The human foot helps to contact the ground while standing and walking motion. It has versatile function including body support, stability, moving forward, moving backward, and changing the body into different direction. The foot motion is generated with the help of twenty-six bones (Figure 1.), thirty-three joints, more than hundred ligaments, muscles, nerves, arteries and veins. Generally, the human foot bone is divided into tarsal bones, metatarsal bones, phalangeal bones (Luximon, 2013; Chan, 2013). Moreover, the foot can be classified into three segments (rear foot, midfoot, and forefoot), excluding tibia and the fibula segments. The rear foot consists of calcaneus and talus. The midfoot consists of five tarsal bones and the main arch, which is the navicular, cuboids, and cuneiform. The forefoot includes all the metatarsals (the ball of the foot) and phalanges (toes). There are different types of joints present in the ankle and foot: ankle joint, subtalar joint, midtarsal joints, and metatarsophalangeal joints. Mostly, the foot motions occur at the ankle joint, subtalar and midtarsal joints, and in three planes: sagittal, transverse and coronal plane (Hamil and Knutson, 1995). The subtalar and midtarsal joints helps to make pronation and supination motion. The dorsiflexion movement s International
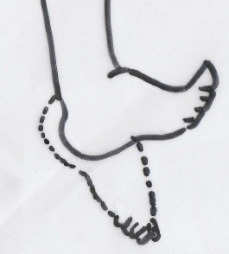
Edited by T. Ahram, W. Karwowski and T. Marek occurs when the foot moves toward the leg at the ankle joint (Figure 2.). The plantar flexion is just opposite to the motion of dorsiflexion motion, which is leg moves downwards from the leg at the joint axis rotation of ankle joint (Figure 2). Approximately, the normal range of motion of planar flexion motion is 50 degrees and dorsiflexion motion is 20 degrees. However, the foot shapes will vary from one person and another person due to different morphology characteristics especially arch and lateral side of the foot (Krauss et al., 2008). Although, researchers have recommended that some distinguish features such as height of the arch and angle, talonavicular bulge, concavity of the lateral border and navicular drift to differentiate the foot types (Razeghi, 2002).
The footwear had been used to avoid the injuries from walking, running, jumping, and sports. Previously, there are various manual measurement methods used to measure foot in order to design footwear. For footwear design, 3D foot scanning has been considered as a good measurement tool to get the anthropometric data human body parts (Rocchini et al., 2001; Rossi, 1984). Accurate measurement of foot is the first step to design the footwear with better fit and comfort. Therefore, this study tries to develop the 3D functional foot based on the different high heel position of the foot.
Figure 1. Superior view of the foot
s International
Edited by T. Ahram, W. Karwowski and T. Marek
a) Plantar flexion b) Dorsiflexion
Figure 2. Dorsiflexion and plantar flexion
METHODS
Participant A 25 years old female student from The Hong Kong Polytechnic University was recruited for this experiment. The investigator examined the subject’s foot to find out the presence of any foot deformities such as flatfoot, cavus foot, hallux valgus, and other foot deformities or illness. The researcher found that there were not any foot deformities in the subject foot. Then, she was instructed to read and sign the consent form and all the experiment procedure were explained to the subject by the investigator. The participant weight was 60Kg and the height 1.62m.
Equipment Generally, 3D foot scanners are very expensive equipment. However, in 2012, the Microsoft company released a Kinect XBOX360 (Figure. 3) for playing video game purpose to identify the players, gestures and comments, voice for playing video games (Taha et al., 2013). However, recently, researcher tries to use the Kinect for scanning the human body parts in various fields such as medical and health care, and footwear industry. In addition, Kinect scanner is less expensive than other method. Therefore, this study tries to scan and examine the different functional position of the foot. There are 3 different various heel height platform (20mm,40mm, 70mm) used to scan the foot in the experiment.
Figure 3. Kinect - XBOX 360 3D scanner
s International
Edited by T. Ahram, W. Karwowski and T. Marek
PROCEDURE
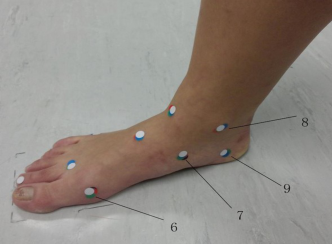
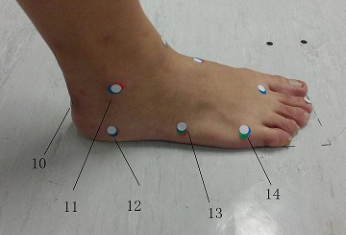
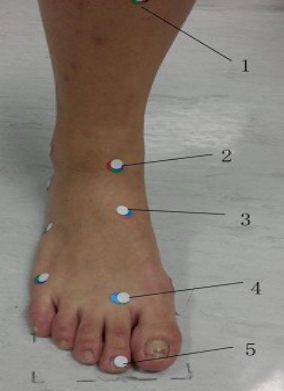
The Kinect 3D scanner was used to scan the subject’s foot. Before starting the experiment, a health care professional specialist (Occupational Therapist) marked the important anatomical landmarks on the subject’s right foot. The following 14 anatomical landmarks (Figures 4 and 5) were selected in this experiment : Calcaneal Tendon insertion point (CT), Medial malleolus (MM), Lateral malleolus (LM), Navicular tubercle (NT), first metatarsophalangeal joint (MTPJ-1), second metatarsophalangeal joint (MTPJ-2), fifth metatarsophalangeal joint (MPJ-5), tuberosity of fifth metatarsal bone (FMTT), Medial border of the calcaneus (MBC), Lateral border of the calcaneus (LBC), Shin of the Tibia (ST), Tip of the second toe (TST), Anterior border of the lower end of Tibia (ABLT), Mid dorsal point (MDP) of the foot. In the figures the landmarks have been numbered: 1. Shin of the Tibial bone (ST) 2. Anterior border of the lower end of tibia (ABLT) 3. Mid dorsal point (MDP) 4. Second metatarsophalangeal joint (MTPJ-2) 5. Tip of the second toe (TST), 6. First metatarsophalangeal joint (MTPJ-1) 7. Navicular tubercle (NT) 8. Medial malleolus (MM) 9. Medial border of the calcaneus (MBC) 10. Calcaneal Tendon insertion point (CT) 11. Lateral malleolus (LM) 12. Lateral border of the calcaneus (LBC) 13.Tuberosity of fifth metatarsal bone (FMTT) 14. Fifth metatarsophalangeal joint (MPJ-5).
Figure 4. Medial view of right foot with landmarksFigure 5. Lateral view of right foot with landmarks
All the landmarks were identified by using the palpation method. There are three different height level platforms used to create different functional positions. These included a 20mm heel height platform, a 40mm heel height platform, and a 70mm heel height platform. The investigator manually rotated the Kinect scanner around the foot to get the 3D foot shape data. The Kinect was used to scan the foot in different functional position of the foot including Zero level (floor), 20mm heel height platform, 40mm heel height platform, and 70mm heel height platform.
s International
Edited by T. Ahram, W. Karwowski and T. Marek The investigator placed 3 markers on the floor for later data alignment. In the first part of this experiment, the occupational therapist marked the 14 black color landmarks on the foot, and the subject was instructed to stand between the marked lines on the floor. Then, Kinect 3D scanner was used to scan the foot. In the next step of scanning procedure, the subject was instructed to stand on the 20mm high heel platform, then 40mm and 70 mm high heel platform respectively.
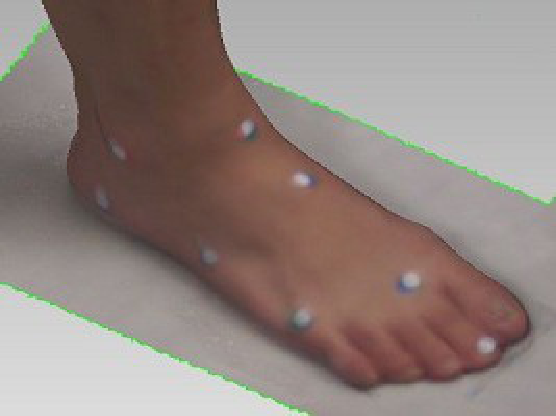
The second part of this experiment, the examiner started scanning with 70 mm high heel platform without changing the position of the foot from the first part of the experiment method. The Occupational Therapist palpated the anatomical landmarks and placed a red color sticker (Figure 6). The participant was requested not to move the foot. The difference in landmark is used to calculate the shift in the original marking when at zero level. The procedure was repeated for 40mm high heel platform (blue color landmark), 20mm high heel height (green color landmark) and zero level floor position (white color landmarks). The 3D scanned foot with landmarks is shown in Figure 7.
Figure 6. Anterior view of right foot with landmarksFigure 7. Lateral view of 3D image of right foot with landmarks
s International
Edited by T. Ahram, W. Karwowski and T. Marek
RESULTS
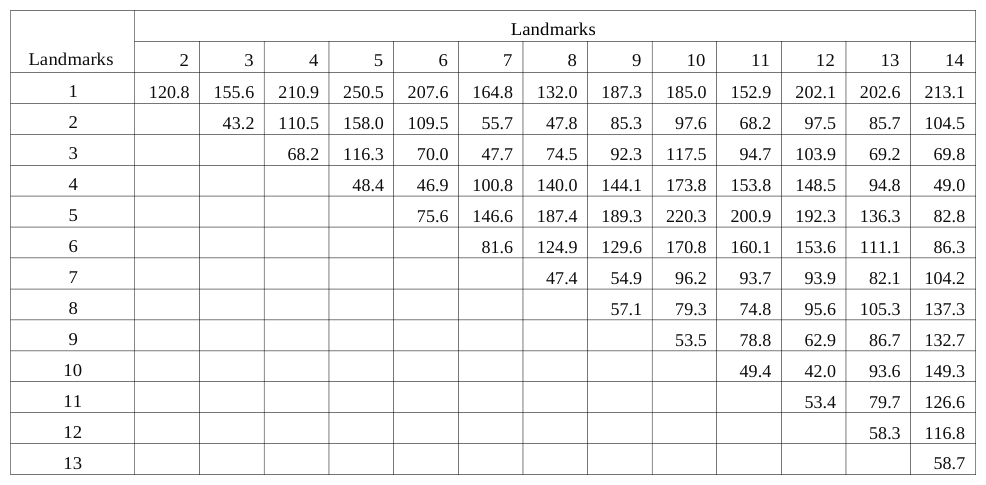
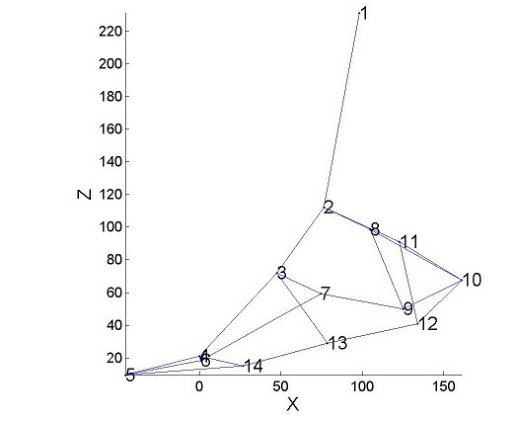
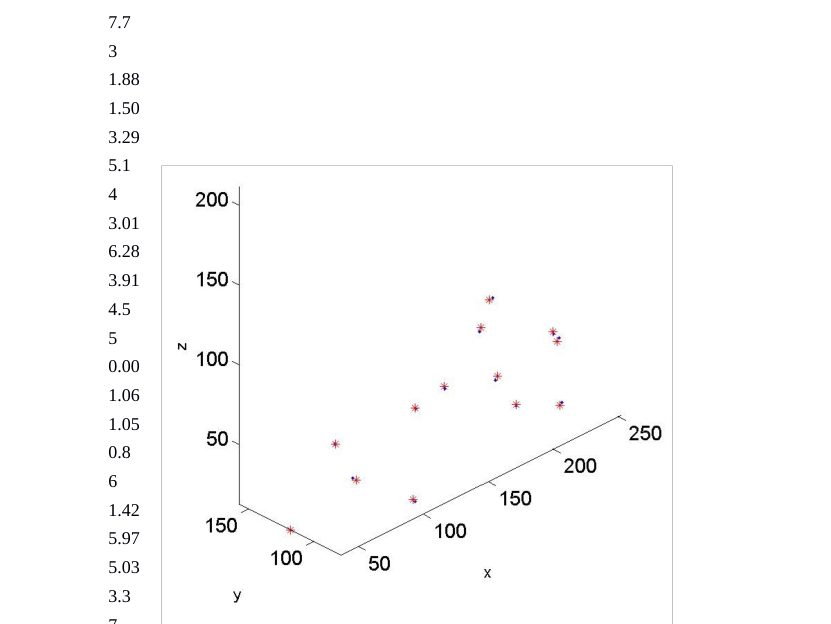
The inner structures of the foot changes were identified through the landmark changes in each high heel position. Table 1 shows the distance between landmarks at 0 heel height. In the Zero level position of foot, the highest distance of the landmarks was noted between the anterior border of the shin of tibia and tips of the second toe (250.5mm) among the 14 landmarks on the foot (Table 1). The lowest distance (42mm) was noted between the calcaneal tendon insertion point (CT) and lateral border of the calcaneus (LBC). The plot of the landmarks at different heel heights is shown in figure 8.
Table 1. Distance (mm) between landmarks at 0mm heel height Landmarks
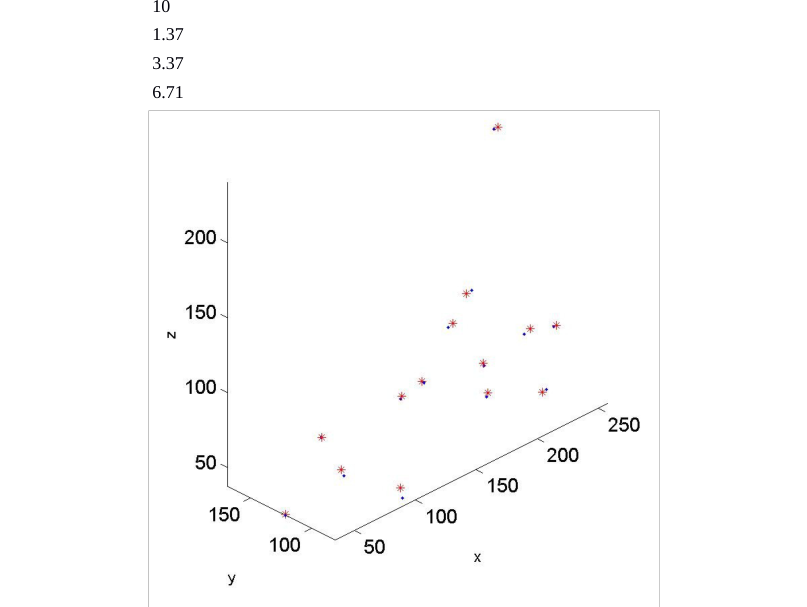
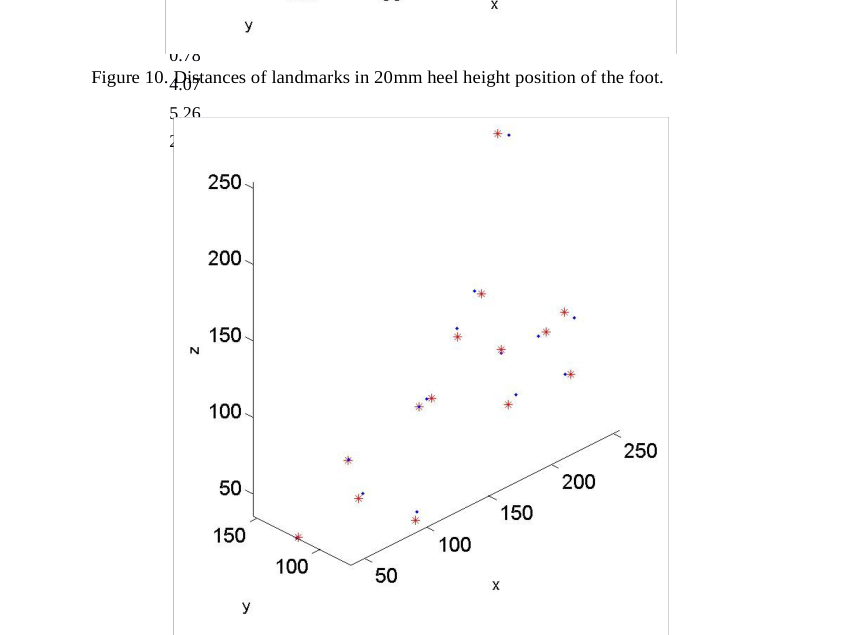
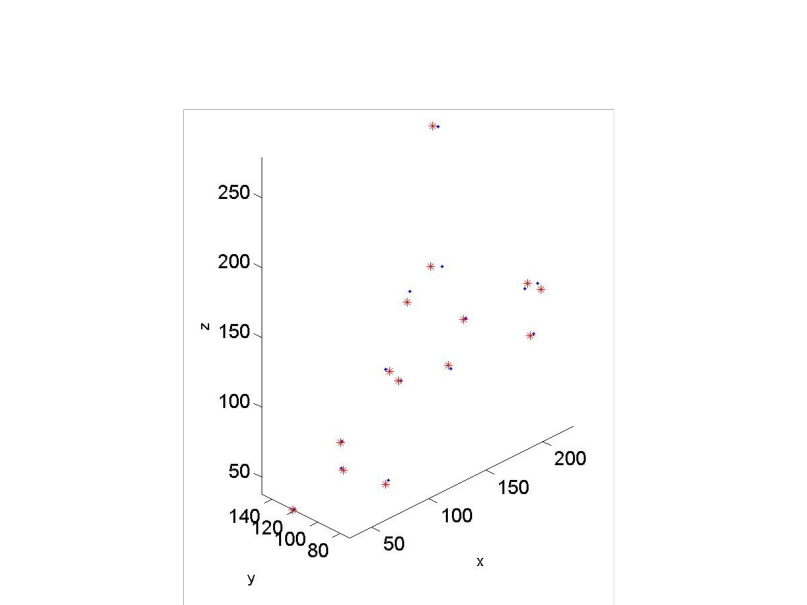
In addition the repeatability of land marking is shown Table. 2. Results show that the repeatability of the palpation and marking has a maximum of 8mm difference. According the results, the landmarks distance in 0 mm high heel height, 20 mm high heel height, 40mm high heel height and 70mm heel height land mark were plotted (Figures 9,10,11, and 12).
s International
Edited by T. Ahram, W. Karwowski and T. Marek
0mm heel hight plot
20mm heel hight plot
70mm heel hight plot
40mm heel hight plot
Figure 8. Plots at different heel heightTable 2. Repeatability of landmarking procedure Heel height (mm)
Table available in the original PDF paper.
Landmarks
0
20
40
70
1
1.97
3.35
7.11
3.6
2
2.47
4.28
4.94
7.7
3
1.88
1.50
3.29
5.1
4
3.01
6.28
3.91
4.5
5
0.00
1.06
1.05
0.8
6
1.42
5.97
5.03
3.3
7
0.81
Figure 9. Distances of landmarks in Zero level heel height.
2.46
7.31
3.3
8
2.06
4.58
5.76
3.8
2.41
4.24
4.76
3.5
10
1.37
3.37
6.71
4.6
11
2.56
4.11
6.39
8.1
12
2.87
2.47
2.34
2.0
13
0.93
2.45
0.20
2.7
14
0.78
Figure 10. Distances of landmarks in 20mm heel height position of the foot.
4.07
5.26
2.0
Figure 11. Distances of landmarks in 40mm heel height position of the foot.Figure 12. Distances of landmarks in 70mm heel height position of the foot.
DISCUSSION
Recently, there are number studies using 3D foot scanning method to get the better anthropometric foot measurement data. In our study, we used the Kinect with 3 different high heel height platforms to find out the foot shape and inner structures changes in the different position. The results showed that remarkable difference between Zero level positions with 3 different level of functional position of the foot. In the zero level position of the foot, the highest distance was noticed between the shin of tibia to the tip of the second toe. The lateral malleolus shows highest repeatability distance among the 14 anatomical landmarks, and it was 8.1mm in the 70mm heel height position. There was little distance change observed on the tip of the second toe in the 70mm heel height (0.8mm). In the 40mm high heel position, tuberosity of fifth metatarsal appeared as lowest repeatability (0.20mm) and highest repeatability was 7.31mm (Navicular tubercle). The second metatarsophalangeal joint had highest repeatability about 6.28 mm (second metatarsophalangeal joint ) among the 14 landmarks of the 20mm high heel position. In addition, the lowest repeatability was observed in the mid-dorsal point (1.06mm) and tip of the second toe (1.50mm). In the overall results of repeatability of land markings, tip of the second toe had lowest repeatability score in all high heel height. Previous literature stated that reliability of anatomical marking is essential to design the footwear. Inaccuracy of anatomical landmarking by palpating method will create problem in designing the shoes if it is greater than 10mm in small joints like foot (Bishop et al., 2011). However, some of the studies stated that the intra-rater reliability of marking on the barefoot was noticed as good results (Kadaba et al., 1989).
CONCLUSION AND RECOMMENDATIONS With the recent developments of advanced technology, there are a number of 3D scanners available in the market to scan the human foot. However, there are only few studies using Kinect scanner to design the footwear in the footwear industry. This study developed the 3D scanned functional foot in a shorter duration and with less expensive cost, and this study revealed that inner structures changes in the different functional position of the foot. Landmarking is helpful to map the inner structures to the skin surface. This study aims to better locate anatomical landmarks in an attempt to improve footwear comfort and fit.
ACKNOWLEDGMENTS
This study was supported by RGC General Research Fund (B-Q26V) and RGC General Research Fund (B- Q31C).
REFERENCES
Bishop, C., Thewlis, D., Uden, H., Ogilvie, D., Paul, G. (2011), “A radiological method to determine the accuracy of motion capture marker placement on palpable anatomical landmarks through a shoe”. Footwear Science, Volume 3. Chan, L.K. (2013), “Handbook of footwear design and manufacture”. Edited by A. Luximon, Philadelphia:
Woodhead Publishing Limited. pp.1-26. Hamill, J., Knutzen, K.M. (2003), “Biomechanical basis of human movement”. Baltimore: William & Willkins. Kadaba, M.P., Ramakrishnan, H.K., Wootten, M.E., Gainey, J., Gorton, G., Cochran, G.V. (1989), “Repeatability of kinematic, kinetic, and electromyographic data in normal adult gait”, Journal of Orthopaedic Research, Volume 7. Krauss, I., Grau, S., Mauch, M., Maiwald, C., Horstmann, T. (2008), “Sex-related differences in foot shape”,
Ergonomics, Volume 51. Luximon, A. (2013), “Handbook of footwear design and manufacture”. Philadelphia: Woodhead Publishing Limited. Razeghi, M., Batt, M.E. (2002), “Foot type classification: a critical review of current methods”. Gait Posture,
Volume 15. Rocchini, C., Cignoni, P., Montani, C., Pingi, P., Scopigno, R. (2001), “A low cost 3D scanner based on structured light”, Computer Graphics Forum. Rossi,W. A. & Tennant, R.(1984), “Professional shoe fitting”. National Shoe Retailers Association, New York. Taha, Z., Aris, M.A., Ahmad, Z., Hassan, M.H.A., Sahim, N.N. (2013), “A low cost 3D foot scanner for custom-made
sports shoes.” Applied Mechanics and Materials, Volume 440.
LISTED IN THE AHFE DIGITAL BOOKSTORE CATALOGUE
Explore the complete digital volume
Advances in Physical Ergonomics and Human Factors: Part II
Read this individual research paper free through the original publisher, or explore the full digital proceedings book.
ISBN 978-1-4951-2105-0
Explore this ISBN in the AHFE Bookstore ↗Listed in the July 2026 bookstore catalogue; search by ISBN to confirm current availability · Digital book purchase optional