Ivana Turekova, Tomas Kozik, Terezia Bagalova, Jan Neovesky (2018). Workplace Lighting as an Element Influencing the Working Process. In: Advances in Physical Ergonomics and Human Factors: Part I. AHFE Open Access, vol. 1. https://doi.org/10.54941/1006
Artificial light measurements can be carried out with the goal of verification of the lighting designed using the computer models used in designing, if the workplace is already arranged. This paper deals with the principles and gained results of the intensity of artificial lighting in an average office. Gained results are confronted with values of the computer program DIALux used in designing the lighting of work places. The results are compared with the results given by technical standards and legal regulations. The real result of the measurement is gained not only by meeting the limited values, but also by right arrangement of work tables. However, the most important thing is the work comfort of employees. Optical performance determines labor productivity with all its economic outcomes.
About 75-90% of all information are received by eyesight, therefore we must create excellent conditions for our visual work and comfort, using technical devices. By a visual comfort we mean a psycho-physiological state, where sight optimally carries out its functions and one has a feeling of not only perfect eye-sight but a mental comfort, as well. This state however, is related to spatial and color arrangement of the work place (SIEA, 2012).
Artificial light was created as a replacement for a day light in the time without day light and has developed into an independent category of lighting with specific features and functions. A feature characteristic for artificial light is its continuousness during the day and also during the year. The spectral structure of this lighting depends on the source and in spite of the construction progress, this structure differs from the one of the daylight. One of the advantages of the artificial light is the fact that we can arbitrarily light whichever part of the room with the arbitrary amount and quality of the light needed. The most important demand on the artificial light is providing good visual conditions on working level depending on the difficulty of visual work.
Visual discomfort leads to sight damage and therefore sight enervation and also disturbs the overall wellness, mood and productivity of a person (Fišerová and Hrinko, 2012), (Habel a kol., 1995). It depends on the lighting of the space, objects and a workplace. The quality of lighting is conditioned by:
- sufficient amount of solar energy
- proper space and time division
- proper color arrangements (Halonen, 1993)
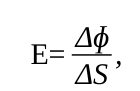
Measurement Method To evaluate the influence of artificial light on human health the photometric quantities were learned by measurements. The intensity of lighting was measured in Luxes (Lx). The luminous intensity (E) is defined as a quotient of luminous flux (Δɸ ) falling on the plane and the area (ΔS ).
Equation reproduced from the original PDF.
ΔS , (1)
Where E- Luminous intensity [lx]
Δɸ - Luminous flux [lm] ΔS – the area of fallen luminous flux [m2].
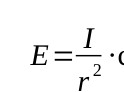
Illumination of the plane gets smaller with the distance from the light source getting longer. It is also dependent on the incidence angle. The plane on which the rays fall perpendicularly is illuminated the most. If the rays are parallel with the plane the illumination is zero. For the illumination by spot lighting photometric equation is in order:
Equation reproduced from the original PDF.
2 ∙cos α , (2) r
Where I – intensity [lm],
r - distance from the light source [m], α – incidence angle of the rays
Practically, illumination intensity is the most important photometric quantity (Novotný, 2007).
Measurement area characteristics The orientation of the measured area was north-eastern, other data are to be found in Table 1.
Table 1: The lighting set (Neoveský, 2009).
For the measurement process and light simulation we had chosen a representative office work place for 4 clerical employees. They use computing devices daily. Working with these takes up approximately 50% of their working hours.
Real quality measurement was carried out:
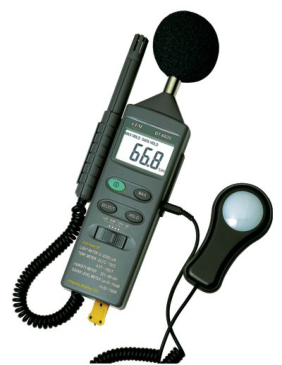
- by multimeter DT-8820 (Figure 1). The measurement was exact, as the instrument error granted by the producer is ±2 %.
Figure 1. Instrument DT-8820 used in measurements (CEM DT-8820, 2012)
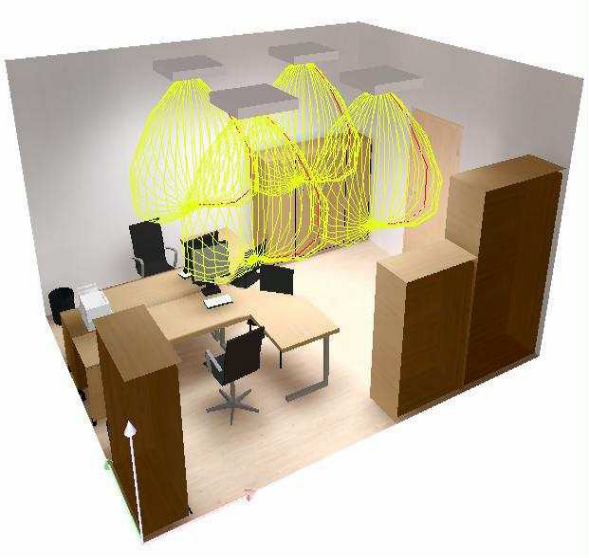
- The outcomes were compared by computer simulations by the DIALux software (Illumination designed can be seen in Figure 2) Measurement results
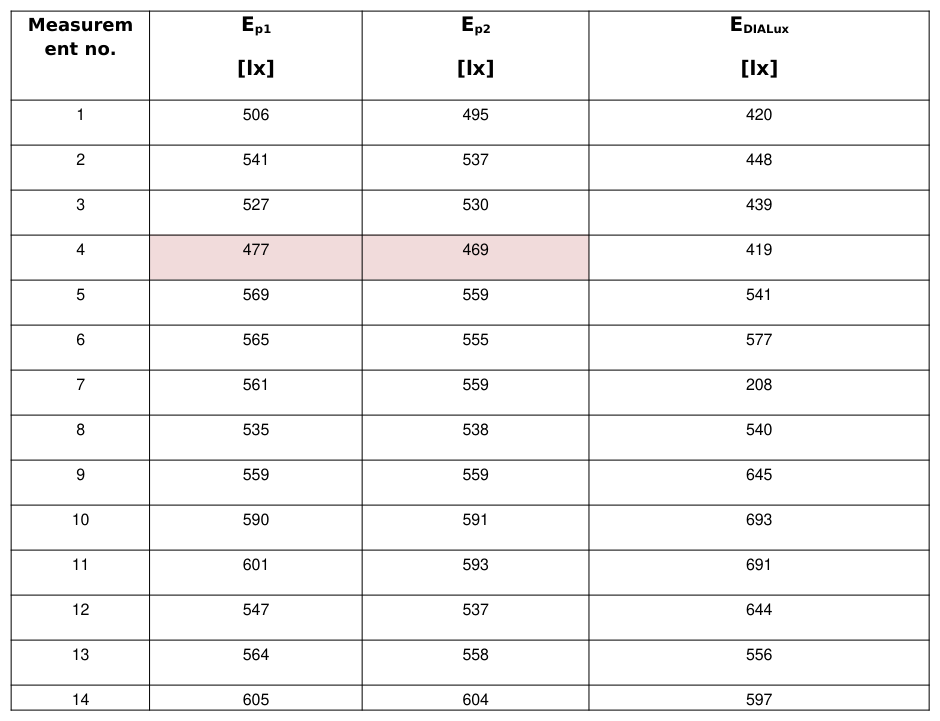
Two measurements were carried out (Table 2) in March. First at 6:23 PM and the second at 7:35 PM, as DST shift was in order. Objectification goal was to learn the present state of the workplace. Illumination was measured in the net of chosen control points. The height of the comparative plane was 0,85 m above the floor. The gaps between measurement points were 0,5 – 2 m and the distance of the edge point was 1 m from the wall (Figure 3). Other control points had been arranged equally at a density which allowed us to map the area course, illumination change and the places with the highest/lowest illumination intensity sufficiently (Škvařil, 2004), (STN EN 12464-1, 2012).
Figure 2. Outcomes from computer simulations by the DIALux software (Neoveský, 2009)Figure 3. Control point net (Neoveský, 2009)
Each control point was measured three times. In Table 3 is average of these measurements. There are aslo present the values obtained in the particular control point of computer simulation by DIAL-ux. Before starting the measurements luminous flux was stabilized. It is stable, when the measure light value after several minutes 3 times in sequence does not show systematic changes. The minimum period of stabilization of luminous flux for light bulbs and discharge powers is consider time 20 minutes (Neoveský, 2009).
Table 3: Average measured value results of artificial lighting and DIALux output (Neoveský, 2009) Measurem
The average value of lighting was determined as an arithmetic mean of all measured values of total (En) and gradatory horizontal illumination in the whole area or its part, or the combined illumination on the comparative plane (MH SR 541/2007 Z.z., 2007).
Equation reproduced from the original PDF.
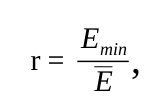
Illumination evenness at artificial lighting was determined as a ratio of minimal and average value of illumination (Rybár, 2012).
Equation reproduced from the original PDF.
E , (4)
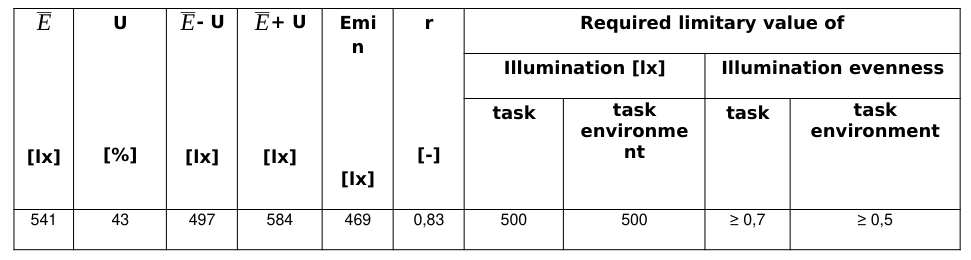
In the Table 4 we will find parameter values of artificial ligh and measurement uncertainty (U = ± 8 %) for each functional part of the operation and limitary values determined by legal framework (Rybár, 2012), (ČSN36 0011-3, 2006)
Table 4: Results of the measurements of artificial lighting and limitary values.
Discussion
Average illumination values gained by calculation were modified by the extended uncertainty interval ±U and were compared to area illumination requirements according to the type of area due to STN EN 12464-1 Light and lighting – illumination of work places.
Part 1: Internal work places As far as meeting the law regulations, the rules are as follows:
a) If the learned values including the extended uncertainty interval (±U) is above the required limits, it is considered to be a satisfactory state. b) If the value including the interval below the limits, it is considered to be an unsatisfactory state. c) If the value is above the limit and the bottom edge of extended uncertainty interval is below the limit, we cannot claim this is a satisfactory state. d) If the value is below the limit but the top edge of extended uncertainty interval is above the limit, we cannot claim this is an unsatisfactory state (STN EN 13032-3, 2009), (STN EN 12464-1, 2012).
Comparing the results and limitary values, we cannot claim that the state of the office while using artificial light is satisfactory, however the evenness of the illumination meets the limiting requirements. As far as considering particular control points coming under employee´s work responsibilities, the limitary requirements have been met. Violation of the limitary requirements in measuring have been learned in the points 4,17 and 20 (without cancelling uncertainty), where however, no visual tasks for employees took place. This fact may be documented by the output from a computer simulation with isolines (Figure 4).
Figure 4. Final illumination with isolines
Figure available in the original PDF paper.
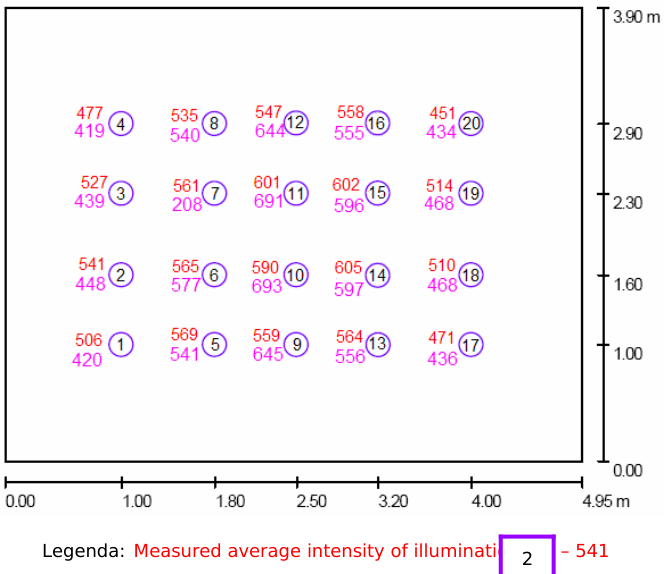
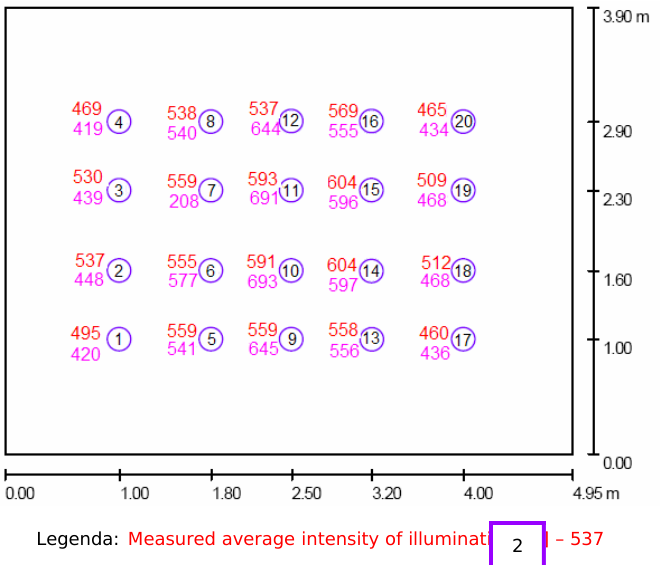
Figure 5 and 6 contain graphic explanation of the values gained by measurements and computer simulations in the net of control points for 1st and 2nd measuring.
2
Legenda: Measured average intensity of illumination [lx] – 541 scale 1 : 45 Suggested intensity of illumination by DIALux [lx] – 555
Figure 5. Comparison of the measured intensity and suggested intensity of illumination for 1st measurement.
2
Legenda: Measured average intensity of illumination [lx] – 537 scale 1 : 45 Suggested intensity of illumination by DIALux [lx] – 555
Figure 6. Comparison of the measured intensity and the suggested intensity of Illumination for the 2nd measuring.
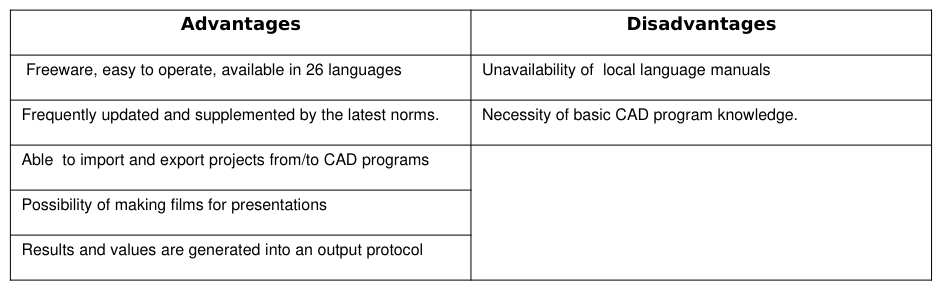
We might as well evaluate the computer software DIALux. It is mostly used with illumination design. Its advantages and disadvantages can be seen in the Table 5 below.
Table 5. Advantages and disadvantages of DIALux (DIAL GmbH, 2008) Advantages Disadvantages
Measures to be applied for improving office lighting:
Regular cleaning of the light fittings due to the maintenance plan
Providing proper lighting for visual work
Increase the input of the light fittings used
CONCLUSIONS
This paper describes the computer simulation accuracy with real measurements and compares the results to the values given by Slovak law regulations. This analysis carried out in office pointed out some deficiencies in artificial light in the work place. Regardless of these facts, we can claim that the limitary conditions of illumination for visual work have been met and additional local lighting is a sufficient solution.
Regarding the computer simulation using DIALux, it is certified that it is a proper and accurate device for illumination design.
REFERENCES
CEM DT-8820 (2012) [online]. [cit. 2012-12-01; 17:40 SEČ] Website: http://www.cem-instruments.com/en/pro/pro-536.html ČSN36 0011-3 (2006), “Měření osvětlení vnitřních prostorů”, part 3: Měření umělého osvětlení DIAL GmbH (2008), “Usermanual for DIALux v 4.6”, [online]. [cit. 2012-12-01; 17:40 SEČ] Website: http://urlm.co/www.dial.de Habel, J. a kol. (1995), “Světelná technika a osvětlování”, FCC PUBLIC, pp. 109-109. Halonen, L. (1993), “Effects of lighting and task parameters on visual acuity and performance. Thesis for the degree of Doctor of
Technology”, Helsinki University of Technology Fišerová, S. Hrinko, M. (2012), “Study of acoustic parameters of audible and visua lwarning devices used by the Police of the Czechrepublic”, Žilinská univerzita, pp. 83-88. Ministry of Health of the Slovak Republic (2007) , “Regulation n. 541/2007 Z. z. About details and requirements for lighting
during work” Neoveský, J. (2009), “Osvetlenie pracoviska ako faktor ovplyvňujúci pracovný proces”, Diploma work. STU MTF Trnava Novotný, J. (2007), “Základní pojmy zesvětelné techniky”, Světlo 2007, No. 2., pp. 70 – 71. Rybár, P. (2012), “Neistota merania osvetlenia”, Svetlo, n. 4, pp. 24. [online]. [cit. 2012-12-01; 17:40 SEČ] Website: http://www.odbornecasopisy.cz/index.php?id_document=23130 STN EN 12464-1(2012), “Light and lighting. Lighting of workplaces”, Part 1: Indoor workplaces. STN EN 13032-3 (2009), “Measurement and presentation of photo metric data of lamps and luminaires”, Part 3: Presentation of
data for emergency lighting of workplaces. Škvařil, J. (2004), “Návrh a měření osvetlení vnitřníchprostorů”, Elektrotechnický magazín, no. 3, pp. 70-73.
LISTED IN THE AHFE DIGITAL BOOKSTORE CATALOGUE
Explore the complete digital volume
Advances in Physical Ergonomics and Human Factors: Part I
Read this individual research paper free through the original publisher, or explore the full digital proceedings book.
ISBN 978-1-4951-2104-3
Explore this ISBN in the AHFE Bookstore ↗Listed in the July 2026 bookstore catalogue; search by ISBN to confirm current availability · Digital book purchase optional