Brendan Molloy, Nora Balfe, Emma Lowe (2022). Developing Bayesian Belief Networks to Support Risk-Based Decision Making in Railway Operations. In: Advances in Human Aspects of Transportation: Part III. AHFE Open Access, vol. 17. https://doi.org/10.54941/ahfe100733
Centre for Innovative Human Systems, Department of Psychology, Trinity College Dublin, Dublin 2, Ireland b Network Rail, The Quadrant: MK, Milton Keynes, UK ↗
This paper presents research conducted to model the factors influencing Railway Lookout behaviour in a Bayesian Belief Network (BBN). Railway Lookouts are responsible for monitoring the approach of trains and warning their colleagues to clear the track before the train passes. As such, it is a responsible job which requires a high degree of vigilance and lapses in vigilance can have major consequences. The work presented here has attempted to identify and model the factors affecting vigilance in a BBN in order to provide decision support for judging the risks involved in Lookout operations on a daily basis. An understanding of the lookout task was achieved through the use of interviews, workshops, an on-site observation, and a literature review including internal reports from the infrastructure manager and from these the model was developed. The paper details the factors included and their justification and presents the initial results of the BBN. The final Bayesian Network reveals that a Lookout’s efficacy within the lookout task is not sot solely determined by vigilance factors but also auditory, visual and interpersonal factors. The Network shows that Vigilance is dependent on a number of other factors, divided among internal, external, and environmental attention. The paper also discusses the implications of the Network, its potential applications, and possible avenues of further research.
In an effort to maintain the railway with the least possible disruption to scheduled rail services, railway track staff are sometimes required to work on sections of track which are not closed to rail traffic. This means that the track staff have to move off the track whenever a train approaches, a situation which is complicated by the high speeds at which trains may be travelling and the possibility of late-running or un-timetabled services. One of the methods employed to warn track staff of approaching trains is the use of ‘Lookouts’.
Railway lookouts are responsible for monitoring the approach of trains and warning track workers to clear the track before the train passes. It is a highly responsible job with a high vigilance requirement and they are prohibited from speaking to others or using any equipment that may distract them. Furthermore, there are no set maximum time limits on the task and staff may be required to act as lookout for several hours. The role is therefore susceptible to errors that may have severe consequences and there have already been a number of incidents where lookout performance has been identified as a factor. Internal research has been conducted to identify the factors affecting maintenance of vigilance in lookouts, however this kind of research has not yet been translated in to a format that can help better manage the risk. For example, following a fatality in 2009, a report was compiled into the causes behind the incident. This report recommended further research into vigilance errors, which resulted in a second report in 2011, outlining a number of factors that affected vigilance tasks. While this report helped to outline the various components involved, there exists no simplified representation of this information or how the various factors interact with one another, and no day-to-day method of managing the risk.
This research aimed to address this gap through the construction of a Bayesian Belief Network (BBN) from the factors influencing lookout performance. BBNs are typically used in probability calculations when a number of interacting variables are involved and there is a level of uncertainty in the system. As such, the development of a BBN allows a stakeholder to clearly identify the various (measurable) components of a lookout task and their relation to each other. It would also allow them to easily calculate the risk involved for a specific lookout on a given day when all factors have been taken into account. For example, visibility would affect the risk involved in lookout operations since the lookout must be able to see far enough to identify approaching trains, and this can be modelled in the network. The power of BBNs is that they can combine the factors that may change on a day-to-day basis, such as weather, levels of fatigue, experience of the individual deployed, etc. to give a single estimate of risk. Once the model has been constructed, the factors can easily be manipulated by a non-expert to calculate the risk.
This research used a variety of methods were used to identify the factors for inclusion in the BBN, including analysis of incident reports, training material, and cognitive task analyses, workshops with Lookout experts, and site visits. The BBN was constructed from the results of this data analysis and validated in a workshop. The results and the BBN will be presented, along with the planned next steps to use the BBN as a decision support tool to predict lookout performance and decide on a daily basis whether it is an appropriate protection method. If successful, the end result will be a powerful tool to support safer operations.
VIGILANCE Work that involves an individual monitoring an environment requires the ability to remain vigilant during periods of high and low levels of work activity. The success of humans to maintain such vigilance can be critical to the safety and efficiency of many systems but there are many reasons why an individual’s vigilance may vary. Vigilance is a primary factor in the performance of lookouts as they must remain alert to detect oncoming trains. This bears a striking resemblance to the task that first sparked research into the area of vigilance that is the task of a radar operator. During the Second World War, radar operators were similarly tasked with the objective of detecting a signal from the noise, this signal being enemy ships. Despite the training and obvious motivation of these radar operators, accurate detections of foreign vessels declined over the course of any given watch. In 1948, Mackworth published a paper on the breakdown of vigilance during prolonged visual search as a response to this phenomenon. He described vigilance as both a physiological and psychological readiness to react, but also as a psychological readiness to perceive and respond. While easily compared to, it was unlike, attention in that it did not need to be consciously experienced. In order to further investigate this phenomenon Mackworth developed his “clock test” to simulate the task of watching out for sporadic critical signals. Participants were asked to watch a pointer move around an unmarked clock face, which at irregular intervals would jump around at double the distance of a normal jump. Participants were asked to press a response key in reaction to each of these irregular movements. The results of these experiments showed that both the participants’ signal detection and response times would decline within the first half-hour of the task, and would continue to do so but not quite as steeply as in the first half-hour.
The understanding of vigilance has gone through a number of changes since Mackworth’s initial research in 1948. Due to the sparse occurrences of target stimuli, researchers initially believed the vigilance decrement to be caused by under-stimulation of the central nervous system, specifically the Ascending Reticular Activating System; which due to its under-activation would lead to poorer reflexes and accuracy. This later became known as the arousal model (Warm, Matthews, & Finomore, 2008). Evidence to support arousal theory can be seen in studies involving EEG and Skin conductance (Mackworth, 1968), wherein participants exhibit behavioural patterns typical of low arousal during vigilance tasks. A more recent model of under-activation to explain the vigilance decrement is the mindlessness model described by Robertson and his colleagues (Robertson et al., 1997). In this model, the repetitive and tedious tasks cause the worker to begin acting mindlessly, not paying as much attention as they would to a more engaging task, and thus acting in a more routine manner.
More recently still, research has begun to show that vigilance tasks are anything but under-stimulating and are perhaps in fact quite strenuous for the worker. Warm, Parasuraman, & Matthews (2008) believe that vigilance tasks are actually quite difficult and that the maintenance of vigilance puts attentional resources under strain. Over sustained periods of vigilance, this resource cannot be replenished in time to keep up with the attentional demand. In support of their theory, Warm, Parasuraman, & Matthews highlight that functional magnetic resonance imaging (fMRI), positron emission tomography (PET), and transcranial Doppler sonography (TCD) scans have shown an increase in bloodflow in the prefrontal cortex during vigilance tasks. In addition, TCD scans show a correlation between the vigilance decrement and blood flow seen in the corresponding regions of the brain. Aside from neuro- imaging techniques, the results of self-report questionnaires have also shown evidence indicating the strenuous nature of vigilance tasks (Finomore et al, 2013).
Vigilance has been connected with a number of influencing factors, some of which include target sensitivity, duration and predictability, each of which lend themselves to improved perceptual sensitivity and performance on vigilance tasks (Warm, Eppe, and Ferguson, 1974; Warm and Jerison, 1984). Auditory vigilance tasks have been shown to yield greater performance results in comparison to visual tasks (Warm and Jerison, 1984). And prior experience has been shown to to improve detection rates by facilitating the development of a response bias (Matthews, Davies, Westerman, and Stammers, 2000). Hitchcock, Dember, Warm, Maroney, and See (1999) also demonstrated that reliable cueing led to enhanced recognition of target stimuli. These various studies have shown that vigilance does not exist as a standalone construct and is very much vulnerable to the effects of other factors.
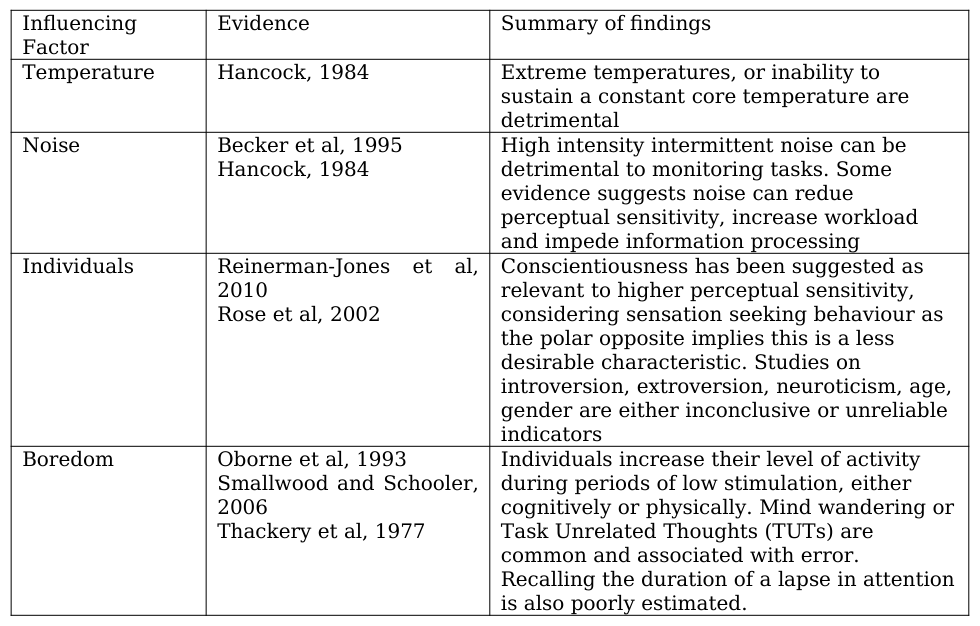
Pickup et al (2014, in press) summarizes the literature relating to vigilance associated with safety roles, with a particular focus on the railway lookout. The paper highlights particular factors known to affect vigilance either positively or negatively (Table 1)
Table 1: Factors affecting vigilance (Pickup et al, 2014) Evidence Summary of findings
The literature shows that a wide variety of factors, some inter-related, influence vigilance, particularly in real world environments. This complexity suggests BBNs as a possible method to quantify the risk involved in lookout operations as they are capable of modeling interacting variables and uncertainty.
BAYESIAN BELIEF NETWORKS As discussed in the introduction, BBNs are typically used in probability calculation when a number of interacting variables are involved and there is a level of uncertainty in the system. The development of a graphical BBN model clearly shows the interrelationships between variables, and the use of Bayes Theorem allows the probability of an event within the network to be calculated based on the condition probabilities of the components of the BBN.
The mechanics behind Bayesian networks hinge on Bayes Theorem, which is formulated as follows: P (Y|X )= P (X|Y )∙P(Y)
P( X) Where P(Y) is the prior probability of the hypothesis, i.e., the likelihood that Y will be in a certain state, prior to consideration of any other relevant information (evidence) which is X. P(X|Y) is the conditional probability (the likelihood of evidence given the hypothesis to be tested), and P(Y|X) is the posterior probability of the hypothesis (the likelihood of Y being in a certain state, conditional on the evidence provided; Akhtar & Utne, 2014). Other features of Bayesian Networks are that they are Directed Acyclic Graphs, with each node limited to only a finite number of states.
Each node within a Bayesian network is classified as either a “Parent” or “Child”, or both. These classifications relate to their respective relations to other nodes, where parents are connected to antecedent nodes, or are influenced by other nodes, and children are connected to subsequent nodes or have an influence on other nodes. Each node is also limited to a finite number of states, with a minimum of two states, usually along the lines of “True”/ “False”, or “On”/ “Off”. The number of states for a child exponentially increases as the number of states for a parent increases, in this case “True” if parent “True”, “True” if parent “False”, etc. The probability for each state of each node must be defined in probability tables.
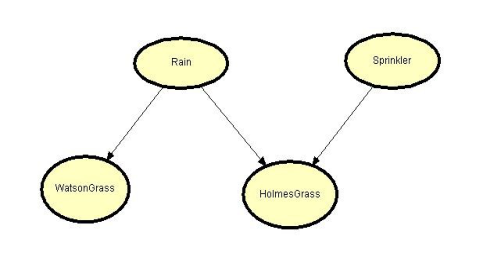
A simple example of a Bayesian Network is shown in Figures 1-2 (Jensen, 1996). In this this example we are looking to see the factors that affect the probability of Holmes’ grass being wet. Looking at the network (Figure 1), we notice that both rain and the sprinkler feed into the probability of this event as shown by the connecting arrows. Rain, unlike the sprinkler, also has an effect on Watson’s grass being wet. Now when we look at the probability tables (Figure 2), we can see that Holmes’ grass has a higher probability of being wet than Watson’s, likely due to the added effect of the sprinkler. But why don’t we check to see if this is the case?
Figure 1. BBN for Wet Grass Figure 2. BBN with probabilities The BBN can generate new probabilities when the probability for a particular node or nodes is known; for example, if it is known that the sprinkler in this example is off, the node can be set to to “Off”, and the probability of Holmes’ grass being wet becomes the same as Watson’s grass being wet, which just so happens to be the same as the probability of there being rain.
Bayesian Networks have been applied to a large range of areas, including the classification of components and subsystems of a nuclear plant based on safety performance assessment (Ha & Seong, 2004), assessing integrated fire prevention and protection systems (Gulvanessian & Hollicky, 2001), the integration of different eutrophication models for synthesis, prediction, and uncertainty analysis (Borsuk, Stow, & Rechkow, 2004), and, most relevant to this research, in mapping the effect of fatigue on maritime accidents (Akhtar & Utne, 2014). Bayesian methods have a broad range of uses and, even in the examples cited, have been applied to the area of risk analysis, as it is in the current paper. Perhaps one of its greatest strengths is that it can produce a precise number from a system that is inherently uncertain (Ferson, 2003). Another of its strengths is that the data used to populate the model can be gained using expert judgements, that is, the underlying mathematics are robust enough to compensate for, or perhaps even compliment, subjective evaluations. The model can be updated with empirical data as it becomes available to produce a more accurate prediction.
METHOD
The research was conducted in three phases:
1. Data collection to identify factors for inclusion in the model
2. Model development
3. Validation and probability population
The factors for inclusion in the model were identified initially through review of relevant literature and accident/incident reports and training documentation and subsequently through workshops, interviews and observations of lookout personnel. A thematic analysis was performed on the data collected through all these means.
The model was developed using the open-source Genie software (Genie, 2013) following the method for building BBN suggested by Fenton and Neil (2013). The individual nodes were first decided upon by consulting the gathered data, after which the relationships between nodes were built by trying to most logically establish connections between the various factors. For instance “Auditory Cue” and “Teamwork” were decided to be unrelated to each other and as such have no direct connection in the model, however, it was decided that both had a direct impact on detection rates and as such are connected to the “Detection” node. Once the nodes were connected, each was assigned a number of states. A point of concern was the need to limit a node to having no more than three parent nodes where possible. This was an effort to restrict the complexity of the probability tables. As each node has at minimum two states, these tables could easily reach a very large number of cells.
The final step was to validate the model with lookout personnel and populate the probability tables. Final interviews were undertaken in order to validate and elicit expert judgment on the finalized Bayesian Network. Unfortunately, due to time constraints, only two participants were available for this phase of the research. During the interviews, the nodes of the model were explained as well as the reasoning behind the relations between nodes. Participants were encouraged to provide feedback on the structure and factors within the model. Then, by going through the network on a node-by-node basis, participants were asked to estimate the probability of each event occurring.
RESULTS
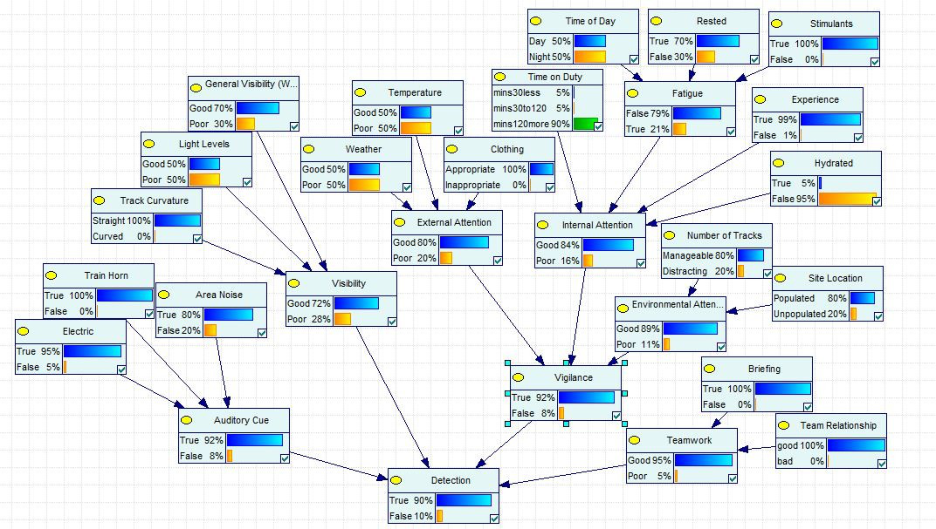
The finalized model can be seen in Figure 3. An explanation of the model’s nodes including a description and a justification for its inclusion can be found in Table 2.
Figure 5: The finalized Bayesian Network of the Lookout task
Figure available in the original PDF paper.
Figure 3. BBN for Lookout Operations
As can be seen in the model, the four main factors influencing train detection are vigilance, visibility, auditory cues, and teamwork. Each of these is further broken down in to the elements that influence those in turn. The individual factors seen in the network all feed in to the final node of detection, i.e. whether the train is detected by the lookout. This is the primary task of the lookout and the ultimate purpose of the model. After detecting the oncoming train, the lookout has to signal to their team members and retreat to a safe distance. The individual nodes contributing to detection are:
Auditory Cue – are there strong auditory cues for approaching trains? Detection of an oncoming train may be influenced by auditory signals; the lookout task is not restricted to just a visual dimension and the lookout may detect the oncoming train through auditory cues alone.
o Electric train – does the train run on electric or diesel fuel? Electric trains are quieter than diesel trains and as such are more difficult to hear approaching, influencing the likelihood of detection. o Train horn – does the approaching train blow its horn on seeing the maintenance team? Not all trains blow their horn, but doing so increases the chances of it being detected by the lookout. o Area noise – is there environmental noise such as a neighboring site or children’s school? Some environments have higher noise levels and as such may obscure relevant auditory cues or be more distracting for the lookout, increasing the difficulty of detecting an oncoming train.
Visibility – how visible is the train. This node ties together all the visibility scores detailed below into a single probability score.
o Track curvature – is the track straight or curved? Lookouts reported that straight tracks were more difficult to attend to, and were conflicted as to what point they should signal a train on a long straight piece of track as it may still be at a safe distance for quite some time. On the other hand, curved tracks offer their own challenge, as the line of sight may be restricted. o Light levels – is the track well lit? Nighttime may pose a greater difficulty for the lookout as the movement of an approaching light source may be less discernable. On the other end of the scale, excessive levels of light may lead to vision difficulties as a result of glare. o General visibility (weather) – is the general visibility affected by any environmental factors such as mist or smog? This node is closely linked to the weather node but was ultimately decided to be separated as it also takes into account other potential visibility issues such as smog or smoke.
Vigilance – is the lookout vigilant? Vigilance is central to the lookout task, as it governs how capable they are of detecting an oncoming train at a given time. This node gives a summary probability of the vigilance nodes below.
o External attention – are external factors affecting the lookout’s attention? An aggregate score of all external factors. As mentioned previously, the lookout is exposed as they work outdoors and are at the mercy of a number of external influences.
Weather – what is the state of the weather? The lookout is very exposed to the elements while on duty and weather extremes such as heavy rain, wind, or snow can have a large impact on their performance.
Temperature – what temperature is it? In agreement with the literature in the area, lookouts reported that extreme temperatures (both hot and cold) made their task more difficult.
Clothing – how suitable is the lookout’s clothing? Appropriate clothing can do much to mitigate the effects of poor weather or temperatures. o Internal attention – are internal factors affecting the lookout’s attention? Internal factors have an effect on performance just as external ones do.
Time on duty – how long has the lookout been on duty? As Mackworth (1948) showed, performance declines the longer a person performs a vigilance task.
Fatigue – how fatigued is the lookout? High levels of fatigue can lead to negative effects on performance.
Time of day – what time of day is it? Time of day can affects ones alertness if circadian rhythms are disrupted. For example, working in the middle of the day is likely to be easier than working in the middle of the night.
Rested – how rested is the lookout? An advantageous time of day does not mean that the individual is well-rested, and may be tired for any number of reasons.
Stimulants – has the lookout taken some form of stimulant? Stimulants such as caffeine have been shown to reduce fatigue (Lorist & Tops, 2003).
Experience – how much experience does the lookout have? Lookout reported that less- experienced colleagues were more likely to make errors while on duty and were less able to manage their vigilance.
Hydrated – how hydrated is the lookout? Poor hydration has been linked to poor performance (Secher & Ritz, 2012). o Environmental attention – are environmental factors affecting the lookout’s attention? The lookout’s environment can be very distracting for any number of reasons, which can affect how well they are able to perform their duties.
Number of tracks – how many tracks run through the immediate area? At particularly busy junctions where there may be upwards of a dozen tracks, the movement of all the trains may become disorienting or distracting.
Site location – where is the lookout situated? Sites can vary from the unpopulated areas of the countryside to heavily populated urban districts that can be full of peripheral movements and distractions.
Teamwork – how well does the team work together? Lookouts discussed the possibility of confiding in teammates when they felt personal issues may affect their vigilance, allowing someone else to volunteer to act as lookout. As well as freer discourse, effective teamwork may increase morale or even lead to greater motivation to safeguard team members.
o Briefing – has the lookout been adequately briefed before their shift? Briefing can help provide information that would otherwise be unavailable to the lookout such as pertinent environmental information that they may not otherwise be aware of. o Team relationship – how long have the team members worked together as a team? Lookouts who have belonged to a team for a longer period of time are more likely to have established a relationship allowing them to disclose information to other team members, such as whether or not they believe they are up to performing as a lookout that day.
DISCUSSION
The aim of this work was to develop a model of lookout vigilance using BBN. During the development of the model, it became clear that detection rates of oncoming trains are not solely determined by vigilance alone. In fact auditory cues, visibility and teamwork all fed into the final calculation. While vigilance ranks among the most important determinants, the task does not exist in a vacuum, free of considerations around sound, visual obstruction, or interpersonal elements. The fact remains that the lookout works in a real-world environment where there are distractions as well as extra cues, a context for motivation or boredom. It is important that these factors are also included in the model in order to more accurately calculate the probability of train detection under a specific or general set of circumstances.
With 28 nodes in all, the network is a reasonably complicated model. The network reflects the complex number of factors that all have a bearing on the task. It should be noted that during the development of the model, a node was limited to having no more than three parent nodes (nodes with an arrow pointing towards another) where possible. This was an effort to restrict the complexity of the probability tables. As each node has at minimum two states, these tables could easily reach a very large number of cells. For example, the “Internal Attention” node has four parent nodes but 24 cells (“Time on Duty” has three possible states), which is equivalent to 24 potential events of occurring. For the same reason of minimizing complexity, each node was restricted to only two states where possible.
Also worthy of mention is the high probability of successful detection. This is congruent with the typical running of rail operations. If fewer trains were correctly detected then it would stand to reason that there would be an increased number of railway accidents, and the nature of the job would be all the more grave. A 90% success rate is dependent on no information being present, that is that all the prior probabilities are unset, and there is much greater room for negative effects to feed into the overall detection rate, when in fact a more typical case may be that many of the factors are of a more favourable state for detection, for example, there are already restrictions on conducting lookout operations during adverse weather or visibility.
The node for vigilance itself has 15 nodes, either a parent node, or the parent of a parent node, feeding into it. Its parent nodes, internal attention, external attention and environmental attention, reflect vigilance’s ties to attention and reveal the various faces that attention may have, from the external factors of weather and temperature, to the internal factors like fatigue or hydration. Unfortunately, this real world vigilance task is not as simple as the clock face task composed by Mackworth in 1948. The reality is that these workers have to operate in a wide number of conditions, usually exposed and subject to variety of circumstances not typically dealt with by those who work in a stable, consistent and indoor environment. With this in mind, issues like appropriate clothing and hydration become all the more essential to effective performance. These considerations aside, participants agreed with Mackworth’s findings that one’s attention tended to slip after half an hour of being on shift. Several participants in the workshops also agreed that after two hours on-shift their vigilance dropped off, and felt that it were better to report this to a superior and swap with another team member, rather than continue to act as a lookout.
The power of the BBN is its ability to incorporate known events or circumstances with the estimates of probability of the unknown. So for example, in this model, if it is known to be raining, very cold, the chosen lookout is reporting fatigue, the work is scheduled to take place in a noisy area, and it is dark the prior probabilities for each of these factors can be set to 100% in the model and the overall probability of train detection drops from 90% to 85%. Alternatively, if there has been an event in which a train was not detected, the probability of detection can be set to zero, and other known factors identified in the investigation can also be set within the model (e.g. it was dark, raining and the lookout was monitoring a high number of tracks) and the model can suggest the probability of the other factors contribution to the event.
Applications The final model has a number of potential applications for real-life settings. Perhaps chief among them is a risk- assessment tool; used in this capacity a supervisor or manager could use the tool to help decide the suitability of a particular worker to operate as a lookout that day. Due to certain nodes being specific to an individual (e.g. fatigue, hydration, etc.) it can be tailored to each potential lookout or these nodes can be kept at their base probabilities to generate a generic estimation of the risk on that day. Another potential use for the model is for training purposes, providing a clear visual of the nature of the lookout task, helping to iterate the importance of certain factors such as appropriate clothing or stimulants which may be otherwise overlooked, factors which the lookout would have control over themselves. Finally, it could be used as an investigation tool, helping an investigation team identify the factors that may have contributed to an incident or accident by inputting the known factors (i.e. setting them to 100%) and letting the model calculate the probability that the other factors, which may be more difficult to investigate directly, contributed to the event.
Limitations As previously noted, the study imposed restrictions on both the number of possible parent nodes as well as the number of node states. In the pursuit of simplicity, some sensitivity may have been lost in the process. The node for “Weather” for instance is simplified to having only the states of “Good” or “Poor”, when the truth is that weather could be explained by a much greater number of states to incorporate all the possible weather patterns, such as heavy rain, strong winds, etc. Additionally, this simplification opens up the possibility of user error, as ultimately the user may make a decision between one state or the other, when neither of which is particularly true, or perhaps does not properly capture the nature of the truth for that node. As with most models, the balance between richness of data and simplification of results is a difficult one to weigh, but there is definitely scope to explore a model that displays a fuller range of data points.
Another theme which repeatedly appeared in the data was that of personal problems. Participants noted that events like arguments with a significant other or a sick child may weigh heavily on one’s thoughts during a shift leading to lapses in attention. However, these issues are rarely disclosed due to the personal nature of the matter. Though the issue arose repeatedly, it was always done in a generalized manner, further reflecting the reluctance to admit to personal problems with co-workers, much less researchers. Without disclosing such issues, little can be done in the way of correcting for its negative consequences. Furthermore, it would present its own difficulties in extrapolating accurate data and hence was not included in the model.
Another limitation of the study was the limited sample size used to populate the model and validate these probabilities. While not representative of the entire population, the data present still illustrates the uses and potential of the model and it can be iteratively improved as more data becomes available. Even with the limited data, the model gives an indication of the risk involved in the lookout task for a particular individual for a particular depot on a particular day, just as the model would be applied in practical use.
CONCLUSIONS
The railway lookout task depends heavily upon one’s ability to sustain attention for a prolonged period of time, in other words, to remain vigilant. However by applying Bayesian theory, one can plainly see that their task is not quite so fundamentally reducible. The task is quite complex, and efficacy, as determined by successful detection of oncoming trains, is regulated by many more factors than vigilance alone. These factors range from the environmental (e.g. the number of nearby tracks) to the internal (e.g. hydration), and even factors unrelated to vigilance, such as one’s ability to work effectively as part of a team. Nonetheless vigilance does form the majority of the relationships, with 15 other factors (more than half) feeding into it. The factors relating to vigilance are those that a lookout has most control over, and as such can be influenced to improve efficacy. As a whole, the lookout task maps well using Bayesian Networks, omitting only data that is intrinsically unreliable, and mirroring the finding of previous research. This research has shown the ability of Bayesian Networks to model lookout operations and the potential for the model to improve safety on the railway.
The next steps for this research are to further validate the model and recruit a greater number of participants to populate the probability tables, resulting in a greater level of accuracy of the predicted detection rate. Bayesian networks can easily combine empirical data (when available) and expert judgement. The delivered network can therefore be updated with ‘better’ data over time as it becomes available. A reporting system could be set up for lookouts to collect better empirical data to populate the model. The visibility of the model to front-line staff may help overcome some concerns about reporting, as it will be clear how the information reported is being used to improve safety.
Railway lookouts are not always tasked with being the sole lookout for a team. It is a common practice for two or more lookouts to be designated on stretches of track that are known to be risky areas. While the current model assumes that a lookout works alone, it would be interesting to explore the commonalities and differences between this and a model that accounts for multiple lookouts. Another interesting phenomenon that repeatedly emerged in the data was that some lookouts will begin to talk, sing, or even dance with themselves during prolonged shifts. An investigation of the causes and effects of this behaviour could yield results that may help explain the mental state of a lookout over a prolonged period of time. It would be worth pursuing if it were to reveal some beneficial effects of this kind of behaviour.
Following this, the model could be used in operations as a pilot scheme to assess the risk involved in lookout operations. To facilitate use by front-line staff, the final network would need to be transferred to another, more accessible platform. Options include developing an Excel application (if possible) or using free statistics packages such as R and developing a bespoke front-end. Feedback from this deployment could be used to further improve the model. If the approach proves successful, further Bayesian networks can be developed for other protection systems. These could be linked, ultimately providing a decision support tool which helps select the ‘least risky’ protection system for a given set of circumstances.
REFERENCES
Akhtar, M. J., & Utne, I. B. (2014). Human fatigue’s effect on the risk of maritime groundings–A Bayesian Network modeling approach. Safety science, 62, 427-440. Becker,A. B.,Warm, J.S., Dember,W. N.,and Hancock, P. A. (1995). Effects of jet engine noise and performance feedback on
perceived workload in a monitoring task. International Journal of Aviation Psychology 1995, 5, 49–62. Borsuk, M. E., Stow, C. A., & Reckhow, K. H. (2004). A Bayesian network of eutrophication models for synthesis, prediction, and uncertainty analysis. Ecological Modelling, 173(2), 219-239. Fenton, N. & Neil, M. (2013). Risk assessment and decision analysis with Bayesian Networks. Boca Raton: CRC Press. Ferson, S. (2003). Bayesian methods in risk assessment. Technical report for the Waste and Storage Unit, Service Environnement
& Procédés, Bureau de Recherches Géologiques et Minières, France. Available at: www. ramas. com/bayes. pdf. Finomore, V. S., Shaw, T. H., Warm, J. S., Matthews, G., & Boles, D. B. (2013). Viewing the Workload of Vigilance Through the Lenses of the NASA-TLX and the MRQ. Human Factors: The Journal of the Human Factors and Ergonomics Society, 55(6), 1044-1063. GeNIe (version 2.0). [Computer Software]. (2013). Pittsburgh, PA: Decision Systems Laboratory (DSL), School of Information
Sciences, University of Pittsburgh. Available from http://genie.sis.pitt.edu/ Gulvanessian, H., & Holický, M. (2001). Determination of actions due to fire: recent developments in Bayesian risk assessment of structures under fire. Progress in Structural Engineering and Materials, 3(4), 346-352. Ha, J. S., & Seong, P. H. (2004). A method for risk-informed safety significance categorization using the analytic hierarchy process and bayesian belief networks. Reliability Engineering & System Safety, 83(1), 1-15. Hancock.P.A. (1984) Environmental stressors. In Warm,J.S. Sustained Attention in Human Performance. J.Wiley and Sons Ltd.
Chichester, UK. 103-142. Helton,W.S., Hollander,T.D., Warm,J.S., Mathews,G., Dember., W.N, Wallart,M, Beauchamp,G, Parasuraman,R and Hancock,P.A (2005). Signal regularity and the mindlessness model of vigilance. British Journey of Psychology, 96,249 Hitchcock, E. M., Dember,W.N.,Warm,J.S., Maroney,B.W. and See, J. (1999). Effects of Cueing and Knowledge of Results on
Workload and Boredom in Huey,B.M. and Wickens,C.D. (1993). Workload transitions: Implications for Individual and Team Performance. Washington, DC: National Academy Press. pp. 139–170. Jensen, F. V. (1996). An introduction to Bayesian networks (Vol. 210). London: UCL press. Lazarus, R. S. (1999). Stress and Emotion: A New Synthesis. New York: Springer. Lorist, M. M., & Tops, M. (2003). Caffeine, fatigue, and cognition. Brain and Cognition, 53(1), 82-94. Mackworth, N. H. (1948). The breakdown of vigilance durning prolonged visual search. Quarterly Journal of Experimental
Psychology, 1(1), 6-21. Mackworth, J. F. (1968). Vigilance, arousal, and habituation. Psychological Review, 75(4), 308. Matthews,G, Davies, D.R., Westerman,S.J, Stammers R.B (2000). Vigilance and Sustained Attention. In Human Performance: Cognition, Stress, and Individual Differences. Psychology Press, East Sussex. UK.p 107-124. Matthews,G,Campbell,S.E, Falconer,S.E, Joyner,L.A, Huggins,J,Gilliand,K, Grier,R and Warm,J.S (2002) Fundamental
dimensions of subjective state in performance settings: task engagement, distress, and worry. Emotion,2,4, 315 – 340. Oborne,D.J., Branton,R., Leal,F., Shipley,P. and Stewart.T. (1993) Person-Centred Ergonomics. Taylor and Francis, London. Pickup, L., Lowe, E., & Smith, S. (2014). Vigilance and the railway lookout. Paper presented at the Ergonomics and Human Factors conference 2014, Southampton, UK, 7-10 April 2014. Reinerman-Jones, L.E., Matthews, G., Langheim, L.K. and Warm, J.S. (2010). Selection for vigilance assignments: a review and
proposed new direction. Theoretical Issues in Ergonomics Science, June, 1-24. Robertson, I. H., T. Manly, et al. (1997). ‘Oops!’: performance correlates of everyday attentional failures in traumatic brain injured and normal subjects. Neuropsychologia 35(6): 747-758. Rose.C.L., Murphy.L.B.,Byard.L. and Nikzad.K. (2002). The role of the big five personality factors in vigilance performance and
workload. European Journal of Personality, 16, 185-200. Secher, M., & Ritz, P. (2012). Hydration and cognitive performance. The journal of nutrition, health & aging, 16(4), 325-329. Shaw.T.A., Matthews.G., Warm.J.S., Finomore.V.S., Silverman.L. and Costa.P.T. (2010). Individual differences in vigilance: personality, ability and states of stress. Journal of Research in Personality, 44, 297-308. Smallwood, J. and Schooler, J.W. (2006). The Restless Mind. Psychological Bulletin, 132, 946–958. Temple,J.G., Warm,J.S., Dember,W.N., Jones,K.S., LaGrange,C.M. and Matthews.G. (2000). The effects of signal salience and
caffeine on performance, workload, and stress in an abbreviated vigilance task. Human Factors, 42, 2.183–194. Thackary, R.I, Bailey,J.P. and Touchstone, R.M. (1977). Physiological, subjective and performance correlates of reported boredom and monotony while performing a simulated radar control task. Technical Report FAA-AM-75-8. FAA Civil Aeromedical Institute, Oklahoma, USA. p1-12. Warm, J. S., Eppe, B. D.,and Ferguson, R. P. (1974). Effects of Knowledge of Results and Signal Regularity on Vigilance
Performance. Bulletin of the Psychonomic Society, 4, 272–274. Warm, J. S., and Jerison, H. J. (1984). The Psychophysics of Vigilance. In J. S.Warm (Ed.), Sustained attention in human performance. Chichester, England: Wiley. pp. 15–60. Warm, J. S., Matthews, G., & Finomore, V. S. (2008). Workload, stress, and vigilance. In P. A. Hancock & J. L. Szalma (Eds.),
Performance under stress (pp. 115–141). Brookfield, VT: Ashgate. Warm, J. S., Parasuraman, R., & Matthews, G. (2008). Vigilance requires hard mental work and is stressful. Human Factors: The Journal of the Human Factors and Ergonomics Society, 50(3), 433-441.
LISTED IN THE AHFE DIGITAL BOOKSTORE CATALOGUE
Explore the complete digital volume
Advances in Human Aspects of Transportation: Part III
Read this individual research paper free through the original publisher, or explore the full digital proceedings book.
ISBN 978-1-4951-2099-2
Explore this ISBN in the AHFE Bookstore ↗Listed in the July 2026 bookstore catalogue; search by ISBN to confirm current availability · Digital book purchase optional