Nicolas Maille, Mick Salomone, Andrea Desantis, Kevin Le Goff, Jean-François Sciabica, Marie-Christine Bressolle, Bruno Berberian (2022). Physiological markers of vigilance variation in a supervisory task. In: Neuroergonomics and Cognitive Engineering. AHFE Open Access, vol. 42, pp. 57–64. https://doi.org/10.54941/ahfe1001819
The ability to maintain an appropriate level of vigilance over long periods of time underlies success on a range of tasks. Particularly, staying alert allows to detect infrequent signals and to allocate the right level of cognitive resources to respond to expected or unexpected events. A review of literature shows that some physiological markers can assess this variation of attention in a lot of lab studies. These findings are interesting for human factors in aeronautics as it appears as a way to characterize and quantify the observation during assessment with pilots in a cockpit simulator. The objective of this present study is to integrate a set of physiological metrics in a representative cockpit and to test their robustness in a more ecological environment with the associated constraints. This paper presents the first step of this project with a series of two lab experiments where we tested physiological markers of vigilance proposed in the literature.We first explored these markers in a psychomotor vigilance task (PVT) classically used in the study of vigilance. ECG (Heart Rate Variability or HRV), oculometrics (blink frequency, Percentage of Eye Closure or Perclos, oculomotor pattern) and EEG (alpha rhythm) were collected. The results show an increase in reaction time over time, which indicates a decrease in vigilance. They also confirm the relevance of HRV, Perclos and Alpha rhythm as a metrics of change in vigilance. In contrast, blink frequency did not appear to correlate with vigilance in our task. We then applied the relevant metrics to a second task that combined an alarm detection task and a supervisory task, the objective being to observe the robustness of the device for a task closer to the operational context. Subjective reports and changes in performance appear to reflect a decline in alertness over time. Interestingly, HRV and Perclos also seem sensitive to these changes in vigilance, but not Alpha rhythm (which could be related to the presence of noise in the signal as well as to the small number of participants). The results obtained demonstrate that the combination of ECG and eye-tracking indicators is a promising solution for the investigation of pilot vigilance in a cockpit simulator.
Vigilance or sustained attention refers to the ability of individuals to moni- tor the situation in a continuous stream and detect infrequent or occasional critical features over time. The ability to maintain an appropriate level of vigilance over long periods of time underlies success on a range of tasks. Par- ticularly, staying alert allows to detect infrequent signals and to allocate the right level of cognitive resources to respond to expected or unexpected events. In this context, valid assessment of vigilance is operationally important.
Vigilance is typically assessed using subjective, performance-based, and/or physiological measures. Subjective ratings involve sampling the participant response to the amount of vigilance used by using a questionnaire (Ross, Rus- sell, & Helton, 2014). However, self-assessment techniques when performed during the test should not be too frequent in order to limit their impact on the task. Moreover, human beings are often inefficient when assessing their own cognitive states. Performance measurement is based on the evaluation of an individual’s ability to perform the task. There is a long history of using decreased performance with time on task as a gauge of vigilance decrement (Warm, Matthews, & Finomore, 2008). Examples of performance metrics
susceptible to vigilance include reaction time, response speed to emergency events, and lapses. However, such metrics are not always easy to implement when it comes to supervisory tasks and the level of vigilance can someti- mes vary without directly impacting the level of performance in the task. In this context, there is a need for both unobtrusive and more sensitive meth- ods for assessing operator vigilance. Physiological measurement of vigilance has been proposed in this sense (Oken, Salinsky, & Elsas, 2006). Physiologi- cal measures of vigilance are devoted primarily to continuous measurement of the physical responses of the body. These changes are measured in car- diac activity, brain activity, respiratory activity, and eye activity. Interestingly, physiological metrics appear to be more sensitive (i.e., physiological measu- res may be able to detect a drop in alertness before operators can report it) than subjective and performance based metrics. These findings are interesting for human factors in aeronautics as it appears as a way to complement the self-assessment ratings and observations with physiological metrics collected during assessment with pilots in a cockpit simulator.
However, before integrating a set of physiological metrics in a representa- tive cockpit, we propose to test the robustness of a selection of physiological metrics proposed in two lab tasks: A psychomotor vigilance task (PVT) clas- sically used in the study of vigilance and a second task that combined an alarm detection task and a supervisory task. Particularly, we proposed to explore four different markers of vigilance derived from electrocardiogra- phic (heart rate variability), oculometric (blink frequency and eye closure) and electroencephalographic (alpha power) signals. The objective is to assess the robustness of the selected physiological markers selected.
EXPERIMENTAL DESIGN Participants
Seventeen participants participated in the experiment. Eight participants (4 males; M = 25 y.o. SD = 3.6) completed the first task (PVT) while nine participants (5 males; M = 23.2 y.o.; SD = 4) completed the second task (supervisory task). All participants were voluntary and naive to the study’s hypotheses.
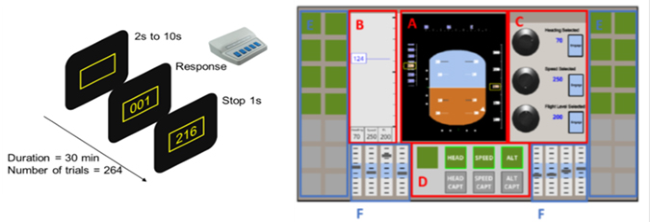
Tasks Psychomotor Vigilance task – Psychomotor vigilance task (PVT) has emerged as one of the most widely used tools to assess vigilant attention in fundamen- tal (Chua et al., 2014) and applied research (Ferguson et al., 2008; Russo et al., 2005). The PVT is a computer-based reaction-time task, pioneered by Dinges and Powell (1985). It allows the collection of a large amount of data in a relatively short period of time. These characteristics increase the sen- sitivity of the test to detect even small changes in vigilant attention. In our version of the PVT, each trial (Figure 1) started with the presentation of a yellow rectangle on a black background. Participants attended to the LED display for the duration of the test (30 min) and were instructed to press a central button as quickly as possible after the appearance of a visual stimulus
Physiological Markers of Vigilance Variation in a Supervisory Task 59
Figure 1: Procedure for a trial of the psychomotor vigilance task (left) and autopilot interface used for SAMT (right).
(a timer) presented at a variable interval of 2–10 sec. The displayed value, corresponding to the participants’ RT, remained displayed for 1s. Given the simplicity of the task, the participants performed three trials beforehand to practice.
Simplified Aircraft Monitoring Task (SAMT) – In this study, we propose a set of tasks representative of those performed in aircraft piloting. Derived from the multi-attribute task battery (MATB) classically used in aeronau- tics, we focus here on the supervisory components of the pilot task. In this sense, we designed a new task called SAMT. In this task, participants inte- racted with a tactile interface (Figure 1). They had to perform two subtasks in parallel: supervise the actions of the autopilot and detect alarms. The first subtask required to control the heading, speed, and altitude of the aircraft using the autopilot interface. For this task, displays A, B, C and D were used. Display A indicates the altitude, the speed and the course followed but also the orientation of the aircraft compared to the horizon. Display B indicates the instructions to follow. In addition to presenting the values to be follo- wed, above each parameter were scrolled the next values to be adopted and the timing to follow. Participants had to set the values to be tracked via screen C. Finally, screen D allowed the participants to know if the parameters were followed by the autopilot. The second subtask was performed via screens E and F. For the squares appearing on screen E, the participants had to press as quickly as possible on the square whose color had changed. The gauges in the F screens oscillated vertically and had to stay in the blue zone. If a gauge moved out of this boundary, participants had to press that gauge as quickly as possible as well. This detection task took priority over the supervision task. A total of 16 alarms appeared during the task. The appearance of these 16 alarms was divided into 4 separate blocks according to their appearance frequency (i.e. high or low). When the frequency was low, the block lasted 16 minutes, whereas when it was high, the block lasted 8 minutes. The task was composed of two blocks of each frequency. They appeared in alternation (low, high, low high).
Measures As mentioned above, we were interested in four different markers of vigilance derived from electrocardiographic, oculometric and electroencephalographic signals.
Electrocardiographic markers – ECG data were recorded using Biopac system. The evolution of heart rate variability (HRV), that is how much the heart rate varies, has been computed for the two tasks performed. First empirical evidence indicated that decrease in vigilance is characterized by an increase in HRV (Porges & Raskin, 1969). Nowadays, the heart rate varia- bility (HRV) is used as a robust metrics for vigilance measurement (Larue, Rakotonirainy, & Pettitt, 2011; Henelius, et al., 2014). In our study, we used a time-domain indicator called SDNN. SDNN is calculated as the standard deviation of all of the RR intervals (i.e., the distance between each heartbeat) and was computed for the 2min time windows.
Oculometrics markers – Oculometric data were recorded using the hardw- are SmartEye Pro 3.0 and the software SmartEye 6.2.4. The system included 2 infrared illuminators and 3 cameras (120 Hz) placed above the screen to avoid any direct contact with the participant. Two different metrics were collected: the PERcentage of eyelid CLOSure (or PERCLOS) and the blink frequency. PERCLOS measures the percentage of time during which the eyes are closed over a window of several minutes (usually 1 to 3 minu- tes). An eye closure is usually characterized by an 80% (sometimes 70%) closure of the eye compared to its nominal size. The correlation between PERCLOS and performance decrements in vigilance tasks has been demon- strated in a number of experiments (Wierwille, et al., 1994; Dinges, Mallis, Maislin, & Powell, 1998). Blink frequency is a well-validated indicator of visual attention; it is reduced during periods when attention is oriented tow- ard significant external stimuli, and this reduction is proportional to the required attention (Campagne, Pebayle, & Muzet, 2005; Stern, Walrath, & Goldstein, 1984). It corresponds to the number of blinks over a given time window. Note that we used the blinks identified by the Smart Eye algorithm in our study.
Electroencephalographic metrics – EEG data were recorded using acti- CHamp system. In our study, we were interested in the evolution of the alpha power. Nowadays, there is a very large literature concerning the rela- tionship of oscillatory activity and vigilance (Foxe, & Snyder, 2011; Frey, Ruhnau, & Weisz, 2015). Overall, there is increased slow frequency activity (alpha and theta bands) with decreasing vigilance. After signal preprocessing (segmentation, 2nd order Butterworth bandpass filter from 1Hz to 80 Hz and a notch for 49 to 51Hz, visual inspection and signal rejection, ICA), we performed a time-frequency analysis of the time series by applying a Mor- let transform to each segment. For the PVT data analysis, the trials were separated into 4 blocks and the 1st block was used as the baseline. For the supervision task, the rest period was chosen as the baseline. Normali- zation was performed by dividing the spectral power by that of the baseline and the measurements were then expressed in decibel via a logarithmic tran- sformation. In both cases, the alpha frequency band was between 8Hz and 14Hz. In the PVT, the analysis was restricted to the electrodes located on the occipital lobe (i.e. O1, O2 and Oz) whereas in the correlation analyses performed with the supervisory task data, all the electrodes were taken into account.
Physiological Markers of Vigilance Variation in a Supervisory Task 61
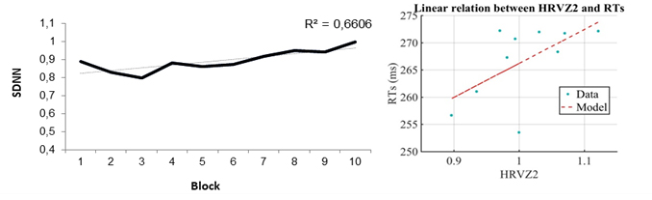
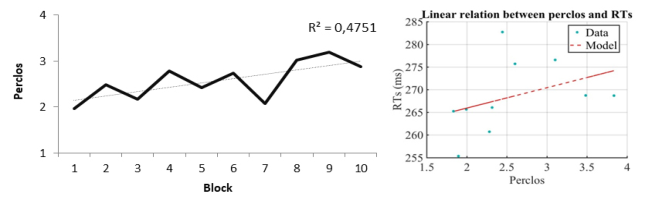
Figure 2: Time course of HRV (left) and RT/HRV relationship (right) during the psycho- motor vigilance task.Figure 3: Time course of PERCLOS (left) and RT/PERCLOS relationship (right) during the psychomotor vigilance task.
RESULTS
PVT Results As a reminder, performance metrics are typically used as vigilance markers during this PVT task, so trials characterized by low vigilance generate higher reaction times. In this context, we were interested in 1/ the evolution of our physiological markers over time, 2/ the relationship between these markers and reaction times.
Before exploring the evolution of our physiological metrics, we explored the evolution of reaction times over time to assess whether a decrease in per- formance was observed during the task. At the behavioral level, we did not observe a significant decrease in performance over time F(1,14) = 1.5, p > 0.1.
ECG - The results (Figure 2) show a linear relationship between the time on task and HRV (R2=0.6606). Furthermore, when we look at the correla- tion between this metric and RTs, we find that when we add the HRV factor to our RT explanation model, it predicts Reaction Times (RTs) better than a simple model where we only take the average of RTs (p = 0.001772).
Oculometric measure - The results (Figure 3) show a linear relationship between the time on task and PERCLOS (R2=0.4751). As observed for HRV, there also appears to be a relationship between RT and PERCLOS such that a model with PERCLOS predicts the obtained RT better than without (p = 0.005364). Contrary to the results obtained for PERCLOS, no relation- ship between blink frequency and time is observed. Furthermore, the addition of the “Blink frequency”indicator does not explain predict the RT data better than without.
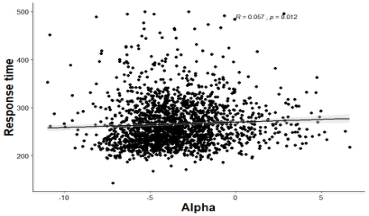
Figure 4: RT/Alpha Power relationship during the PVT.
EEG measure - In contrast to the other metrics, we do not observe a change over time in alpha activity. However, analysis of the correlation between response time and alpha activity associated with each trial demonstrates a positive correlation between alpha and RTs (r = 0.068, p = 0.0016), so that the higher the reaction time (and therefore the lower the performance), the higher the alpha (Figure 4).
The results obtained during the PVT seem to confirm the relevance of the proposed metrics (HRV, PERCLOS and Alpha Rhythm) as markers of the evolution of vigilance, contrary to the results obtained for blink frequency. In particular, these three metrics are correlated with performance in this psych- omotor vigilance task. In a second step, we were interested in the evolution of the three “responsive”metrics (i.e., HRV, PERCLOS & alpha activity) during our supervisory task (i.e., the SAMT).
SAMT Results In this second experiment, we were interested in the decrease in vigilance over time and compare different periods with low and high alarm frequency. The question was therefore whether the three successful physiological measures in our first experiment were sensitive to the phenomenon of vigilance decrement in a supervisory task.
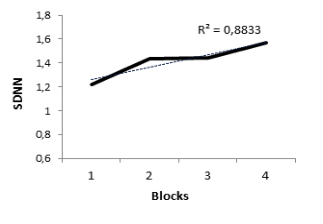
ECG - The results demonstrate an increase in HRV over time (Figure 5), as previously observed in the PVT task (R2=0.8833). As a reminder, the dif- ficulty of the detection task evolved during the 4 blocks (low, high, low, high) which explains the evolution observed (increase between block 1 and 2, then decrease between block 2 and 3, then increase “again between block 3 and 4).
Oculometric measure – A same tendency is observed for the PERCLOS (Figure 5), with an increase in PERCLOS over time (R2=0.6149).
EEG measure – Finally, we observed a marginal increase in alpha over time (−4.8 vs −4.2 Hz), F(1,8) = 4.4, p < 0.1.
The three metrics that were responsive to changes in vigilance during the PVT task are therefore found to be also responsive to changes in vigilance during our SAMT task. In addition, we also added a subjective scale (Samn- Perelli) before and after completion of the supervisory task to explore changes in fatigue levels. Participants report an increase in fatigue (Samn-Perelli) after the supervision task (4 vs. 4.8), F(1,8)= 5.8, p <.05.
Physiological Markers of Vigilance Variation in a Supervisory Task 63
Figure 5: Time course of HRV (left) and PERCLOS (right) during the supervisory task.
CONCLUSION
In this study, we proposed to assess the interest of the four physiological markers: heart rate variability, blink frequency, eye r closure and EEG alpha power. To do so, we used two different tasks: a task classically used in the study of vigilance (i.e., the psychomotor vigilance task or PVT) and a task of monitoring an automatic pilot. The first study allowed us to demonstrate that the PERCLOS, the heart rate variability and the EEG alpha power were sen- sitive to variations in vigilance. In particular, we observed that these metrics were significantly correlated with changes in reaction times, a metric classi- cally used in the PVT task as a marker of vigilance state. Interestingly, we also observed that these physiological metrics seem to be sensitive to the decrease of vigilance over time classically put forward in these vigilance tasks, where the only behavioral metrics classically used in PVT task (here, RT) would not allow to highlight a significant loss of vigilance. The relevance of these physi- ological markers to highlight decreases in vigilance over time is confirmed in the SAMT since the three metrics previously highlighted show a sensitivity to time on task consistent with the evolution of the level of fatigue reported by the participants. Thus, it appears that the sensitivity of these metrics to chan- ges in vigilance does not depend on the nature of the task. The use of SAMT also allowed us to explore this decrease in alertness in an underload context, which allows us to get closer to the ecological context. Taken together, these results confirm the relevance of physiological measures to characterize and quantify changes in vigilance levels over time. The next step will be to evalu- ate the robustness of these metrics in a representative cockpit. One limitation concerns the difficulty of relating performance to decreased vigilance in our SAMT. One prospect would be to identify performance metrics that might be relevant for use in this task.
REFERENCES
Campagne, A., Pebayle, T., & Muzet, A. (2005) Oculomotor changes due to roads incidents during a prolonged monotonous simulated driving. Biological Psychology, 68, 353–368. Chua, E.C.P., Yeo, S.C., Lee, I.T.G., Tan, L.C., Lau, P., Cai, S., ... & Gooley, J.J.
(2014). Sustained attention performance during sleep deprivation associates with instability in behavior and physiologic measures at baseline. Sleep, 37(1), 27–39.
Dinges, D.F., Mallis, M.M., Maislin, G., & Powell, I.V. (1998) Evaluation of techniques for ocular measurement of an index of fatigue and the basis for alertness management. NHTSA report DOT HS, 808, 762. Dinges, D.F., & Powell, J.W. (1985) Microcomputer analyses of performance on a
portable, simple visual RT task during sustained operations. Behavior Research Methods, 17, 652–655. Foxe, J.J., & Snyder, A.C. (2011) The role of alpha-band brain oscillations as a sensory suppression mechanism during selective attention. Frontiers in psychology, 2, 154. Ferguson, S.A., Lamond, N., Kandelaars, K., Jay, S.M., & Dawson, D. (2008). The
impact of short, irregular sleep opportunities at sea on the alertness of marine pilots working extended hours. Chronobiology international, 25(2-3), 399–411. Frey, J.N., Ruhnau, P., & Weisz, N. (2015). Not so different after all: The same oscillatory processes support different types of attention. Brain research, 1626, 183–197. Henelius, A., Sallinen, M., Huotilainen, M., Müller, K., Virkkala, J., & Puolamäki,
K. (2014) Heart rate variability for evaluating vigilant attention in partial chronic sleep restriction. Sleep, 37(7), 1257. Larue, G.S., Rakotonirainy, A., & Pettitt, A.N. (2011) Driving performance impairments due to hypovigilance on monotonous roads. Accident Analysis & Prevention, 43(6), 2037–2046. Oken, B.S., Salinsky, M.C., Elsas, S. (2006) Vigilance, alertness, or sustained atten-
tion: physiological basis and measurement. Clinical neurophysiology, 117(9), 1885–1901. Porges, S.W., Raskin, D.C. (1969) “Respiratory and heart rate components of attention.” Journal of experimental psychology 81(3), 497. Ross, H.A., Russell, P.N., Helton, W.S. (2014) Effects of breaks and goal switches on
the vigilance decrement. Experimental brain research, 232(6), 1729–1737. Russo, M.B., Kendall, A.P., Johnson, D.E., Sing, H.C., Thorne, D.R., Escolas, S.M., ... & Redmond, D.P. (2005). Visual perception, psychomotor performance, and complex motor performance during an overnight air refueling simulated flight. Aviation, space, and environmental medicine, 76(7), C92–C103. Stern, J.A., Walrath, L.C., & Goldstein, R. (1984) The endogenous eyeblink.
In P. A. Hancock & J. L. Szalma (Eds.), Performance under stress (pp. 115–141). Brookfield, VT: Ashgate. Wierwille, W.W., et al. (1994) Research on vehicle-based driver status/performance monitoring; development, validation, and refinement of algorithms for detection of driver drowsiness. final report. No. HS-808 247.
LISTED IN THE AHFE DIGITAL BOOKSTORE CATALOGUE
Explore the complete digital volume
Neuroergonomics and Cognitive Engineering
Read this individual research paper free through the original publisher, or explore the full digital proceedings book.
ISBN 978-1-958651-18-6
Explore this ISBN in the AHFE Bookstore ↗Listed in the July 2026 bookstore catalogue; search by ISBN to confirm current availability · Digital book purchase optional