Almoctar Hassoumi, Vsevolod Peysakhovich, Arthur Le Coz, Christophe Hurter, Mickael Causse (2022). Thermal Imaging of the Face: Mental Workload Detection in Flight Simulator. In: Neuroergonomics and Cognitive Engineering. AHFE Open Access, vol. 42, pp. 84–94. https://doi.org/10.54941/ahfe1001822
Thermography-based physiological measurement is an active re-search topic. Using such contact-free approach can be particularly helpful for detecting pilots’ mental state in operational settings. In particular, thermal infrared imaging of the face is a powerful and non-invasive tool that enables rapid and automatic analysis of changes in regional facial blood flow. This blood flow changes index sympathetic activity and are measured by capturing thermal imprints of particular facial regions such as nose, forehead, or around the eyes. Although several studies suggest a relationship between cognitive workload and facial thermoregulation profile, evidence about this link has not been yet sufficiently investigated and infrared imaging has yet to prove its importance in the cognitive workload detection scenarios. In this work, we investigated how thermal measures can allow continuous assessment of cognitive workload variations of pilots undergoing simulated flight tasks, and compare these measures with the heart rate, a more established marker,. The approach has been evaluated with 20 participants in flight simulator, and cognitive workload was modulated by the difficulty of two landing scenarios. Participants also performed a resting task (also called cool off). Thermal imprints did not varied significantly with landing difficulty. However, we found that the nose tip and nose area were significantly colder during the flight scenario vs the rest period (signal slope). Further analysis is needed to confirm that the thermal measures could identify more fine grained mental workload variations in a flight simulator setting.
Facial thermal imaging is a promising technique for estimating unobtrusively human physiological activity (Goulart et al., 2019). It provides remote, pas- sive, and contact-free access to the distribution of the temperature of the face, by interpreting the emitted electromagnetic radiations reflected by the surface of the skin according to the variations of blood flow in the head vessels. The thermal radiation of a cutaneous surface depends on the perfusion controlled by the autonomic nervous system, which controls the vessels that irrigate the skin (Dzedzickis et al., 2020). Using thermal cameras, researchers classically studied the effects of emotions (Dzedzickis et al., 2020; Merla, 2014) and tried to classify different affective states (Nhan & Chau, 2010) based on the
Thermal Imaging of the Face: Mental Workload Detection in Flight Simulator 85
temperature profile of the face. This technique has also been used to exa- mine fear conditioning in post-traumatic stress disorder (Di Giacinto et al., 2014). Most proposed techniques used a region-of-interest (ROI) on the face to delineate the area on which the temperature is investigated. The location of the ROI implicitly defines the type of physiological behavior to study. As an example, task-induced stress is assumed to be correlated to blood flow on the forehead frontal vessels (Puri et al., 2005).
Continuous surveillance of pilots’ mental state is highly needed in complex environments (Lee et al., 2020; Wilson, 2002), in particular with the possi- ble emergence of single-pilot operations (SPO) during which the pilot will be alone in the cockpit, without the direct assistance from a copilot. In the case of degraded situations with challenging conditions, SPO would potentially result in increased error rates (Liu et al., 2016; Vu et al., 2018). In either case, flying can increase mental stress, whether it results from the surveilla- nce of the multi-channel instruments or from dealing with the occurrence of unexpected events (Kinney & O’Hare, 2020). When difficult situations occur, particularly on relatively long periods, mental workload can exceed accepta- ble levels and compromise piloting performance and flight safety (Morris & Leung, 2006). Therefore, it is critical to be able to detect an inappropriate level of mental workload. Other instruments that detect mental workload have been widely studied. For example, the fNIRS (functional near-infrared spectroscopy) has been used to assess prefrontal oxygenation levels in airline pilots (Causse et al., 2017; Gateau et al., 2015). However, fNIRS measures can be compromised by head movements (Kikukawa et al., 2008), which can be limiting in the cockpit. More importantly, even though fNIRS is considered non-invasive, it has to be tightly attached to the subject’s head and it is relatively uncomfortable after a certain period of time. Contactless and robust ways to measure mental workload during ecological situations such as piloting is therefore needed. Compared to more established instru- ments, the advantage of thermal imaging is its remote monitoring aspect. The non-invasive recording of the thermal imprints with an easy-to-set-up device makes it an optimal solution for environments such as a flight deck where there already exist multiple instruments in the immediate vicinity of pilots. It allows reducing the stressful situation where equipment has to be placed on the subject’s head. A distant monitoring device based on thermal imaging may detect pilots’ changing mental workload, and may trigger assi- stance systems. From an experimental point of view, since no direct contact with the sensor is required, the data analysis would be less impacted by the Hawthorne effect (McCambridge et al., 2014) since the awareness of the participants being evaluated is reduced.
Research suggests that during high mental workload contexts, the blood flow increases in the forehead veins of a person. This change in blood flow, in turn, augments the local temperature of the forehead region (Abdelrahman et al., 2017). The temperature can be acquired through remote thermal imaging. Similarly, it is possible to measure the change in tempera- ture of the nose area (Cho et al., 2019) and the nose tip. While many studies use the forehead to evaluate the change in temperature, results are not always consistent. With the StressCam methodology, Puri et al. (2005) calculated the
mean temperature of the 10% hottest pixels on the forehead ROI, assuming that they correspond to the underlying frontal vessels in the forehead ROI, reportedly responsible for changes in skin temperature. Engert et al. (2014) developed a taxonomic classification and measured the temperature of seve- ral regions simultaneously to investigate the more sensitive ones for a given task. Later, researchers studied the nose (Diaz-Piedra et al., 2019) and foreh- ead (Gioia et al., 2021) regions and suggested that the nasal region provided better results.
The contribution of the current work was two-fold: 1) First, we propo- sed a novel method that automatically provides mapping models that track different face regions on thermal images, in free head movement conditions, with higher accuracy compared to the state-of-the-art approaches. Instead of studying a fixed region and constraining the user to remain with the head still during the tasks (e.g., Abdelrahman et al., 2017), we propose an approach that automatically tracks the areas of interest from the thermal imaging using a combination of deep learning and computer vision algorithms. To date, few works investigated unconstrained facial regions tracking in an ecological situ- ation. 2) Second, we evaluated the mental workload of 20 participants during different landing scenarios, based on the change in temperature in three sele- cted facial regions (Abdelrahman et al., 2017). We recorded the data with a thermal imaging camera pointed towards the pilots’ faces. We hypothesized that the mental workload elicited by our piloting scenarios and in-flight N- back task would yield changes in temperature profiles in comparison to a rest period. We also hypothesized that temperature profiles should change across low vs high piloting difficulty or low vs high in-flight N-back levels.
METHOD
Participants Twenty participants (age M = 25.05, SD = 2.78) were involved in the study. They were asked to avoid taking any substance that may have an effect on heart rate (e.g., alcohol, caffeinated drinks) at least 2 hours before the experiment. The study was approved by an international review board (N°: IRB00011835-2020-09-22-298, Université Fédérale de Toulouse, France) and performed in agreement with the Declaration of Helsinki. All parti- cipants signed an informed consent prior to their participation and were reminded that they could withdraw from the experiment at any time.
Flight Ccenario and In-Flight N-Back Task The participants performed four landing scenarios in a flight simulator (each landing lasted ≈5 min) and a rest period. The flight simulator setting allo- wed reproducing a real-world piloting task while keeping good experimental control. The experiment was divided into two experiments (they were both performed by all participants). During experiment 1, the participants were instructed to land the aircraft in two different conditions: an easy landing with clear visibility (Clear), and a more difficult landing with bad weather conditions during which the participant could not see the runway and had
Thermal Imaging of the Face: Mental Workload Detection in Flight Simulator 87
to land the aircraft with the navigation instruments (ILS). During experiment 2, the participants were asked to perform two times an easy landing (Clear), while performing a parallel auditory in-flight N-back task to simulate dense communication with air traffic controllers. The N-back task was performed across two levels of difficulty (0-back and 2-back), manipulated by modifying the value of N. The two landings, and thus their respective N-back levels, were performed randomly. 0-back: the participant was asked to press a green button on a response box when the heard number equaled 50, or to press a red one otherwise. 2-back: the participant was requested to compare the current number n with the number heard two times (n −2) before. He had to press the green button if the numbers were the same or to press the red one otherw- ise. The participants were asked to complete one practice session beforehand to make sure they familiarized with the flight simulator. After entering the flight simulator, the participants were asked to rest for three minutes to regu- late their temperature in the new environment. Participants were also given a 3-min resting time between each landing scenario to limit fatigue effects. This resting time also allowed the cardiovascular activity to return to its baseline. Moreover, after the participants finished all experimental conditions, they were instructed to rest for five minutes (cool-off phase).
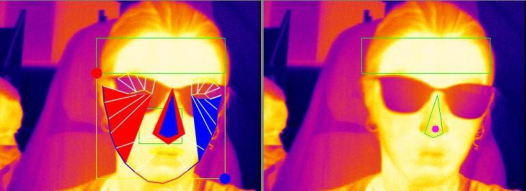
Analysis of Facial Temperature We measured together the nose tip/area regions and the forehead (situated above the supraorbital ridge) of the participants (Figure 1), which are all beli- eved to index the sympathetic nervous system activity (Panasiti et al., 2019). A wealth of studies used fixed ROI defined by the experimenter to retrieve the temperature profile. In addition to constraining the participants to keep their head still, recording data can be lost if the participant moves abruptly. As an example, Panasiti et al. (2019) removed 8 participants (≈24,24%) from their data analysis due to head movements. In this paper, a face dete- ction algorithm was used to automatically track the face of the participant. The algorithm registers the mean temperature of the polygon throughout the experiments. The algorithm is guided by the modern understanding of 2D and 3D facial alignment. Firstly, we performed skin generation to convert the raw thermal face images into a standard RGB space. This step adds features, textures, and colors to the thermal face image. Secondly, a face localization is performed on the skin-generated face to detect the face region. Finally, to retrieve the different regions-of-interest, 68 2D and 3D landmarks detection are applied. These allow retrieving the position (in pixels) of specific points on the face which helps to delineate different regions of the face.
The thermal imprints were recorded using an Optris Xi 400 infrared ther- mal camera (Optris GmbH, Germany) with an optical resolution of 382 x 288 pixels, 27 Hz, 80 mK thermal sensitivity, and the capability to collect thermal radiation in the 8–14 µm band. The instrument was black-bodied calibrated for thermometrically correct measurements. Due to additional processing of the raw data, the sampling rate was lowered to approxima- tely 15-19 frames per seconds. Each facial region gives one measurement at time t. Duplicated measurements were conserved and untracked frames were
Figure 1: A participant sitting in the cockpit during the experiment. Left: the participant’s face is segmented into different regions of interest. Right: selected face regions: fore- head (green rectangle), nose area (green polygon), and the nose tip (red dot on the nose).
excluded. Dedicated software was developed especially for the experiment. The thermal images were captured with the dedicated software running on an Intel(R) Core(TM) I7-4712HQCPU @ 2.30GHz, 4 cores, 8 processes, 16 GB RAM. In-house scripts were used to analyze the variations of the facial temperatures in the 3 selected ROIs.
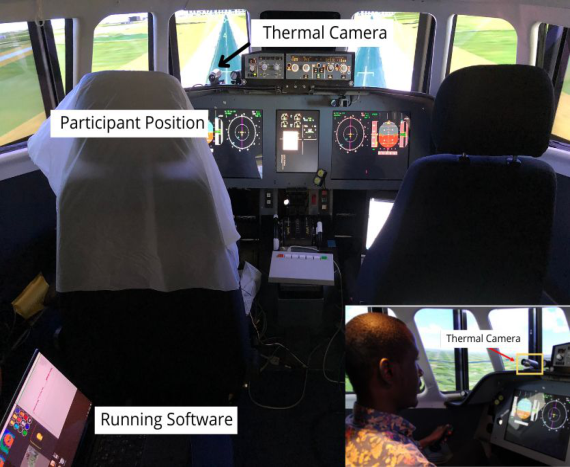
To assess the quality of the recorded data, the facial temperatures were visually inspected. In cases of excessive head rotation, the frame was skipped. We did not see any short-lasting artifacts as observed by Engert et al. (2014). To further get evidence of the proper working of the method, we checked that the ROIs thermal measures were stable during the initial recording phase. The Optris thermal camera was located at a distance of approximately 0.35 m and fixed at the forehead level of the participant. This ensures a good distance for the proper focus of the thermal camera, see Figure 2. The flight deck temperature was controlled (21°C ± 1.5).
Data Analysis Each participant completed all 4 experimental conditions plus the final cool- off phase. We collected thermal and cardiac data from the 5 phases, easy landing (Clear), difficult landing (ILS), easy landing with Inflight (i.e. in parallel to the piloting activity) 0-Back, easy landing with Inflight 2-Back, and the rest period (cool-off). We also evaluated 3 facial regions (nose area, nose tip, and forehead) for a total of 5 × 3 = 15 conditions. For each facial ROI, the thermal data was defined as the mean slope per phase. For cardiac activity, the data was defined as the mean heart rate per phase. The tem- perature of one participant was missing during the cool-off period and was interloped by the mean of the group. Only one cool-off period was performed, it was thus used for the two experiments.
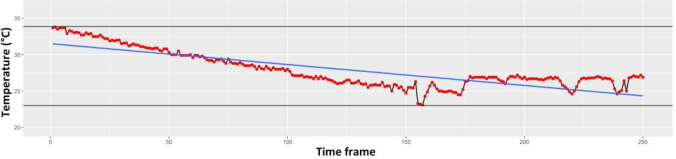
RESULTS OF EXPERIMENT 1 Facial temperature. The developed method was successful to track the tempe- rature of the three facial regions without notable loss of data, despite the free head motion conditions, see Figure 3 for the nose tip temperature tracking during the difficult landing.
Thermal Imaging of the Face: Mental Workload Detection in Flight Simulator 89
Figure 2: Illustration of the experimental setup. A participant sitting in front of the ther- mal camera mounted on the flight simulator cockpit. Thanks to the used algorithms, no chin-rest was used during the whole experiment, thus participants could move their heads freely.Figure 3: Tracking of the nose tip temperature of one participant during the difficult landing.
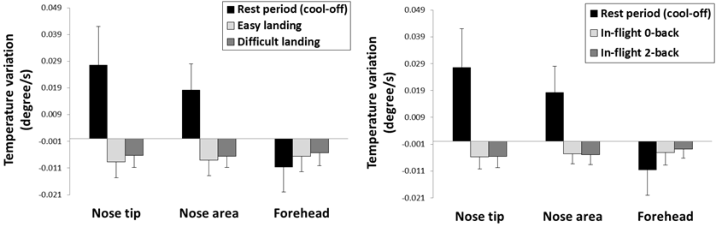
A 3 (Face area (Nose tip, Nose area, Forehead)) x 3 (Phase (Rest period, Easy landing, Difficult landing)) ANOVA revealed a significant main effect of the phase, F(2, 38) = 4.99, p = .012, = .21, with negative temperature slopes during the easy and difficult landings vs a positive slope during the rest period (LSD, both ps < .050), see Figure 4. Temperature slopes did not differ significantly between easy and difficult landing (LSD > .050). The interaction term was also significant, F(4, 76) = 2.82, p = .031, = .13, showing that the temperature slopes of the nose tip and nose area were positive during the rest period and negative during the two landing scenarios (LSD, all ps < .050). In other words, temperature in this region became colder during piloting whereas it became hotter at rest. The forehead temperature slope did not differ significantly during the two landing vs the rest period (LSD, both ps > .050), despite a visible less negative slope during both landings vs rest. During the rest period, temperature in nose area/tip increased (positive
Figure 4: Left: temperature slopes during the first (left) and second (right) experiments.
slope) whereas it decreased (negative slope) in the forehead (LSD, both ps < .001).
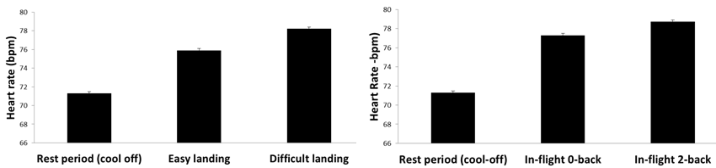
Heart rate. A one-way ANOVA revealed a significant main effect of the phase, F(2, 38) = 237.9, p < .001, = .45, with a higher heart rate during the easy and difficult landings vs the rest period (LSD, both ps < .001), see Figure 5. Heart rate was marginally higher during the difficult vs easy landing (LSD, p = .060).
RESULTS OF EXPERIMENT 2 Facial temperature. A 3 (Face area (Nose tip, Nose area, Forehead) x 3 (Phase (Rest period, in-flight 0-back, in-flight 2-back) ANOVA revealed a significant main effect of the phase, F(2, 36) = 5.00, p = .011, = .21, with negative temperature slopes during the in-flight 0-back and in-flight 2-back vs a positive slope during the rest period (LSD, both ps < .050), see Figure 4. Temperature slopes did not differ significantly between in-flight 0-back and in-flight 2-back (LSD, p > .050). The interaction term was also significant F(4, 76) = 2.69, p = .024, = .13, showing that the temperature slopes of the nose tip area/tip were positive during the rest period and negative during the two N-back levels (LSD, all ps < .050). The forehead temperature slo- pes did not differ significantly during the N-back levels vs rest (LSD, both ps > .050), despite visible less negative temperature slopes during the piloting periods (irrespective of the N-back level) vs rest. Like in experiment 1, during the rest period, temperature slopes in nose tip and nose areas were positive whereas it was negative in the forehead (LSD, both ps < .001).
Heart rate. A one-way ANOVA revealed a significant main effect of the phase, F(2, 38) = 289.2, p < .001, = .50, with a higher heart rate during in-flight 0-back and in-flight 2-back vs. rest period (LSD, both ps < .001), see Figure 5. Heart rate was not different during in-flight 0-back vs in-flight 2-back (LSD, p > .050).
DISCUSSION AND CONCLUSION The objective of this study was to experimentally evaluate the usage of infrared thermal imaging in mental workload research during ecological conditions, namely when performing landing scenarios in a realistic flight
Thermal Imaging of the Face: Mental Workload Detection in Flight Simulator 91
Figure 5: Mean heart rate during the first (left) and second (right) experiments.
simulator. We developed a novel approach combining deep learning and com- puter vision algorithms that successfully captured the temperature of specific facial regions despite free head motions conditions (participants’ head was not constrained). We focused on how facial region thermal imprints oscillate due to mental workload during two different landing scenarios varying in difficulty and two additional landing scenarios with a parallel N-back task that was used to manipulate difficulty. In the first experiment, results showed that temperatures of the nose tip and the nose area became colder during the four landing scenarios whereas it became hotter during the rest period (cool off). This is in line with previous studies (Abdelrahman et al., 2017; Engert et al., 2014) and confirms that increased mental workload decreases the flow around the nose area. The forehead followed an opposite pattern, with a temperature that became slightly colder during the rest period vs the piloting activity, but this result was not significant. Regarding the effects of the difficulty of the landing task, for the nose tip and the nose area, no signi- ficant result was found. The heart rate significantly increased during the two landing scenarios (easy and difficult) vs the rest periods, and was marginally higher during the difficult vs easy one.
In the second experiment, results were generally consistent with the first experiment, with the temperature in the nose area and nose tip that became colder during piloting vs rest, and no significant change occurred in the fore- head. The effect of the difficulty of the N-back task was not significant. Heart rate increased during the two landing scenarios (irrespective of the N-back level) vs the rest periods, but this time, it was not (marginally) higher during the difficult (in-flight 0-back) vs the easy condition (in-flight 2-back).
Taken together, our results suggest that nose area and nose tip temperature decline during a marked increase of mental workload, i.e., piloting vs rest. We were unable to detect more subtle variations due to landing difficulty or parallel N-back task difficulty. We used the slope signal of the whole condi- tions to index temperature variations. This approach is maybe not optimal as it generates a loss of data, which is not suited for the detection of rapid temperature variations. In the future, other metrics will be examined to try to better capture rapid temperature oscillations.
Several limitations may persist when using infrared thermal cameras. In real-world scenarios, because of the homeostasis, the cutaneous temperature is continuously adjusted to take into account the environmental conditions (Merla, 2014). Temperature regulation or acclimatization must be taken into account to avoid falsely confounding changes due to external adaptation.
Moreover, it is worth noting that a thermal camera is a radiometric device, i.e., it does not actually directly measure the temperature of the focused object, but rather it calculates the electromagnetic radiation emitted by the object and converts it into temperature measurements. Therefore, the camera also records the radiation from the object, plus the radiation coming from surrounding objects that bounce on the focused object’s surface. This could induce estimation error and induce bias by the attenuation of the radia- tion signals when they pass through the air. In addition, in the flight deck, the direct exposition of the pilot to the sun may locally change the tempe- rature of the pilot’s face. Solutions must be found to circumvent all these issues. Finally, one cannot exclude that physical activity may contribute to modify the temperature of the face. But this result cannot explain why the nose tip and nose area became colder during piloting vs rest, since move- ments performed during piloting should rather increase the temperature of the body.
While EEG or fNIRS has provided valuable insight in mental workload measurements (e.g., Ayaz et al., 2012; Causse et al., 2016, 2017; Parent et al., 2019), their use in operational settings is currently nearly impossible due to the long installation time, the relative inconvenience of the devices, the pain due to the pressure of the cap, or the artifacts generated by movement or flight deck instruments (especially for EEG). This paper examined another techni- cal solution, facial thermal imaging, which would represent a contactless and very convenient method for estimating operators’ mental state in the flight deck. We tackled a challenging problem, which is the automatic detection of regions of interest on the face, which allowed the participant to move their head freely during the flight. This approach allowed to precisely measure the temperature of the nose area, nose tip, and forehead regions, despite the participants’ head movements. The results of the studies showed that thermal imaging was sensitive to marked variations of mental workload. During pilo- ting, the temperatures of the nose area and nose tip decreased in comparison to a rest period. The temperature of the forehead region remains relatively sta- ble. We were unable to detect more subtle mental workload changes, between two landing scenarios difficulty, or between two levels of N-back difficulty. Heart rate was slightly more sensitive since we could dissociate the easy from the difficult landing in the first experiment.
This work confirmed the importance of choosing an appropriate facial region to index mental workload. While this study provides additional evi- dence of the benefit of thermography, an in-depth evaluation with more facial regions and different devices would extend this research. More fine-grained measures than the global temperature signal slope will be also explored in the future, which may help increase sensitivity to more rapid and subtle mental workload variations. Also, research on other mental states (e.g., stress, startle effect) will be undertaken.
ACKNOWLEDGMENT
This work has been financially supported by the Dassault Aviation Chair (CASAC).
Thermal Imaging of the Face: Mental Workload Detection in Flight Simulator 93
REFERENCES
Abdelrahman, Y., Velloso, E., Dingler, T., Schmidt, A., & Vetere, F. (2017). Cognitive heat: Exploring the usage of thermal imaging to unobtrusively estimate cognitive load. Proceedings of the ACM on Interactive, Mobile, Wearable and Ubiquitous Technologies, 1(3), 33. Ayaz, H., Shewokis, P. A., Bunce, S., Izzetoglu, K., Willems, B., & Onaral, B. (2012).
Optical brain monitoring for operator training and mental workload assessment. Neuroimage, 59(1), 36–47. Causse, M., Chua, Z., Peysakhovich, V., Del Campo, N., & Matton, N. (2017).
Mental workload and neural efficiency quantified in the prefrontal cortex using fNIRS. Scientific Reports, 7. Causse, M., Peysakhovich, V., & Fabre, E. F. (2016). High working memory load impairs language processing during a simulated piloting task: An ERP and pupillometry study. Frontiers in Human Neuroscience, 10, 240. https://doi.org/10.3389/fnhum.2016.00240 Cho, Y., Bianchi-Berthouze, N., Oliveira, M., Holloway, C., & Julier, S. (2019).
Nose Heat: Exploring Stress-induced Nasal Thermal Variability through Mobile Thermal Imaging. ArXiv Preprint ArXiv:1905.05144. Di Giacinto, A., Brunetti, M., Sepede, G., Ferretti, A., & Merla, A. (2014). Thermal signature of fear conditioning in mild post traumatic stress disorder. Neuroscience, 266, 216–223. https://doi.org/10.1016/j.neuroscience.2014.02.009 Diaz-Piedra, C., Gomez-Milan, E., & Stasi, L. L. D. (2019). Nasal skin tempe-
rature reveals changes in arousal levels due to time on task: An experimental thermal infrared imaging study. Applied Ergonomics, 81, 102870. https://doi.or g/10.1016/j.apergo.2019.06.001 Dzedzickis, A., Kaklauskas, A., & Bucinskas, V. (2020). Human Emotion Recognition: Review of Sensors and Methods. Sensors, 20(3). https://doi.org/10.3390/ s20030592 Engert, V., Merla, A., Grant, J. A., Cardone, D., Tusche, A., & Singer, T. (2014).
Exploring the Use of Thermal Infrared Imaging in Human Stress Research. PLOS ONE, 9(3), 1–11. https://doi.org/10.1371/journal.pone.0090782 Gateau, T., Durantin, G., Lancelot, F., Scannella, S., & Dehais, F. (2015). Real-time state estimation in a flight simulator using fNIRS. PloS One, 10(3), e0121279. Gioia, F., Pascali, M. A., Greco, A., Colantonio, S., & Scilingo, E. P. (2021). Discrimi-
nating Stress From Cognitive Load Using Contactless Thermal Imaging Devices. 2021 43rd Annual International Conference of the IEEE Engineering in Medicine Biology Society (EMBC), 608–611. https://doi.org/10.1109/EMBC46164.2021. 9630860 Goulart, C., Valadão, C., Delisle-Rodriguez, D., Caldeira, E., & Bastos, T. (2019).
Emotion analysis in children through facial emissivity of infrared thermal imaging. PLOS ONE, 14(3). https://doi.org/10.1371/journal.pone.0212928 Kikukawa, A., Kobayashi, A., & Miyamoto, Y. (2008). Monitoring of pre-frontal oxygen status in helicopter pilots using near-infrared spectrophotometers. Dyna- mic Medicine, 7(1), 10. Kinney, L., & O’Hare, D. (2020). Responding to an Unexpected In-Flight Event:
Physiological Arousal, Information Processing, and Performance. Human Factors, 62(5), 737–750. https://doi.org/10.1177/0018720819854830 Lee, D., Jeong, J., Kim, K., Yu, B., & Lee, S. (2020). Continuous EEG Decoding of Pilots’ Mental States Using Multiple Feature Block-Based Convolutional Neu- ral Network. IEEE Access, 8, 121929–121941. https://doi.org/10.1109/ACCESS .2020.3006907
Liu, J., Gardi, A., Ramasamy, S., Lim, Y., & Sabatini, R. (2016). Cognitive pilotaircraft interface for single-pilot operations. Knowledge-Based Systems, 112, 37– 53. McCambridge, J., Witton, J., & Elbourne, D. R. (2014). Systematic review of the
Hawthorne effect: New concepts are needed to study research participation effe- cts. Journal of Clinical Epidemiology, 67(3), 267–277. https://doi.org/10.1016/j. jclinepi.2013.08.015 Merla, A. (2014). Thermal expression of intersubjectivity offers new possibilities to human–machine and technologically mediated interactions. Frontiers in Psychology, 5. https://www.frontiersin.org/article/10.3389/fpsyg.2014.00802 Morris, C. H., & Leung, Y. K. (2006). Pilot mental workload: How well do
pilots really perform? Ergonomics, 49(15), 1581–1596. https://doi.org/10.1080/ 00140130600857987 Nhan, B., & Chau, T. (2010). Classifying Affective States Using Thermal Infrared Imaging of the Human Face. IEEE Transactions on Biomedical Engineering, 57(4), 979–987. https://doi.org/10.1109/TBME.2009.2035926 Panasiti, M. S., Ponsi, G., Monachesi, B., Lorenzini, L., Panasiti, V., &
Aglioti, S. M. (2019). Cognitive load and emotional processing in psoria- sis: A thermal imaging study. Experimental Brain Research, 237(1), 211–222. https://doi.org/10.1007/s00221-018-5416-y Parent, M., Peysakhovich, V., Mandrick, K., Tremblay, S., & Causse, M. (2019).
The diagnosticity of psychophysiological signatures: Can we disentangle men- tal workload from acute stress with ECG and fNIRS? International Journal of Psychophysiology, 146, 139–147. https://doi.org/10.1016/j.ijpsycho.2019.09.005 Puri, C., Olson, L., Pavlidis, I., Levine, J., & Starren, J. (2005). StressCam: Non- Contact Measurement of Users’ Emotional States through Thermal Imaging. CHI ‘05 Extended Abstracts on Human Factors in Computing Systems, 1725–1728. https://doi.org/10.1145/1056808.1057007 Vu, K.-P. L., Lachter, J., Battiste, V., & Strybel, T. Z. (2018). Single Pilot Ope-
rations in Domestic Commercial Aviation. Human Factors, 60(6), 755–762. https://doi.org/10.1177/0018720818791372 Wilson, G. F. (2002). An analysis of mental workload in pilots during flight using multiple psychophysiological measures. The International Journal of Aviation Psychology, 12(1), 3–18. Ziegler, L. H., & Cash, P. T. (1938). A study of the influence of emotions and affects
on the surface temperature of the human body. American Journal of Psychiatry, 95(3), 677–696. https://doi.org/10.1176/ajp.95.3.677
LISTED IN THE AHFE DIGITAL BOOKSTORE CATALOGUE
Explore the complete digital volume
Neuroergonomics and Cognitive Engineering
Read this individual research paper free through the original publisher, or explore the full digital proceedings book.
ISBN 978-1-958651-18-6
Explore this ISBN in the AHFE Bookstore ↗Listed in the July 2026 bookstore catalogue; search by ISBN to confirm current availability · Digital book purchase optional