Taichi Morioka, Yohsuke Yoshioka (2026). Effect of Pedestrian Signal Display Methods on Perceived Waiting Time. In: Advances in Human Factors of Transportation. AHFE Open Access, vol. 224, pp. 467–477. https://doi.org/10.54941/ahfe1007875
This study investigates the influence of pedestrian signal display methods and traffic environments on perceived waiting time. While remaining time displays have become common to mitigate pedestrian impatience, the detailed mechanisms by which different display methods interact with environmental factors to modulate perceived waiting time remain insufficiently understood. Using immersive virtual environment technology, we conducted controlled experiments to quantitatively clarify these effects. Participants performed a prospective time reproduction task where they encoded the red signal duration in a virtual intersection and then reproduced it. Two metrics were calculated from the reproduced durations: length (ratio of reproduced duration to actual duration) and variability (coefficient of variation). The study consisted of two main experiments: Experiment 1 analyzed the effect of four Display Methods (Standard Signal, Signal with Progress Bar, Signal with Numerical Countdown, and Signal combining both Elements) and Traffic Presence (with-Traffic vs. without-Traffic), while Experiment 2 examined the interaction between numerical countdowns and three levels of Traffic Volume (High, Medium, Low). Results indicated that the Signal with Numerical Countdown condition significantly decreased length and variability compared to other conditions by acting as an accurate external clock. In Experiment 2, a significant interaction was found where the combination of the Signal with Numerical Countdown and Medium Traffic volume maximized the shortening of perceived waiting time. This suggests a synergistic effect between the reduction of uncertainty via numerical information and attentional distraction caused by traffic. These findings provide quantitative support for treating signal display methods as effective design parameters, recommending the implementation of numerical countdowns to reduce pedestrian stress and enhance safety.
Waiting time at signalized intersections is an unavoidable part of urban mobility; however, it is a significant stress factor for pedestrians. Prolonged and uncertain waiting times can lead to psychological discomfort, which in turn may induce non-compliance behaviors, such as signal violations or risky crossings. Although traffic engineering has traditionally focused on physical efficiency and safety, recent trends in urban design, such as the concept of “walkable cities,” emphasize the quality of the pedestrian experience. Consequently, reducing the Received February 18, 2026; Revised April 5, 2026; Accepted April 25, 2026; Available online July 20, 2026
468 Morioka and Yoshioka psychological burden of waiting time has become a critical issue in improving the comfort and safety of street environments. However, the precise effect of signal display methods on human time perception, particularly the interaction between information visualization and environmental factors, remains underexplored. Therefore, a quantitative investigation of these relationships is required to inform evidence-based design practices for pedestrian spaces.
Time perception is modulated by cognitive and environmental factors. Previous research has examined the impact of waiting-time characteristics on psychological responses. Maister (1985) proposed the “First Law of Service,” stating that “uncertain waits are longer than known, finite waits.” This suggests that providing information regarding the remaining waiting time could reduce uncertainty and shorten the perceived duration. Gibbon (1977) established the Scalar Expectancy Theory, which models time perception as an internal clock mechanism comprising a pacemaker and an accumulator. In this framework, the number of accumulated pulses corresponds to the subjective duration. Crucially, the accumulation process is not constant but is influenced by attentional gates. Zakay and Block (1997) proposed the Attentional Gate Model, which posits that time perception is determined by the allocation of attentional resources; when attention is diverted from the passage of time to external non-temporal stimuli, fewer pulses accumulate, resulting in a shorter perceived duration. These findings suggest that time perception is a complex phenomenon modulated by the interplay between information availability and environmental distractions.
Previous traffic psychology studies have demonstrated that countdown signals can positively influence both driver and pedestrian behavior. For instance, Limanond et al. (2009) showed that countdown timers improve intersection efficiency and influence driver compliance, while Keegan et al. (2003) reported that such displays significantly reduce the rate of signal violations among pedestrians. Similarly, other studies have indicated that explicit timing information enhances waiting tolerance (Ohashi et al., 2004; Yokoseki et al., 2011). However, these studies have predominantly focused on behavioral outcomes or subjective satisfaction through questionnaires, leaving the internal cognitive mechanisms—specifically how the subjective passage of time is altered—largely unclarified. Furthermore, although some studies have pointed out the ambiguity of analog displays such as progress bars (Fujita et al., 2003), comprehensive evaluations comparing different visualization methods (numerical vs. analog) are limited.
Moreover, interactions with surrounding traffic environments are often overlooked. In real-world intersections, pedestrians are exposed to not only signals but also dynamic traffic flows. According to attentional allocation theory, traffic should act as a distractor, potentially shortening the perceived time. However, the combined effects of the signal display methods (information transparency) and traffic volume (environmental distractions) on time perception remain unclear. To address this knowledge gap, this study aimed to investigate the effects of signal display methods and traffic environments on perceived waiting time. We hypothesized that numerical countdowns would reduce uncertainty, thereby shortening perceived time, and that this effect would be modulated by traffic volume.
Effect of Pedestrian Signal Display Methods on Perceived Waiting Time 469 In this study, pedestrian signal environments with different display methods and traffic conditions were presented in an immersive virtual environment using head-mounted display technology. Virtual Reality (VR) allows for the precise manipulation of traffic volume and signal timing, which are difficult to control in field studies, while ensuring participant safety (Schwebel et al., 2008). Under each condition, we measured the subjective waiting time using a prospective time reproduction task. This study provides valuable insights into the planning and design of pedestrian signal systems, contributing to the evidence-based optimization of street environments. Furthermore, the findings of this study are expected to provide guidelines for designing perceptually optimized intersections that balance psychological comfort and safety.
EXPERIMENT 1
Method
Experiment 1 investigated the influence of signal display methods and traffic presence on the perceived waiting time. The participants (11 university students) wore a head-mounted display (HTC VIVE Focus Vision, HTC) to experience a virtual environment developed using Vizard 8.0 (WorldViz). The vehicle models were adjusted using Blender (Blender Foundation). The system was powered by a laptop (Intel Core i7, NVIDIA RTX 3050) via wireless streaming. The procedure employed a prospective time reproduction task to measure the subjective duration. In the “Experience Phase,” participants stood and observed a red signal for a specific duration. After the signal turned green, the scene transitioned to the “Reproduction Phase” in a neutral space. Subsequently, the participants reproduced the duration by pressing the trigger on a controller (VIVE Focus Controller) when they felt that the same amount of time had elapsed.
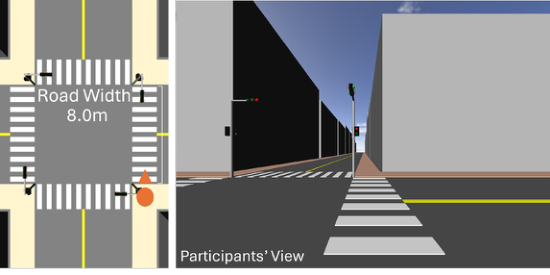
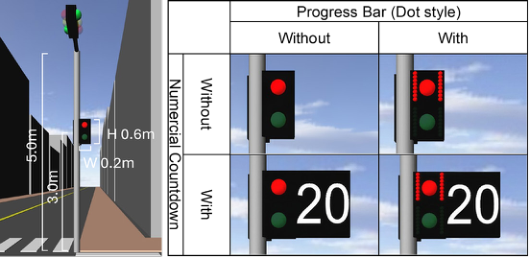
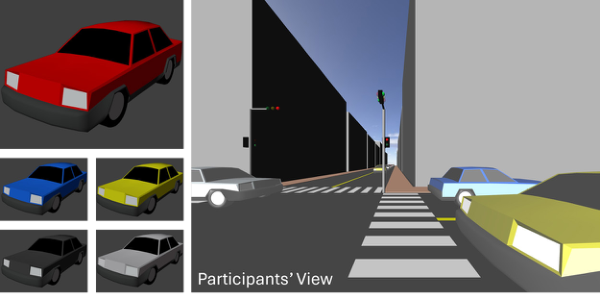
Conditions The virtual environment reproduced a standard urban four-way intersection (Figure 1). To ensure spatial realism, the road was designed with a total width of 8.0 m, accompanied by 2.0 m wide sidewalks, and building 3D models were randomly arranged outside the sidewalks. The experimental design employed a within-subject factorial design with three independent variables. The first variable was Display Method, which consisted of four distinct levels: a “Standard Signal” serving as the baseline; a “Signal with Progress Bar” featuring eight light indicators that extinguished sequentially; a “Signal with Numerical Countdown” displaying the remaining seconds explicitly; and a “Signal combining both Elements” (Figure 2). The second variable was Traffic Presence, comprising two levels: “without-Traffic” and “with-Traffic” (Figure 3). In the “with-Traffic” condition, five types of 3D vehicle models passed through the intersection synchronously with the signal phase at random intervals (10 m to 20 m) to simulate a realistic traffic flow without providing rhythmic temporal cues. The third variable was the Red Signal Duration, which was set to two distinct intervals of 20 and 30 s.
470 Morioka and Yoshioka Regarding the reproduction phase, the participants were transferred to a separate, neutral virtual space containing only a standard signal. This ensured that the reproduction task was performed without any visual cues from the specific experimental conditions influencing participants’ time estimation.
Figure 1: Top view of the experimental space and the participant’s viewpoint.Figure 2: Detailed dimensions of the traffic signal and the four display method conditions.Figure 3: 3D vehicle models and the participant’s viewpoint during the traffic condition.
Effect of Pedestrian Signal Display Methods on Perceived Waiting Time 471 Data Analysis
As described in the experimental design section, this study involved two different red signal durations (20 and 30 s). Consequently, directly comparing the raw reproduced durations (in seconds) across conditions lacks statistical validity because of inherent differences in physical timescales. To normalize the effect of physical duration and allow for a multifaceted evaluation of time perception characteristics, we adopted two standard metrics commonly used in time perception research: the Time Reproduction Ratio and Coefficient of Variation (CV).
Time Reproduction Ratio (Length): The Time Reproduction Ratio serves as an index to evaluate the subjective duration perceived by participants. It is calculated by dividing the reproduced duration by the actual experience duration. A value >1.0 indicates overestimation (perceiving time as longer than physical time), whereas a value <1.0 indicates underestimation. In waiting situations, a longer subjective duration is generally associated with increased psychological distress. Therefore, a smaller value indicates higher comfort. This metric effectively quantifies the psychological evaluation of waiting time, explicitly determining whether specific display methods successfully shorten the subjective wait.
CV (Variability): The CV evaluates inter-subject variability or individual differences in time perception. It is calculated as follows: CV = Standard Deviation of Reproduced Duration/Mean Reproduced Duration According to the Scalar Property (Weber’s law) in psychophysics. The variability of time estimation (standard deviation) tends to increase in proportion to the duration being estimated (Gibbon, 1977). Therefore, simply comparing the standard deviations between the 20 and 30 s conditions is inappropriate. By normalizing the variability using the CV, we can compare the heterogeneity of perception across conditions, regardless of the physical duration. This metric allows us to verify whether countdown displays act as a common temporal anchor to reduce individual differences or, conversely, whether environmental factors, such as traffic, distract attention and increase divergence among participants.
RESULTS
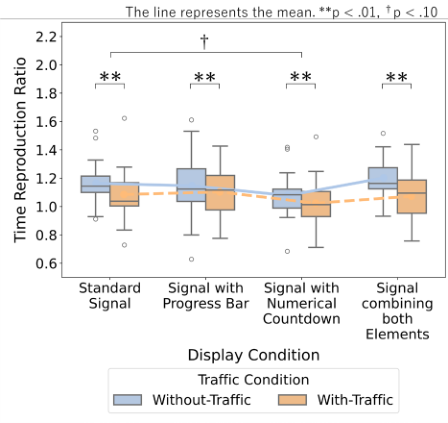
Figure 4 shows the results of the Time Reproduction Ratio (Length). A three-way ANOVA revealed a significant main effect of the Display Method [F(3,30) = 3.30, p = .034]. Multiple comparisons indicated that the “Signal with Numerical Countdown” (M = 1.03) showed a trend toward reduced Length compared to the “Standard Signal” (M = 1.13, p = .076). In contrast, the “Signal with Progress Bar” and “Signal combining both Elements” showed no significant improvement compared to the Standard Signal. A significant main effect was also found for Traffic Presence [F(1,10) = 19.51, p = .001]. The “with-Traffic” condition (M = 1.03) significantly reduced Length compared to the “without-Traffic” condition (M = 1.17, p = .001). Regarding the CV (Variability), significant main effects were found for both the Display Method [F(3,8) = 4.12, p = .048] and Traffic Presence [F(1,8) = 5.45, p = .048]. The “Signal with Numerical Countdown” significantly reduced
472 Morioka and Yoshioka variability compared to the “Signal with Progress Bar,” and the presence of traffic significantly improved consistency compared to the absence of traffic. No significant main effect was found for the Red Signal Duration, and no significant interactions were observed across all metrics.
Figure 4: Box plots illustrating the distribution of the Time Reproduction Ratio (Length) as a function of Display Method and Traffic Presence, with superimposed lines indicating the mean values. The plots depict the distribution range and average subjective duration for each condition, providing a visual representation of the significant reduction in perceived time observed in the “Signal with Numerical Countdown” and “with-Traffic” conditions.
DISCUSSION
The results of Experiment 1 demonstrated that the display method significantly influenced time perception. Specifically, the “Signal with Numerical Countdown” condition tended to reduce the perceived duration compared to the standard signal, whereas the “Signal with Progress Bar” did not show such an effect. This finding aligns with Maister’s (1985) proposition that “uncertain waits are longer than known, finite waits.” Numerical countdowns provide explicit temporal information and function as “external clocks” that allow pedestrians to calibrate their internal timekeeping. In contrast, the progress bar relies on analog estimation. Although this indicates the passage of time, the lack of precise numerical values leaves ambiguity regarding the remaining duration, which may explain why it failed to significantly reduce the subjective feeling of waiting.
Furthermore, the significant main effect of traffic presence suggests that environmental factors play a crucial role in time perception. The presence of moving vehicles significantly shortened the perceived waiting time compared with the condition without traffic. This can be explained by the Attentional
Effect of Pedestrian Signal Display Methods on Perceived Waiting Time 473 Gate Model (Zakay & Block, 1997), which posits that when attention is diverted to non-temporal information (in this case, dynamic traffic flow), fewer pulses accumulate in the cognitive counter (Gibbon, 1977), resulting in a shorter subjective duration. Under the binary manipulation of traffic presence (with vs. without), the effects of the display method and traffic appeared to operate independently as no significant interaction was observed. This suggests that the “reduction of uncertainty” by countdowns and the “attentional distraction” by traffic function as separate mechanisms within this specific context. However, it remains unclear whether these two mechanisms operate independently when traffic volume is varied, potentially altering both processing load and attentional allocation. This open question served as the basis for Experiment 2.
EXPERIMENT 2
Method
Experiment 2 investigated the interaction between numerical countdown displays and varying traffic volumes on the perceived waiting time. The methodology followed the same approach as in Experiment 1 using the same equipment and tasks. This study included 10 university students as participants.
Conditions Five vehicle models passed through a two-lane road at random intervals to prevent rhythmic temporal cues. The experiment included two independent variables: the Display Method (two levels: Standard Signal and Signal with Numerical Countdown) and Traffic Volume (three levels: High, Medium, and Low). Specifically, the High condition involved 4–5 passing vehicles per lane during the wait, the medium condition involved three vehicles, and the low condition involved 1–2 vehicles. The Red Signal Duration was fixed at 20 s. Dependent variables were derived from the reproduced duration: “Length” (ratio of reproduced to actual duration) and “Variability” (CV). As in Experiment 1, Length indicated subjective duration, whereas Variability indicated consistency.
RESULTS
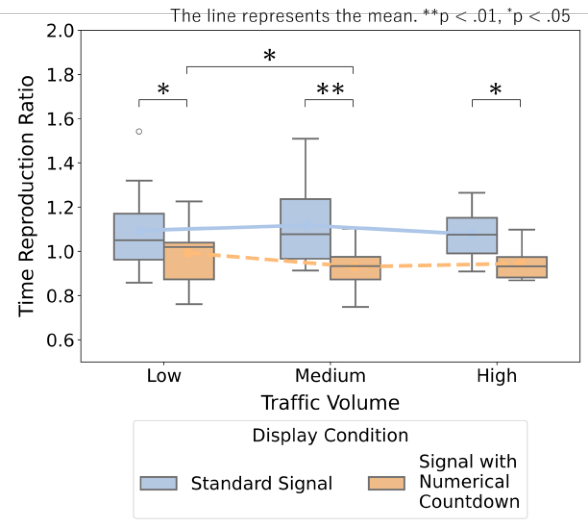
Figure 5 presents the results for the Time Reproduction Ratio (length). A two-way ANOVA revealed a significant main effect of Display Method [F(1,9) = 24.15, p = .001]. The “Signal with Numerical Countdown” significantly reduced Length compared to the “Standard Signal.” The main effect of Traffic Volume showed a trend toward significance [F(2,18) = 3.28, p = .061]. Crucially, a significant interaction was found between the Display Method and Traffic Volume [F(2,18) = 3.85, p = .041]. Simple main effect analysis (Bonferroni) indicated that the “Signal with Numerical Countdown” significantly reduced Length compared to the “Standard Signal” across all
474 Morioka and Yoshioka traffic volumes (Low: p = .043, Medium: p = .003, and High: p = .029). Furthermore, under the “Signal with Numerical Countdown” condition, the “Medium” traffic volume (M = 0.93) resulted in a significantly lower Length than the “Low” condition (M = 0.99, p = .022). In contrast, no significant differences due to traffic volume were found under the “Standard Signal” condition (p > .10). Regarding the CV (Variability), a significant main effect was found only for the Display Method [F(1,9) = 12.65, p = .006]. The “Signal with Numerical Countdown” significantly reduced variability compared to the “Standard Signal,” indicating improved perceptual consistency. No significant main effect of Traffic Volume or interaction was observed on variability.
Figure 5: Box plots illustrating the distribution of the Time Reproduction Ratio (Length) as a function of Display Method and Traffic Volume, with superimposed lines indicating the mean values. The plots depict the interaction between numerical information and environmental distraction, highlighting that the combination of the “Signal with Numerical Countdown” and “Medium” traffic volume resulted in the shortest perceived waiting time.
DISCUSSION
The results of Experiment 2 further clarified the interaction between the display methods and traffic volume. Consistent with Experiment 1, the “Signal with Numerical Countdown” significantly reduced the perceived waiting time compared to the standard signal. This reinforces the validity of Maister’s (1985) theory, demonstrating that explicit numerical information
Effect of Pedestrian Signal Display Methods on Perceived Waiting Time 475 serves as a robust “external clock” that minimizes temporal uncertainty, regardless of environmental variations.
Crucially, Experiment 2 revealed a significant interaction between the display method and traffic volume, a nuance not observed in the binary conditions of Experiment 1. While the countdown display effectively shortened perceived time across all traffic volumes, this effect was maximized under the “Medium” traffic condition. This finding suggests an optimal level of environmental distraction. According to the Attentional Gate Model (Zakay & Block, 1997), a moderate amount of non-temporal information (Medium traffic) likely diverts sufficient attention away from time processing (Brown, 1997).
In contrast, the “High” and “Low” traffic conditions did not achieve the same magnitude of time reduction. In the “Low” traffic condition, the environmental distraction was likely insufficient to divert significant attention away from the passage of time. Conversely, in the “High” traffic condition, although distraction was high, the sheer volume of vehicles may have introduced excessive cognitive load or stress. This heightened arousal could have paradoxically increased the pulse rate of the internal clock (Gibbon, 1977), thereby negating the time-shortening benefits of distraction. Therefore, “Medium” traffic appears to represent a “sweet spot” where attention is diverted without triggering stress-induced time dilation.
Interestingly, in the “Standard Signal” condition, traffic volume did not significantly affect time perception. This implies that without the “anchor” of numerical information, the uncertainty of the wait remains the dominant psychological factor. In the absence of a countdown, pedestrians are likely to allocate most of their attentional resources to monitoring the signal for a change in state, overshadowing the potential distracting effects of traffic. The anxiety associated with an uncertain wait seems to render subtle variations in the environmental traffic volume negligible.
In summary, these findings suggest that the reduction in perceived waiting time is not governed by a single mechanism, but by the interplay of two: the reduction of uncertainty provided by the countdown and the attentional distraction provided by the environment. The countdown acts as a prerequisite foundation, alleviating the primary stress of uncertainty. Once this foundation is established, environmental factors, such as traffic flow, can further modulate time perception, with moderate traffic providing the most effective distraction. Consequently, the combination of explicit temporal cues and moderate environmental stimuli appears to be the most effective strategy for reducing the perceived waiting time.
CONCLUSION
This study examined the influence of signal display methods and traffic volume on the perception of waiting times at intersections. The results demonstrate that both the presence of numerical information and surrounding traffic environment significantly affect time perception. Specifically, the “Signal with Numerical Countdown” consistently shortened the subjective duration
476 Morioka and Yoshioka compared to standard signals, confirming its effectiveness in reducing temporal uncertainty. Furthermore, Experiment 2 revealed a significant interaction where the combination of countdown displays and moderate traffic volume (Medium traffic) maximized the reduction in perceived waiting time. This suggests that although explicit information acts as a primary anchor for time estimation, environmental distractors, such as traffic flow, can further modulate this effect when uncertainty is already mitigated.
These findings have practical implications for traffic engineering and urban design, particularly for the creation of “walkable cities” in which pedestrian comfort is prioritized. Traffic planners should consider implementing numerical countdown signals not only at major intersections but also in areas where the perceived waiting time is a critical factor for compliance and satisfaction. Moreover, the results suggest that environmental design, such as maintaining a visible but moderate traffic flow or introducing other dynamic visual elements, can work synergistically with signal displays to alleviate the psychological burden of waiting. By strategically combining information transparency with environmental distractions, it may be possible to enhance the pedestrian experience without altering actual signal cycles.
Future research should investigate the mechanisms underlying the influence of different types of environmental distraction on time perception. Although this study focused on vehicle traffic, other factors, such as pedestrian crowding, noise levels, and streetscape aesthetics, could also significantly modulate perceived waiting duration by altering attentional allocation. Additionally, exploring the effects of these variables across diverse populations, including older pedestrians and those with visual impairments, would enhance the robustness and applicability of this study. Such investigations will contribute to the development of evidence-based design strategies that optimize both safety and psychological comfort in urban environments.
REFERENCES
Brown, S. W. (1997). “Attentional resources in timing: Interference effects in concurrent temporal and nontemporal working memory tasks”, Perception & Psychophysics, Volume 59, No. 7. pp. 1118–1140. Fujita, M., & Kawabata, S. (2020). “Analysis of Microscopic Characteristics of
Vehicle Start-up at Countdown Signalized Intersections and Evaluation of Signal Design”, Journal of Japan Society of Civil Engineers, Ser. D3 (Infrastructure Planning and Management), Volume 76, No. 4. pp. 334–345. Gibbon, J. (1977). “Scalar expectancy theory and Weber’s law in animal timing”, Psychological Review, Volume 84, No. 3. pp. 279–325. Keegan, O., & O’Mahony, M. (2003). “The effect of countdown pedestrian signals
on pedestrian behavior”, Transportation Research Part A: Policy and Practice, Volume 37, No. 10. pp. 889–901. Limanond, T., Prabjabok, P., & Tippayawong, K. (2009). Exploring impacts of countdown timers on traffic operations and driver behavior at a signalized intersection in Bangkok. Transport Policy, 16(5), 201–207. Maister, D. H. (1985). “The psychology of waiting lines”, In J. A. Czepiel, M. R.
Solomon, & C. F. Surprenant (Eds.), The Service Encounter: Managing Employee/ Customer Interaction in Service Businesses, Lexington Books. pp. 113–124.
Effect of Pedestrian Signal Display Methods on Perceived Waiting Time 477 Ohashi, T. (2009). “Effect of remaining time display function on crossing behavior
at crosswalks”, Miyagi Gakuin Women’s University Faculty of Developmental Science Research, Volume 9, pp. 71–80. Schwebel, D. C., Gaines, J., & Severson, J. (2008). “Validation of virtual reality as a tool to understand and prevent child pedestrian injury”, Accident Analysis & Prevention, Volume 40, No. 4. pp. 1394–1400. Yokoseki, T., Mori, K., & Yano, N. (2018). “Influence of Pedestrian Green Remaining
Time Display on Pedestrian Crossing Behavior”, Journal of Traffic Engineering, Volume 4, No. 1. pp. B_6-B_11. Zakay, D., & Block, R. A. (1997). “Temporal cognition”, Current Directions in Psychological Science, Volume 6, No. 1. pp. 12–16.
LISTED IN THE AHFE DIGITAL BOOKSTORE CATALOGUE
Explore the complete digital volume
Advances in Human Factors of Transportation
Read this individual research paper free through the original publisher, or explore the full digital proceedings book.
ISBN 979-8-950676-00-0
Explore this ISBN in the AHFE Bookstore ↗Listed in the July 2026 bookstore catalogue; search by ISBN to confirm current availability · Digital book purchase optional