Shinichi Fukuzumi (2026). Measurement and quantification of quality characteristics in quality-in-use. In: Industrial and Systems Engineering. AHFE Open Access, vol. 219, pp. 12–20. https://doi.org/10.54941/ahfe1007771
Quality-in-use model which is one of software engineering quality standard series (SQuaRE) has been revised in 2023. As a result of this, ISO/IEC 25022 which described about the measurement of quality in use also be required to revise. As the concept of this standard is to deal with influence on stakeholder by use of product, system and service in specified context of use as quality, the target stakeholders were wider. According to this change, measurement methods for “Beneficialness” and “Acceptability” which are new quality characteristics and “usability” which is one of the sub-characteristics in “Beneficialness” are also required. This paper shows the new concept for measuring these quality characteristics, especially “Beneficialness”. "Beneficialness" is structured by "usability", "accessibility" and "suitability" as quality sub-characteristics. , By representing these sub-characteristics as measures of quantitatively, new quality models can be measured.
Quality-in-Use model ISO/IEC 25019 which is a standard Quality-in-use model in SQuaRE (System and software Requirements and Evaluation) series has been published in November 2023 ( ISO/IEC 25019 (2023)). The concept of this standard is to deal with influence on stakeholders by using product, system and service in specified context of use as quality (Fukuzumi, and Wada (2021)).
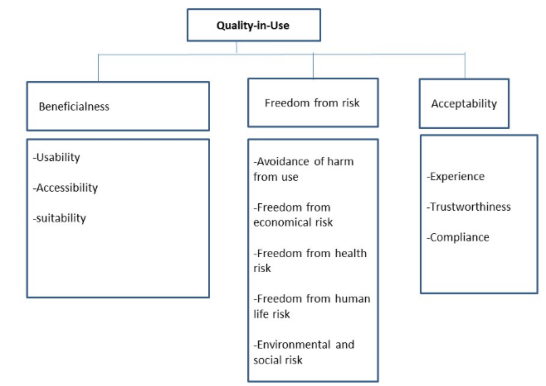
Figure 1 shows the overview of this model and Table1 shows the concrete items of influence (Fukuzumi, (2023)).
The objectives which are influenced by use of system and software is not only their direct users but also include various kinds of stakeholders. Contents of influence (quality characteristics) are different by the difference of objects. From this, the author classifies these objects into four groups shown below and the quality-in-use model for each group is defined.
- Operator of system and/or software - Organization which has responsibility for system and/or software management - Customer using system and/or software - Society which exists system and/or software Received February 6, 2026; Revised April 10, 2026; Accepted April 27, 2026; Available online July 20, 2026
Measurement and Quantification of Quality Characteristics in Quality-In-Use 13 When “quality-in-Use” is considered, it is necessary to clarify which group is focused. Because quality models for use of system and product are different by the difference of objects described above influence is different by different of target when considering quality of same product or system by use.
Figure 1: Quality-in-use model (modified) (Fukuzumi, S. (2023)).Table 1: Concrete items of influence by use (modified) (Fukuzumi, S. (2023)).
Table available in the original PDF paper.
OBJECTIVES To consider the influence of each stakeholder, the relationship between each stakeholder’s needs and quality characteristics / sub-characteristics shown in Table 2 (Fukuzumi, (2023). To deal with the influence on stakeholders as quality like this, it is necessary to be able to represent and measure quality characteristics shown in the model by quantification.
The purpose of this research is to propose the indices of measurement for each quality characteristics / sub-characteristics. It is important that the measurement and the evaluation are different. It is not described how to evaluate quality-in-use using the measurement indices.
QUALITY MEASUREMENT POLICY AND THE MEASUREMENT FOR PREVIOUS QUALITY-IN-USE MODEL
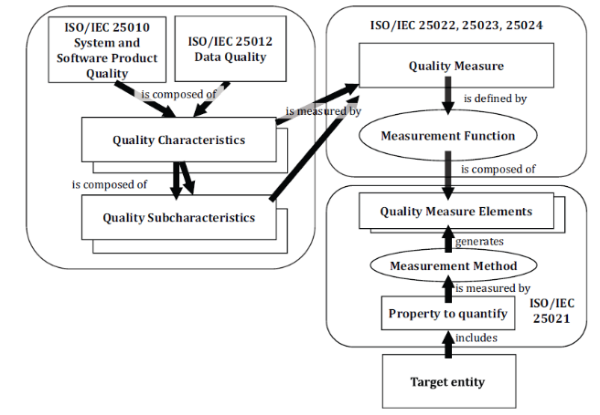
Figure 2 shows the concept of quality measurement described in ISO/IEC 25022 (ISO/IEC 25022 (2016)).
Figure 2: Concept of quality measurement (ISO/IEC 25022 (2016)).
As shown in this figure, quality characteristics / quality sub-characteristics are measured by quality measure, and quality measures are defined by measurement functions. This concept is common in SQuaRE series; hence, this shall be applied to measurement of new quality-in-use. From this, measurement targets are mainly focused on quality sub-characteristics in quality-in-use.
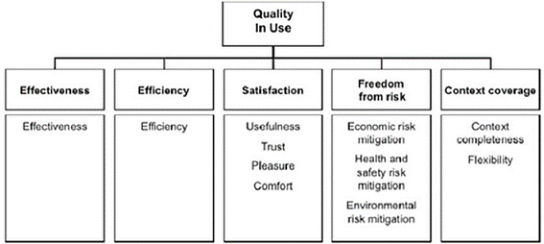
The previous quality-in-use model had been published in 2011. Figure 3 shows the previous quality in use model (Fukuzumi, et al. (2020)).
Figure 3: Quality in use model (previous version: 2011) (Fukuzumi, et al. (2020)).
Traditionally, usability is defined as learnability, efficiency, memorability, errors and satisfaction (Nielesn, 1993). As understandable from this figure, three of these quality characteristics are much related to Nielsen’s usability elements. However, the measurement methods of these elements are not defined clearly. Hence, using this quality measurement, usability can be measured in common. For example, a function about effectiveness described in previous measurement of quality-in-use is shown below.
Effectiveness (Tasks completed): This meaning is the proportion of the tasks that are completed correctly without assistance, that is, X = A/B A = Number of unique tasks completed B = Total number of unique tasks attempted
In addition to this, there are also objectives achieved, errors in a task, and so on. Like this way, it can be measured for three elements of usability.
However, this is only measured the elements. To measure and represent usability, it is necessary to show as a function of three elements shown in ISO 9241-11 (ISO 9241-11, 2018). For example, usability = f(effectiveness, efficiency, satisfaction)
The variables inside the function are elements of Quality-in-Use shown in Table 1. In the next section, examples of proposed measurement function are shown.
INDICES OF QUALITY-IN-USE BY QUALITY MEASURES Quality-in-use has three quality characteristics. They are, “Beneficialness”, “Freedom from risk” and “Acceptability”. These definitions are as follows: (ISO/IEC 25019)
- Beneficialness; “extent of benefit resulting from the use of a product, system or service” - Freedom from risk: “extent to which a product or system mitigates the potential risk to economic status, human life, health, society, financial values, enterprise activities, or the environment” - Acceptance: “extent to which a human response is favorable when accepting or installing a product, system or service software tool designed to perform some frequently used function”
Table 2 to table 4 show the relationship among quality characteristics and sub-characteristics of quality-in-use, quality measures and their functions. In these, quality measures for “Freedom from risk” are referred to the measures described in previous version ( ISO/IEC 25022 (2016)).
Table 2 shows the proposed measurements for Beneficialness.
X = Σi (Ai / B) / C Ai = number of functions user (i) can use easily B = number of functions installed C = size of target evaluation group Conformance ratio of accessibility guideline X = A / B A = number of guideline items met B = total guideline items
suitability Suitability X = A / B A = number of specified quality- in-use requirements met B = total specified quality-in-use requirements As described above, according to the concept of quality characteristics shown in Figure 3, “usability” is represented like this equation. And more breakdown is not required.
usability = f(effectiveness, efficiency, satisfaction) However, in previous version, ”effectiveness”, “efficiency”, “satisfaction” which are variables in the equation are measures and equations to represent each measure are prepared.
Effectiveness (Tasks completed) =A/B: A = Number of unique tasks completed B = Total number of unique tasks attempted Efficiency (Productive time ratio) = Ta/Tb
Measurement and Quantification of Quality Characteristics in Quality-In-Use 17 Ta = Productive time = time taken to complete the task - time spent getting help or assistance - time taken recovering from errors - time taken searching ineffectually Tb = Task time
Satisfaction (Satisfaction with features) =ΣAi Ai = Response to a question related to a specific feature Though this is one example, usability can be measured by using these variables shown above.
About accessibility, as some guidelines exists (WCAG, 2025), It is suitable to apply the ratio at which the items specified therein are met. Suitability is defined as “extent to which behaviours or outcomes, or both, of a product meet (satisfy) specified quality requirements when used” in ISO/ IEC 25019. From this, the ratio of quality in use requirements that are met is considered to be able to be used as a measurement.
Table 3 shows the proposed measurements for Freedom from risk (partial)
Table 3: Proposed measures for “Freedom from risk (partial)” (ISO/IEC 25022 (2016)).
Table available in the original PDF paper.
Characteristics Sub-Characteristics Measure Measurement Function Freedom from risk (2) Freedom from health risk
User health reporting frequency
X = A / B A = the number of users of products reporting health problem B = the amount of product users Tbd
Influence on health and safety for user Using time of product by user
X = A / B (For products that impose a health burden on the user in proportion to the usage time) A = Product usage time B = estimated usage time (Example: Game usage time limit)
Influence on environment
Freedom from environmental and social risk
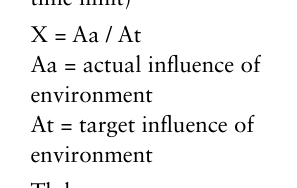
Equation reproduced from the original PDF.
Freedom from human life risk
Influence on health and safety for user Tbd Human safety influenced by use of system
As described above, measurements of “risk” are not changed from previous version. About some “tbd” items, it is necessary to discuss to the future. Table 4 shows the proposed measurements for Acceptability
Table 4: Proposed measures for “Acceptability”.
Table available in the original PDF paper.
Characteristics sub-characteristics measure Measurement function X = A / B Acceptability Experience The ratio of knowledge or skill acquired and provided
A = the number of specialized field of knowledge or skill acquired by users or stakeholders B = the number of specialized field of knowledge or skill which a system, software and service may provide
Trustworthiness The ratio of validable user requirements and defined user requirements
X = A / B A = the number of validable user requirements which satisfy user or stakeholders B = the number of defined user requirements
Compliance The ratio of validable law and required obeys
X = A / B A = the number of validable law by user or stakeholder which a system, software and service obey B = the number of law which required obeys by user requirements About acceptability, quality characteristics and sub-characteristics are conceptual, hence, it is difficult to represent concretely. Regarding these measures, it is necessary to discuss continuously and to show measures with measurement methods (e.g. subjective measures).
TOWARDS INDEXING In the previous chapter, we discussed measuring sub-characteristics of quality in use. However, these are only a part of the indicators for quality in use, and do not represent measurement quantities for all stakeholder needs. To clarify this, an example is provided below to help you consider indicators for quality in use. Stakeholder needs for each quality characteristics (influence to stakeholders) are listed as follows:
• Beneficialness
SH(B)1: Increased work options
SH(B)2: Increased work assignment options
SH(B)3: Improved productivity
SH(B)4: Leading to increased tax revenue and employment by
increased corporate activity,
Measurement and Quantification of Quality Characteristics in Quality-In-Use 19 [Equation or mathematical symbol available in the original paper PDF] Freedom from risk:
SH(R)1: Improved health and quality of life (WLB)
SH(R)2: Maintaining the health of team members’ trust
SH(R)3: Implementation strengthens security and increases
SH(R)4: Implementation reduces congestion during rush hour [Equation or mathematical symbol available in the original paper PDF] Acceptability:
SH(A)1: Maintaining communication within the team, preventing isolation
SH(A)2: Active team members
SH(A)3: Improved brand image through implementation
SH(A)4: Increased facilities and improved equipment are also
beneficial for residents
Table 5 shows the specific stakeholder needs for quality in use when introducing an ABW system (not a system).
Table 5: Detail example of stakeholder needs and quantification methods for indexing quality characteristics.
Table available in the original PDF paper.
Stakeholder 1 (Worker)
Stakeholder 2 (Manager)
Stakeholder 3 (Officer, Organization)
Stakeholder 4 (Public, Government)
Beneficialness (B) Ease to work (Subjective evaluation)
Ease to arrange team formation (Subjective evaluation)
Improved productivity (Ratio of before / after installation)
increased tax revenue and employment (Ratio of before / after installation)
Freedom from risk (R)
Increase WLB (Subjective evaluation)
Increase security level (Number of accident)
Reduce accident (Number of accident)
Keep health and safety for team members (Subjective evaluation)
Acceptability (A) Active
Increased team unity (Subjective evaluation)
Model area (Government investigation)
communication in team members (Subjective evaluation)
Improved brand image through implementation (Market investigation) These can be expressed as functions below.
- Degree to increase benefiialness (B) =f(SH(B)1, SH(B)2, SH(B)3, SH(B)4) - Degree to increase freedom from risk (S)
=f(SH(S)1, SH (S) 2, SH (S) 3, SH (S) 4) - Degree to increase acceptability (A) =f(SH (A) 1, SH (A) 2, SH (A) 3, SH (A) 4)
The coefficients and weightings in these equations will differ from case to case, but by using such functional equations, it is possible to express the effect (value) of introducing the system.
PROPOSAL Software quality is one of the most important themes in software engineering area. In this, as quality-in-use model is a new concept from the viewpoint of stakeholders includes direct user, the structure of this model is diverse and complex. Hence, it is difficult to represent these quality characteristics and sub-characteristics as measures.
This paper proposed measurement methods and indices of quality-in-use characteristics and sub-characteristics as measures of functions.
Of course, it is difficult to represent quality completely. However, it is important trial to evaluate quality-in-use.
REFERENCES
Fukuzumi, S. and Wada, N. (2021). Quality-in-Use: Case study for evaluation, M.
Kurosu (Ed.): HCII2021, LNCS 12762, pp 343-350. Fukuzumi, S., Wada, N. and Hirasawa, N. (2020). Quality in Use -Issues and proposal-, IWESQ2020. Fukuzumi, S. (2023). Validation of Items of Aspects of Interests in Quality-In-Use
-Stakeholder Needs of Each System Domain-, Mori, H. and Asahi, Y. (Ed.), HCII2023, (LNCS, volume 14016), pp 22-34. ISO 9241-11 (2018). Ergonomics of human-system interaction -Part 11: Usability: Definitions and concepts. ISO/IEC 25019 (2023). Systems and software engineering - Systems and software
Quality Requirements and Evaluation (SQuaRE) - Quality-in-use model. ISO/IEC 25022 (2016). Systems and software engineering -Systems and software quality requirements and evaluation (SQuaRE) - Measurement of quality in use. Nielsen (1993). Usability Engineering, Academic Press. WCAG (2025). Web Content Accessibility Guidelines (WCAG) 2.1, W3C
Recommendation 06 May 2025.
LISTED IN THE AHFE DIGITAL BOOKSTORE CATALOGUE
Explore the complete digital volume
Industrial and Systems Engineering
Read this individual research paper free through the original publisher, or explore the full digital proceedings book.
ISBN 978-1-964867-95-3
Explore this ISBN in the AHFE Bookstore ↗Listed in the July 2026 bookstore catalogue; search by ISBN to confirm current availability · Digital book purchase optional